Transcription
How To GuideNetApp Cloud InsightsEnhance Monitoring by Understanding the RelationshipsBetween ResourcesRichard Treadway, Product Marketing Manager, NetAppApril 2019 WP-7302AbstractYour IT environment is more complex and more dynamic than ever before. Heterogeneousinfrastructure, hybrid and multi-cloud deployments, and a mix of traditional and cloud-nativeapplications make monitoring even more critical—and more difficult. NetApp Cloud Insights isa SaaS monitoring solution that provides powerful, easy-to-use dashboards, queries,annotations, and alerts. This How To Guide looks at how to monitor your environment andmeet critical SLAs with less effort.
TABLE OF CONTENTS1About This How To Guide Series .32There Are No Silver Bullets, but There Is a Better Way .33Monitoring Is a Skill, Not a Job .4A Day in the Life: Monitoring and Troubleshooting Without Cloud Insights . 54Understand the Relationships Between Resources with Cloud Insights .6A Day in the Life: Monitoring and Troubleshooting with Cloud Insights . 75Setting Up Your Cloud Insights Environment .85.1 Configuring Acquisition Units. 85.2 Collecting Data . 85.3 Setting Up Cloud Insights Annotations . 95.4 Using Queries to Create Annotations . 105.5 Creating Alerts Based on Performance Policies. 116Monitoring Your Environment with Cloud Insights Dashboards .136.1 Identifying Correlations and Viewing Topologies. 156.2 Custom Dashboards . 1572Summary and Next Steps .17NetApp Cloud Insights: Enhance Monitoring 2019 NetApp, Inc. All Rights Reserved.
1 About This How To Guide SeriesThis How To Guide is number two in a series about NetApp Cloud Insights, an innovative software-as-aservice (SaaS)–based monitoring tool that spans on-premises and cloud environments. Cloud Insightshelps you monitor, troubleshoot, and optimize your storage systems, from legacy hardware to containerenvironments. The papers in this series cover these topics: NetApp Cloud Insights: A New Way to Monitor Your Cloud InfrastructureNetApp Cloud Insights: Enhance Monitoring by Understanding the Relationships between Resources How to Troubleshoot Problems in Your Cloud InfrastructureHow to Optimize Your Cloud InfrastructureThis series focuses on monitoring in virtual machine (VM) environments, both on premises and in thecloud. A future How to Guide series will explore the same issues for containers and Kubernetesenvironments.2 There Are No Silver Bullets, but There Is a Better WayMonitoring the health of the applications, services, and infrastructure in your IT environment has alwaysbeen important, but today effective monitoring has become essential. In this digital era, enterprisesacross all industries depend on IT services to control business operations, to inform decisions, to driverevenue, and to enable growth. Your company’s reputation is now closely tied to the effectiveness andsecurity of your customer-facing and internal digital services.But your IT environment is more complex and more dynamic than ever before. Your current operationscan include: Hybrid cloud and multicloud. Your critical services might run not just on premises, but also acrossmultiple cloud service providers, including SaaS providers. The number and importance of remoteoffices, production facilities, and distribution centers have also increased.Diverse infrastructure. You have a broad range of infrastructure and infrastructure services tosupport, from legacy hardware to virtualized infrastructure to containers. Traditional and cloud-native applications. You must contend with traditional enterpriseapplications such as critical enterprise resource planning and customer relationship managementsoftware along with new cloud-native applications that have much different expectations from, andimpacts on, infrastructure.As a result, monitoring your IT environment—and effectively troubleshooting problems that arise—is morechallenging than ever. You continue to look for better tools to monitor the entirety of your environmentwhile minimizing the number of false alarms and the time that you spend on chasing down problems.NetApp Cloud Insights overcomes the limitations of traditional monitoring tools, so you can efficientlymonitor infrastructure on premises and in the cloud. With Cloud Insights, you can understand at a glancehow the elements that make up your IT environment are connected, so you can troubleshoot problemsmore effectively and optimize your environment to deliver better results at lower cost.This white paper explores the monitoring capabilities of Cloud Insights in more depth. It also explores howyou can take advantage of Cloud Insights dashboards, queries, annotations, and alerts to create a moreeffective monitoring framework so that you can meet critical SLAs.3NetApp Cloud Insights: Enhance Monitoring 2019 NetApp, Inc. All Rights Reserved.
3 Monitoring Is a Skill, Not a JobAs Mike Julian notes in his book, Practical Monitoring, monitoring is a skill that everyone on your IT teamneeds. It’s not something that you can simply assign to one person—or to a team of people—and forgetabout. No one can design effective monitoring for applications or infrastructure if they aren’t directlyconnected with it.Everyone on your team has to perform monitoring tasks. For example, virtualization administrators haveto be directly involved in monitoring virtual environments. Effective monitoring tools enable them torecognize trends in the virtual environment and to plan for growth. The same thing goes for storageadministrators and network specialists, who need monitoring tools for their specific tasks. No single toolsatisfies every need. Your operations team will continue to rely on monitoring tools and elementmanagers that are suited to particular tasks, even as you adopt new tools to get a more global view.As your organization moves to a DevOps approach, your team needs real-time service-level indicators(SLIs) to confirm that your systems are meeting SLAs and service-level objectives (SLOs) both onpremises and in the cloud. You might also be facing the challenges of managing hybrid applications thatrely on services in multiple locations. A simple example is an application with customer-facingcomponents in the cloud that uses a database in your data center.Domain-specific tools for managing hypervisors, networks, and storage weren’t created for this type ofmonitoring, but more comprehensive monitoring frameworks also have limitations. Even using today’sbest practices and the best available tools, it can be difficult to get the information you need, when youneed it. Existing monitoring tools: Cannot store and analyze data at cloud scaleDon’t keep up with the dynamic nature of the cloud and cloud-native applications Monitor things (servers, VMs, storage, and so on), but not the relationships between thingsNetApp has designed Cloud Insights to help your team bridge these gaps.4NetApp Cloud Insights: Enhance Monitoring 2019 NetApp, Inc. All Rights Reserved.
A Day in the Life: Monitoring and Troubleshooting Without Cloud InsightsTo understand the monitoring challenge, consider a hypothetical day in the life of a virtualizationadministrator.9 a.m. Arrive at work. Check the VM dashboard. It’s all clear.9:05 a.m. Start working on a critical, high-value project.9:30 a.m. Users report that an important application is “slow.”9:32 a.m. Check the VM dashboard again. It’s all clear.9:35 a.m. Identify and check VMs associated with the application. They look “okay,” but there’ssome latency.9:45 a.m. Identify and check the physical hosts where VMs are running. CPU and memory usageare okay.9:50 a.m. Attempt to determine whether storage is the issue; identify datastores being used byapplication VMs.9:55 a.m. The VM monitoring tool doesn’t show correlated storage device metrics.10 a.m. Access the storage management tool. Try to correlate information between VMmanagement tools and storage management tools.10:05 a.m. Call the storage administrator. The administrator doesn’t answer.10:10 a.m. File an urgent trouble ticket.10:15 a.m. No response to the ticket is received yet.10:30 a.m. Escalate the ticket.10:45 a.m. Work with the storage administrator on the phone to try to correlate the affected VMswith the storage device data.11:15 a.m. By comparing VM and storage views, verify that a shared volume is the culprit.11:30 a.m. Determine that another unrelated VM is hammering the same volume.11:45 a.m. After discussing alternatives, the storage administrator suggests moving the offendingVM to a different volume.11:50 a.m. Move the offending VM.Noon. Application performance returns to normal.12:05 p.m. Make a note to follow up with the owner of the offending VM.12:10 p.m. Eat lunch.1 p.m. Restart work on the critical project.1:15 p.m. Users are reporting slowdowns for a different application.Repeat the process Staff time: VM administrator—2.5 hours; storage administrator—1.25 hoursUser impact: 2.5 hours5NetApp Cloud Insights: Enhance Monitoring 2019 NetApp, Inc. All Rights Reserved.
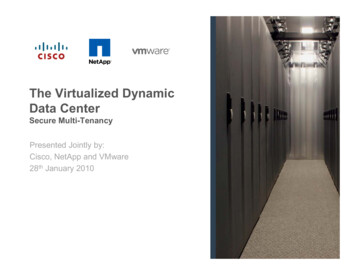
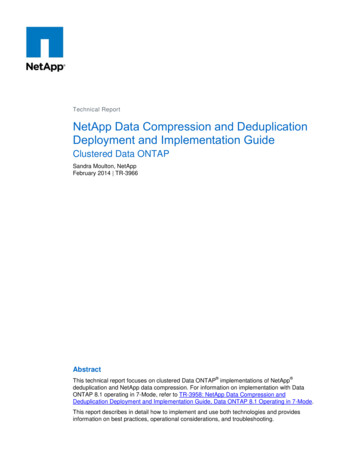
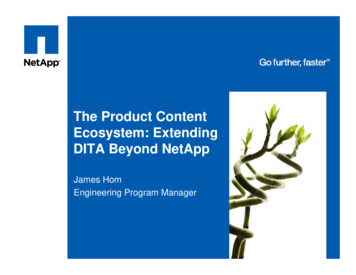
4Understand the Relationships Between Resources with Cloud InsightsNetApp Cloud Insights gives you the power to store and analyze critical monitoring data at cloud scale. Asingle tool shows you everything in your IT environment, both in your data centers and in the cloud. Yousee updates in near real time and can view trends and changes over extended periods (90 days with theCloud Insights Standard Edition).To help you make sense of your environment, gain a better understanding of your operations, andconfirm that you meet service levels, best practices suggest that you focus on four key SLI signals. AsFigure 1 shows, those signals are latency, saturation, traffic, and errors. (The book Site ReliabilityEngineering: How Google Runs Production Systems is a good reference for monitoring best practices.)Figure 1) Cloud Insights signals. Latency. When latency spikes, users are affected and start submitting trouble tickets. Cloud Insightsdashboards focus on latency as a key indicator so that you can identify and correct latency problemsbefore users complain.Saturation. Latency issues often result when you ask too much of a device and begin to push itbeyond its resource limits. Understanding the cause of saturation is a key step in root-cause analysis.Cloud Insights simplifies identification of saturation points and provides intelligent alerts thatdistinguish between momentary spikes and real problems.Traffic. Saturation might be triggered by an increase in traffic. An unexpected rise in user demand ora misbehaving application can create noisy-neighbor effects that can affect unrelated applications.Cloud Insights helps you correlate increased latency with other events that are driving traffic.Errors. Errors and alerts are a fact of life in any IT environment. Cloud Insights helps you quicklydetermine when an error indicates that a real problem exists, discover the root cause, and beginremediation. The “Day in the Life” scenario above illustrates a problem that is common with many monitoring tools. Inlarge-scale IT environments, it is difficult or impossible to correlate metrics across resources—betweenVMs and storage devices in the example—to identify and correct performance problems. Often it canrequire hours of effort from people with significant domain expertise to get to the bottom of what shouldbe a simple problem.A key advantage of Cloud Insights is that it automatically discovers service paths, so you can see therelationships between resources and can correlate events to understand cause and effect. To illustratethe difference that this capability can make, let’s revisit the same scenario, this time with Cloud Insights.6NetApp Cloud Insights: Enhance Monitoring 2019 NetApp, Inc. All Rights Reserved.
A Day in the Life: Monitoring and Troubleshooting with Cloud InsightsLet’s revisit the hypothetical “day in the life” of a virtualization administrator that was presented earlier,this time with Cloud Insights.9:00 a.m. Arrive at work. Check the Cloud Insights VM violations dashboard. Note that an importantapplication VM experienced high latency overnight and that the problem is starting to occur again asusers log in for the day.9:01 a.m. Drill down on the affected VM expert view in Cloud Insights. Note immediately that the VMis being affected by a “greedy” VM on the same storage volume.9:02 a.m. Move the application VM to an appropriate datastore on another storage volume that youcan see from a Cloud Insights storage dashboard is lightly loaded.9:05 a.m. to noon. Finish a critical, high-value project.Staff time: VM administrator—5 minutes; storage administrator—0 minutesUser impact: NoneThe rest of this white paper explores the monitoring features of Cloud Insights.7NetApp Cloud Insights: Enhance Monitoring 2019 NetApp, Inc. All Rights Reserved.
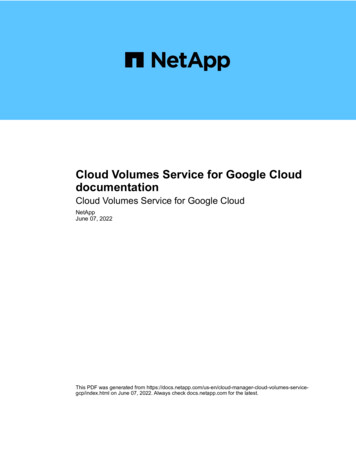
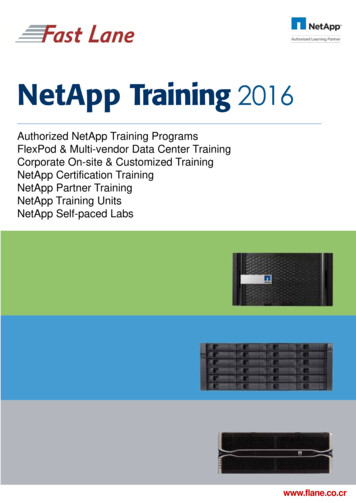
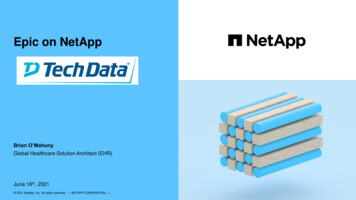
5 Setting Up Your Cloud Insights EnvironmentNetApp Cloud Insights provides various capabilities that enable you to better monitor your operations,both on premises and in the cloud. This section explains how to get started collecting data and describeshow to configure: AnnotationsQueries Policy-based alerts5.1Configuring Acquisition UnitsTo launch NetApp Cloud Insights, go to cloud.netapp.com/cloud-insights. After you have registered for afree trial, you must create an acquisition unit as described in the previous white paper in this series,NetApp Cloud Insights: A New Way to Monitor Your Cloud Infrastructure.The acquisition unit sits behind your firewall, virtual private cloud, or virtual network and injects data fromyour operations into Cloud Insights for analysis. You can use a single acquisition unit for multiple datacollectors. You can set up additional acquisition units as needed. For example, you might want differentacquisition units for data centers in different regions or for public cloud environments.5.2Collecting DataCloud Insights supports a wide range of data collectors, including collectors for the major cloud providersand a broad selection of enterprise infrastructure hardware and software providers, as illustrated in Figure2. A collector is a purpose-built tool for a particular device type that runs vendor-specific, read-onlycommands to gather inventory and performance metrics from discovered devices. After you have at leastone acquisition unit, you can add as many data collectors as you need. You can access the list of datacollectors from the Admin menu in the left-hand pane of the Cloud Insights UI.Figure 2) Configuring Cloud Insights data collectors. (Not all available data collectors are shown; CloudInsights supports more than 100 collectors.)To add a data collector, click the associated tile. NetApp makes the data collector configuration processas painless as possible. To configure an AWS collector, for instance, you simply choose an AWS regionand supply your existing AWS access credentials.8NetApp Cloud Insights: Enhance Monitoring 2019 NetApp, Inc. All Rights Reserved.
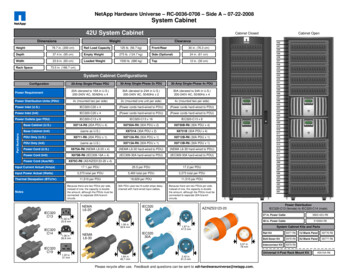
Because data collectors are the primary source of information for Cloud Insights, NetApp displays thestatus of the associated data collector in the upper-right corner of each asset page. Clicking the messagedisplays a table with the data collector name, status, and last successful acquisition time.The Installed Data Collectors page gives you access to all the data collectors that you have configured forCloud Insights. Use this page to manage your existing set of data collectors.After you have at least one acquisition unit and at least one data collector, there’s nothing else that youneed to do. You can start using Cloud Insights to monitor your environment. However, to get the mostfrom your Cloud Insights environment, you might want to take some additional steps, including: Set up annotationsUse queries to automate annotationsConfigure alerts on critical resources5.3Setting Up Cloud Insights AnnotationsSome information can’t be obtained through discovery alone. By using annotations, you can add customdata that is specific to your needs and your business. Cloud Insights provides a set of default annotationsthat you can use, such as asset lifecycle, building or data center location, and tier. However, you mightfind that you need to slice monitoring data in other ways.To create an annotation, click the Manage button in the left-hand pane and select Annotations to accessthe Annotations page as shown in Figure 3.Figure 3) Cloud Insights Annotations page.The Annotations page shows all the predefined annotations that are available and any customannotations that you have created. You can create custom annotations by clicking the Annotationbutton in the upper-right corner. Each annotation has a name, a description, and a type, as shown inFigure 4.9NetApp Cloud Insights: Enhance Monitoring 2019 NetApp, Inc. All Rights Reserved.
Figure 4) Adding an annotation to Cloud Insights.You can assign the annotations to assets manually, or you can use Cloud Insights queries to automatethe process.5.4Using Queries to Create AnnotationsCloud Insights provides a flexible query mechanism that enables you to monitor and troubleshoot yourhybrid cloud environment easily. You can search assets at a granular level based on various criteria,including annotations and performance metrics.You can slice data by adding filters and by sorting the results to view inventory and performance data inone view. For example, you can quickly create a query to find all storage systems in a particular datacenter as shown in Figure 5.Figure 5) A Cloud Insights query to find storage based on subnet.In this example, the query filters by Storage and then by IP address to narrow the results to a particularsubnet. You can use as many criteria as you need to achieve the desired results. After you have createdthe query that you want, you can give it a name and save it for future use. In this example, we havenamed the query “Find My NANE [NetApp New England] Storage.”10NetApp Cloud Insights: Enhance Monitoring 2019 NetApp, Inc. All Rights Reserved.
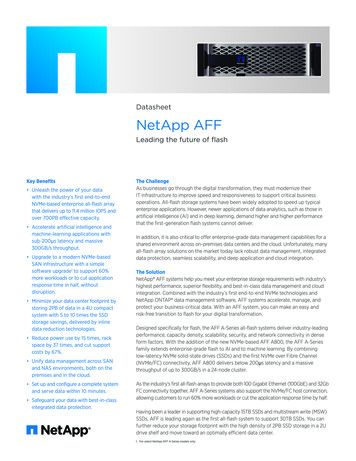
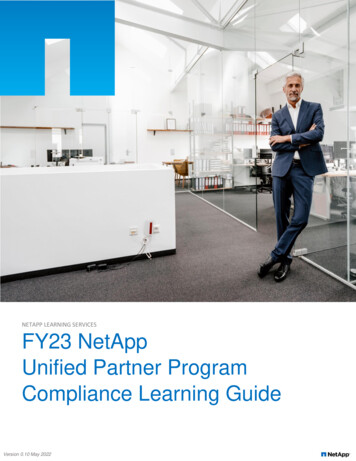
You can embed queries in dashboard widgets, and you can access all your saved queries from theQueries menu in the left-hand pane of the Cloud Insights UI. After you create a query, you can use itagain (the view updates as new data is collected), modify it, or delete it.You can also combine the power of queries and annotations to confirm that new assets are annotatedautomatically by applying annotation rules. From the Manage menu, you simply select Annotation Rulesto bring up the Annotation Rules page that shows all your existing rules. Select Rule in the upper-rightcorner to add a new rule, as illustrated in Figure 6.Figure 6) Adding an annotation rule to a query.In this example, we add an annotation rule called Tag My NANE Storage and associate it with the querythat we created in the example in Figure 5. The specific annotation is Data Center, and the associatedvalue is NANE ISElab.After you create a rule, Cloud Insights automatically runs the rule every 15 minutes. So, in this example, ifany new storage systems were added to the data center NANE ISElab, they would be detected within 15minutes and annotated automatically.5.5Creating Alerts Based on Performance PoliciesWith Cloud Insights, you can create performance policies to generate alerts when a resource exceeds aspecific SLI. This feature enables you to proactively monitor your environment to detect problems beforethey affect your operations. You can quickly create targeted alerts to detect problems while reducing thenoise in your monitoring environment to avoid alert fatigue.As Figure 7 illustrates, to create an alert, you specify a name, the object type, and any specificannotations that the policy applies to. You can also specify the severity of the alert and when it istriggered.A key to the power of Cloud Insights alerting is the ability to easily specify multiple thresholds. Supposethat you have an SLA that mandates that certain VMs maintain total latency below 25ms. In the examplein Figure 7, we have created a threshold to generate a warning when any of the VMs in the NANE ISElabexceed 20ms for more than 5 minutes. A second threshold on this alert takes effect when CPU utilizationexceeds 80%, a sign that a VM might be at risk of becoming overloaded.11NetApp Cloud Insights: Enhance Monitoring 2019 NetApp, Inc. All Rights Reserved.
Figure 7) Add Policy dialog box.You can specify as many thresholds for an object type as you need. An alert can be set to take effect onlyif all of the thresholds are crossed, as in this example, or you can specify that it is triggered if any of thethresholds is reached. This feature gives you the ability to fine-tune alerts by changing when they areapplied, by increasing or decreasing a threshold value, or by adding more thresholds. This capabilityenables you to limit the number of false alarms and to receive alerts only when they are truly warranted.Figure 8 shows an example Cloud Insights alerts page.12NetApp Cloud Insights: Enhance Monitoring 2019 NetApp, Inc. All Rights Reserved.
Figure 8) Cloud Insights alerts.6 Monitoring Your Environment with Cloud Insights DashboardsAfter you have configured NetApp Cloud Insights, much of your day-to-day monitoring can beaccomplished using dashboards. Cloud Insights comes with a default set of dashboards that is based onthe data collectors that you enable. Each dashboard is designed to help you answer specific questionsabout your infrastructure, such as: Where is your system experiencing high latency?Where have SLOs been exceeded? Where are errors occurring?Cloud Insights dashboards are designed to provide immediately actionable information. For example,Figure 9 illustrates a dashboard that shows VM latency.13NetApp Cloud Insights: Enhance Monitoring 2019 NetApp, Inc. All Rights Reserved.
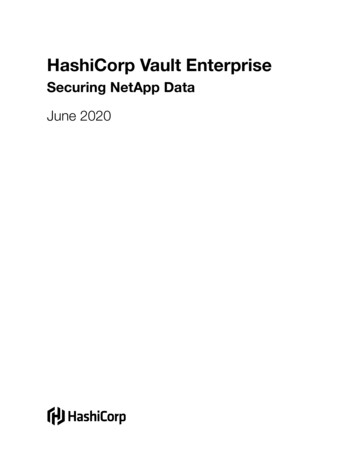
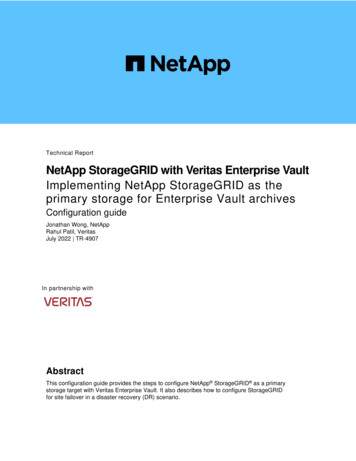
Figure 9) Example Cloud Insights dashboard that shows VM latency.You can filter this view to show data for a longer or a shorter period. (Many monitoring and managementtools provide access only to a few hours of data.) You can also click the name of any VM to drill down tomore information about that particular asset. For instance, you might want to drill down on each of thehigh-latency VMs to identify any issues. Figure 10 shows example results when an operator drills downon a high-latency VM.Figure 10) Drilling down to an individual resource.14NetApp Cloud Insights: Enhance Monitoring 2019 NetApp, Inc. All Rights Reserved.
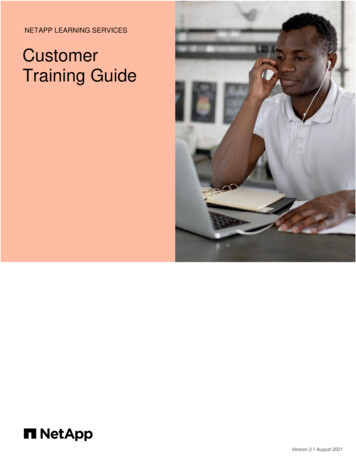
6.1Identifying Correlations and Viewing TopologiesFrom an asset page like the one in Figure 10, you can explore all the metrics that are associated with theasset (in this case, a VM) to identify sources of latency. The pane in the center-right shows the topcorrelated resources and any greedy resources. You can also view the full topology for the VM, as shownin Figure 11, to see what hypervisor the VM is connected to and what back-end storage the VM is using.Figure 11) Topology for the VM that is shown in Figure 10.6.2Custom DashboardsCloud Insights allows you to create custom dashboards by using various widgets and gives you greatflexibility in displaying and in charting your data. Although you can accomplish a great deal by using thedefault dashboards, as you use and become familiar with the solution, you will see ways that you canaccomplish even more.With custom dashboards, your team can create highly tailored views to meet diverse monitoring andtroubleshooting needs. You can start from an existing dashboard and customize it, or you can createentirely new dashboards from scratch, using powerful tools to visualize your data. Each of youradministrators can set a particular custom dashboard as their home page within Cloud Insights. Forexample, Figure 12 shows a simple but useful custom dashboard that is designed to make it easy to findall storage, hypervisors, and VMs grouped by data center.15NetApp Cloud Insights: Enhance Monitoring 2019 NetApp, Inc. All Rights Reserved.
Figure 12) Custom dashboard that groups all storage, hypervisors, and VMs by data center.The advanced capabilities of Cloud Insights extend far beyond this simple example. Some of theavailable dashboard widgets include: Line, Spline, Area, Stacked Area Charts: time-series chart widgets on which you can displayperformance and other data over timeBar, Column Charts: displays of top or bottom N values; for example, top 10 storage systems bycapacity or bottom 5 volumes by IOPSBox Plot Chart: minimum, maximum, median, and the range between the lower and upper quartile ofdata in a single chart Scatter Plot Chart: plots that relate data points; for example, IOPS and latencyViolations Table: displays of up to the previous 1,000 performance policy violationsTable: table that displays data according to filters and columns that you chooseCloud Insights dashboards and widgets give you great flexibility and control over how data is processedand displayed, including: Queries. Use this powerful tool to manage the data that is displayed in a widget. Some types ofwidgets support up to five queries. Roll-up and Aggregation. Roll up data or aggregate time-series data to display the average,maximum, minimum, or sum.Top/bottom Results. Easily display the top or bottom results for rolled-up data.Expressions. Any time-series widget allows you to build expressions from the metrics that youchoose and to show the result of those expressions. For example, you can calculate and show theread percentage by using the following expression: Read Percentage (Read IOPS / Total IOPS) x 100 Variables. Change the data that is displayed in some of or all the widgets on a dashboard at oncebased on the value of a variable that you supply.Cloud Insights dashboards give you the capabilities that you need today, and they are designed to growwith your experience and with the needs of your organization.16NetApp Cloud Insights: Enhance Monitoring 2019 NetApp, Inc. All Rights Reserved.
7 Summary and Next StepsNetApp Cloud Insights can help you monitor, troubleshoot, and optimize your infrastructure. This guideexamined the monitoring capabilities of Cloud Insights, including dashboards, queries, alerting, and more.Cloud Insights goes far beyond the capabilities of simple element managers, showing you therelationships between resources so that you can identify problems and bottlenecks more quickly. Multithreshold alerts help you minimize the occurrence of false positives and maximize your ability to identifyproblems before they affect users.The next guide in this series will explore how you can use these capabilities to prevent problems fromoccurring and to more quickly troubleshoot problems that arise. And that includes the kind oftroubleshooting in which your boss is looking over your shoulder and reminding you that the company islosing 5 million an hour during the outage.To see Cloud Insights in action for yourself, register for a 14-day free trial. Go to NetApp Cloud Central athttps://cloud.netapp.com/cloud-insights to learn more about NetApp Cloud Insights and to start your freetrial.17NetApp Cloud Insights: Enhance Monitoring 2019 NetApp, Inc. All Rights Reserved.
Refer to the Interoperability Matrix Tool (IMT) on the NetApp Support site to validate that the exactproduct and feature versions described in this document are supported for your specific environment. TheNetApp IMT defines the product components and versions that can be used to construct configurationsthat are supported by NetApp. Specific results depend on each customer’s installation in accordance withpublished specifications.Copyright InformationCopyright 2019 NetApp, Inc. All Rights Reserved. Printed in the U.S. No part of this document coveredby copyright may be reproduced in any form or by any means—graphic, electronic, or mechanical,including photocopying, recording, taping, or storage in an electronic retrieval system—without priorwritten permission of the copyright owner.Software derived from copyrighted NetApp material is subject to the following license and disclaimer:THIS SOFTWARE IS PROVIDED BY NETAPP “AS IS” AND WITHOUT ANY EXPRESS OR IMPLIEDWARRANTIES, INCLUDING, BUT NOT LIMITED TO, THE IMPLIED WARRANTIES OFMERCHANTABILITY AND FITNESS FOR A PARTICULAR PURPOSE, WHICH ARE HEREBYDISCLAIMED. IN NO EVENT SHALL NETAPP BE LIABLE FOR ANY DIRECT, INDIRECT,INCIDENTAL, SPECIAL, EXEMPLARY, OR CONSEQUENTIAL DAMAGES (INCLUDING, BUT NOTLIMITED TO, PROCUREMENT OF SUBSTITUTE GOODS OR SERVICES; LO
NetApp Cloud Insights overcomes the limitations of traditional monitoring tools, so you can efficiently monitor infrastructure on premises and in the cloud. With Cloud Insights, you can understand at a glance how the elements that make up your IT environment are connected, so you can troubleshoot problems