Transcription
Journal of Advanced Ceramics2022, 11(7): -6ISSN 2226-4108CN 10-1154/TQResearch ArticleCoupling of piezocatalysis and photocatalysis for efficient degradationof methylene blue by Bi0.9Gd0.07La0.03FeO3 nanotubesAngom Devadatta MANIa,b,†, Jie LIa,b,†, Ziquan WANGc, Jiale ZHOUa,Huaicheng XIANGa, Jinlai ZHAOa, Libo DENGc, Haitao YANGa, Lei YAOa,*aShenzhen Key Laboratory of Special Functional Materials, Shenzhen Engineering Laboratory for AdvancedTechnology of Ceramics, Guangdong Research Center for Interfacial Engineering of Functional Materials,College of Materials Science and Engineering, Shenzhen University, Shenzhen 518071, ChinabKey Laboratory of Optoelectronic Devices and Systems of Ministry of Education and Guangdong Province,College of Optoelectronic Engineering, Shenzhen University, Shenzhen 518060, ChinacCollege of Chemistry and Environmental Engineering, Shenzhen University, Shenzhen 518071, ChinaReceived: January 12, 2022; Revised: March 14, 2022; Accepted: March 23, 2022 The Author(s) 2022.Abstract: Photocatalytic degradation of organic pollutants is of great significance for wastewaterremediation but is still hindered by the poor catalytic efficiency of the catalysts. Herein, we report astrategy to simultaneously introduce piezocatalysis and to enhance the intrinsic photocatalysis in asingle catalyst, which improved the performance for catalytic degradation of methylene blue (MB)significantly. Specifically, piezoelectric BiFeO3 (BFO) nanotube doped with different contents of Gdand La (Bi0.9(GdxLa1 x)0.1FeO3) were produced by electrospinning. The doping led to a higherconcentration of surface oxygen vacancy (OV) in Bi0.9Gd0.07La0.03FeO3, which effectively increasedthe piezoelectric field due to the deformation of BFO, and suppressed the recombination ofphoton-generated electron–hole pairs. The Bi0.9Gd0.07La0.03FeO3 nanotube showed excellent catalyticperformance under simultaneous light irradiation and ultrasonic excitation, giving an extraordinary95% degradation of MB within 90 min. These findings suggest that the piezoelectric effect combinedwith defect engineering can enhance the catalytic performance of Bi0.9Gd0.07La0.03FeO3 nanotube. Thiscould potentially be extended to other catalytic systems for high-performance pollutant treatment.Keywords: photocatalysis; piezocatalysis; sonophotocatalysis; oxygen vacancy (OV)1Introduction The remediation of wastewater containing high† Angom Devadatta Mani and Jie Li contributed equally to thiswork.* Corresponding author.E-mail: lyao@szu.edu.cnconcentrations of organic dyes discharged by textiles,tanning, and other industries has attracted substantialattention due to their threat to human health [1,2].Energy limitations necessitate harvesting and utilizingvarious forms of sustainable energy for water purification. Photocatalysis is an oxidation technology whichhas been regarded as a breakthrough in harvesting solarenergy to realize dye decomposition [3]. The relativelylow photocatalytic activity under visible light and thewww.springer.com/journal/40145
1070J Adv Ceram 2022, 11(7): 1069–1081fast recombination of photo-generated electron–holepairs currently limit the solar-light-driven photocatalyticefficiency. Strategies including band gap engineering,heterostructure modulating, and noble metal decoratinghave been developed to lower the recombination rateand increase the lifetime of photo-generated chargecarriers [4–9]. While much progress has been made,further effort is required to satisfactorily enhance thevisible-light-driven photocatalytic activity.In photocatalysis, photo-induced electric charges(electron–hole pairs) participate in catalytic redoxreactions. Piezoelectric charges (positive and negativecharges) induced by mechanical vibrations can also beused to drive catalytic redox reactions, which is knownas piezocatalysis [10–12]. Moreover, an internal electricfield is generated during the vibration energy harvestingprocess of piezoelectric materials which can furtherpromote charge carrier separation [13,14]. Piezoelectricnanomaterials including BaTiO3, MoS2, ZnO, BiOCl,and KNbO3 have demonstrated great potential inenvironmental remediation because of their piezocatalyticeffects that can be induced by weak mechanical forces[11,14–19]. This could increase the application of greentechnologies by harnessing renewable solar energy andutilization of the underexploited mechanical energysuch as noise and vibrations for environmentalremediation. However, there is still space to developmore efficient piezoelectric catalysts to enhance thephotocatalysis efficiency.Another effective strategy to enhance the photocatalysisperformance is through modulating the surface oxygenvacancies (OVs) [20]. OVs act as electron trappingcenters near the bottom of the conduction band (CB)and prevent the recombination of photo-generatedcharge carriers. This facilitates the holes in the valenceband (VB) to undergo oxidation, thus enhancing thephotocatalytic activity [21–24]. OVs also play a role inreducing the energy band gap (Eg) and extending thelight absorption into the visible/infrared region [25].Oxygen defective-enhancement may therefore offeropportunities to engineer and improve the performanceof piezoelectric photocatalysis. BiFeO3 (BFO) is apiezoelectric material with photocatalytic activity undervisible light. The narrow band gap of BFO permits abroad absorption of visible wavelengths up to 750 nm[26]. It has been demonstrated that the piezoelectricproperties of BFO are extremely sensitive to defects,particularly OVs [27,28]. Therefore, combining piezophotocatalysis with defective OV engineering to couplethe electron trapping effect and piezoelectric effect inBFO may further increase its piezo/photocatalytic activity.Particularly, doping of BFO by certain isovalent cationsis an effective way to introduce defective OVs and toenhance photocatalytic efficiency [29,30]. Previousstudies have reported that Gd-doped BFO can enhancevisible light photocatalytic activity in the photodegradationof organic dyes [31], and La-doped magnetic BFO-basedmultiferroics can degrade 94.5% of carbamazepine bypiezocatalysis in 30 min for water purification [32].Piezoelectric BFO also showed great promise forboosting hydrogen evolution [33]. Also, due to thesmaller ionic radii of La3 compared to Bi3 , doping Lainto BFO can increase magnetization. Moreover, theLa dopant in the BFO can improve the separation andmigration of photo-generated charge carriers and decreasethe electron–hole pair recombination probability [34].In this work, we developed a facile method tosimultaneously introduce piezocatalysis and to enhancethe intrinsic photocatalysis in a single catalyst. BFOnanotubes doped with different contents of Gd and Lawere fabricated through electrospinning. The concentrationof OVs in Bi0.9(GdxLa1 x)0.1FeO3 (x 0, 0.3, 0.5, 0.7,and 1.0) was optimized by changing the ratios of Gdand La dopants. Stimuli by both light and mechanicalstrain (ultrasonication) were used to study thepiezo-/photo-catalytic degradation of model organicpollutant methylene blue (MB). The defect-inducedOVs in Bi0.9Gd0.07La0.03FeO3 could enhance the intrinsicphotocatalytic performance, while combined with thepiezoelectric-enhanced charge separation and improvedthe overall performance. Specifically, Bi0.9Gd0.07La0.03FeO3showed an extraordinary MB degradation efficiency of95% within 90 min under simultaneous all-spectrumsolar irradiation and ultrasonic excitation. The proposeddefect engineering strategy provides a simple andlow-cost way to prepare high-performance piezo-/photo-catalysts, which has a great potential in pollutionremediation.22. 1ExperimentalPreparation of the BFO-containing nanotubesAll chemical reagents were produced as analyticalgrade and used directly without any further purification.Pristine BFO and the doped BFO nanotubes with thecompositional formula Bi0.9(GdxLa1 x)0.1FeO3 (x 0,0.3, 0.5, 0.7, and 1.0) were prepared by a simplewww.springer.com/journal/40145
J Adv Ceram 2022, 11(7): 1069–10811071electrospinning method. The precursor solution wasprepared by a two-pot method. First, stoichiometricamount of bismuth nitrate pentahydrate (Bi(NO3)3·5H2O,Mreda, USA), iron nitrate nonahydrate (Fe(NO3)3·9H2O,Macklin, China), gadolinium nitrate hexahydrate(Gd(NO3)3·6H2O, Macklin, China), and lanthanumnitrate hexahydrate (La(NO3)3·6H2O, Macklin, China)were dissolved in 2-methoxyethanol (Damas-beta, China)with the molarity of 0.2 M. Subsequently, citric acidmonohydrate (Damas-beta, China) was added as thechelating agent to expedite the binding process of themetal ions. Finally, 3 M HNO3 acid was added toremove the impurities in the solution. 1 g polyvinylpyrrolidone (PVP, Macklin, China) (Mw 1,300,000)was added to 10 mL dimethyl formamide (DMF,Macklin, China) to obtain a viscous solution. Boththese solutions were mixed and stirred continuously for8 h at room temperature to obtain a homogeneoussolution for the electrospinning process. The obtainedsolution was then fed into a 20 mL plastic syringe, anda high voltage of 15 kV was applied to the stainlesssteel needle. The flow rate of the solution wasmaintained at 0.3 mL·h 1, and the as-spun nanofiberswere collected on an aluminum spread roller of 100 mmin diameter, rotating at a speed of 250 r·min 1. Thedistance between the needle tip and the roller was fixedat 15 cm. The as-collected nanofibers were dried in anoven at 200 for 2 h, followed by calcination at550 for 30 min in air atmosphere.2. 2Material characterizationThe crystal structures of the samples were characterizedby the X-ray diffractometer (Bruker AXS, WI, USA)using Cu Kα radiation (λ 1.5418 Å). The refinedlattice parameters were obtained from the Rietveldrefinement of the X-ray diffraction (XRD) data usingFullprof software. Structural deformation and latticeshifting in the host lattice were determined by theRaman spectroscope (Invia Reflex, Renishaw). Thesurface morphology and the quantitative elementalcontent were characterized by the field emission scanningelectron microscope (FESEM; SU-70, Hitachi, Japan)attached with an energy dispersive X-ray spectroscope(EDS; Oxford INCA, UK). The microstructure of thenanotube was also inspected by the transmissionelectron microscope (TEM; JEM-2100, JEOL, Japan).The elemental composition and chemical bindingstates of the various ions presented in the synthesizedsamples were analyzed by the X-ray photoelectronspectroscope (XPS; Thermo Fisher Scientic ESCALAB250Xi, USA). The optical absorption spectra of all thesamples were recorded on an ultraviolet–visiblespectrophotometer (Lambda 950, Perkin Elmer, USA)in the wavelength range of 200–800 nm, and the Egvalues were obtained from Tauc plot. The rate of therecombination of the photo-generated electron andhole was characterized by the photoluminescence (PL;Edinburgh FS5, Edinburgh Instruments, UK) equippedwith a Xenon lamp at an excitation wavelength of 400 nm.The piezoresponse force microscope (PFM; Bruker,Billerica, MA, USA) was performed to characterize thepiezoelectric properties of the synthesized samples.2. 3Dye degradation measurementsDifferent catalytic experiments were performed toinvestigate the degradation of MB by using thesynthesized samples as the catalysts. The concentrationof the MB solution was maintained at 20 mg·L 1 for allthe experiments, and 45 mg of the calcined nanotubeswere dispersed in 100 mL of MB solution undercontinuous stirring. The solution mixture was stirredcontinuously for 1 h to reach the adsorption–desorptionequilibrium before starting the experiments. Thetemperature was maintained at 20 by adding icebags during the whole reaction to eliminate theinfluence of thermal heating on the experiments. Forthe piezocatalytic (sonocatalytic) tests, the sampleswere exposed to mechanical vibrations by using anultrasonic source supplied by a sonicator (120 W,40 kHz). The whole setup was placed in a darkenvironment to avoid the degradation by light exposure.For the photocatalytic tests, the samples were irradiatedwith an ultraviolet–visible (UV–Vis) light using a300 W Xenon lamp equipped with an air mass (AM)1.5G solar simulator as the source. For thepiezophotocatalytic (sonophotocatalytic) tests, both theabove-mentioned ultrasonic and light sources wereused simultaneously. Then, 4 mL of the solution mixturewas collected after each 15 min and centrifuged at12,000 r·min 1 for 10 min to remove the catalyst powders.The concentration of the resulting MB solution wasthen measured at the maximum absorbance at 664 nmusing a UV–Vis spectrophotometer. For the stabilitytest, the remaining powders after the experiment werecollected by centrifugation, washed with deionized (DI)water several times to remove the residual MB, anddried for the next test cycle. The test was repeated forten times to check the reproducibility.www.springer.com/journal/40145
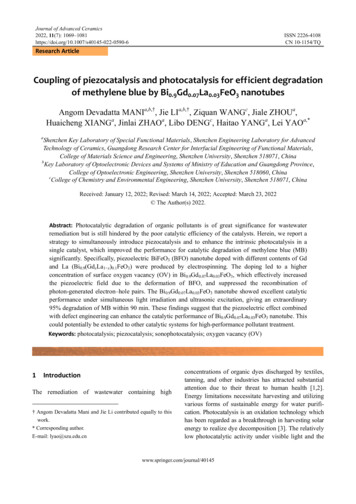
10722. 4J Adv Ceram 2022, 11(7): 1069–1081Photoelectrochemical measurementsAn electrochemical system (CHI760E, CH instruments,China) was used to measure the photocurrent responseduring an on–off state of the light exposure on a threeelectrode system using a 0.5 M Na2SO4 electrolyte. Theworking electrode with an exposure area of 1 cm 1cm was prepared by loading the slurry mixture, whichconsists of the nanotubes and Nafion binder, onto thesurface of Ni foam and followed by drying at 60 for 12 h. A Pt wire was used as the counter electrode,and a standard Ag/AgCl was used as the referenceelectrode. The photocurrent response was recorded bya periodic on-off reversal of light after each 100 s.3Results and discussion3. 1Structural characterizationElectrospinning is a powerful technique to fabricateone-dimensional nanostructures (typically nanofibers).All the electrospun BFO and Bi0.9(GdxLa1 x)0.1FeO3(x 0, 0.3, 0.5, 0.7, and 1.0) exhibit hollow fibrousmorphology, as seen from the FESEM images shownin Fig. S1 in the Electronic Supplementary Material(ESM). Specifically, Bi0.9Gd0.07La0.03FeO3 exhibits ananotube structure with an average diameter of 71 nm(Figs. 1(a)–1(c)). The TEM image shows that thethickness of the nanotube wall is 100 nm (Fig. 1(d)),and the average grain size is 10 nm (Fig. 1(e)). Theinterplanar distances of 0.28 and 0.39 nm correspond tothe (104) and (012) planes of the perovskite phase ofBFO, respectively, and are in good agreement with theselected area electron diffraction (SAED) pattern (theinset in Fig. 1(e)) [35,36]. EDS mapping imagesindicate uniform distributions of Bi, Gd, La, and Fe inthe Bi0.9Gd0.07La0.03FeO3 nanotubes (Fig. S2 in theESM). The formation of the tubular morphology isattributed to the Kirkendall effect (Fig. 1(f)) [37,38].During the Kirkendall oxidation, metal (M) ions diffuseoutwards whereas oxygen (O) ions diffuse inwards,forming a continuous layer of metal–oxygen (M–O)bonds near the interface. This layer remains anoxygen-deficient state because of the slower diffusionof O compared to M. This unbalanced diffusion resultsin the diffusion of vacancies, which leads to theformation of Kirkendall holes (H) near the interface inthe side with the higher diffusion rate [37,39]. Thetubular morphology, small grain size, and small diameterof the doped BFO nanotubes give rise to a high surfacearea potentially available for catalytic activity.Figure 2(a) shows the XRD patterns of BFO andBi0.9(GdxLa1 x)0.1FeO3 (x 0, 0.3, 0.5, 0.7, and 1.0). Allpeaks can be indexed to the rhombohedrally-distortedFig. 1 Morphologies of Bi0.9Gd0.07La0.03FeO3 nanotubes: (a–c) FESEM images, (d) TEM image, (e) HRTEM image with theSAED pattern inset, and (f) schematic illustration of the formation mechanism of the tubular nanostructure.www.springer.com/journal/40145
J Adv Ceram 2022, 11(7): 1069–10811073Fig. 2 Crystal structures and chemical structures of BFO and Bi0.9(GdxLa1 x)0.1FeO3 (x 0, 0.3, 0.5, 0.7, and 1.0): (a) XRDpatterns, (b) magnified XRD patterns in the range of 31 –33 , (c) Raman spectra, (d) O 1s XPS spectra of Bi0.9Gd0.07La0.03FeO3,(e) O 1s XPS spectra of all the samples, and (f) relationship between the relative peak intensity ratio (RIR) and the content of Gd.perovskite BFO phase with R3c space group withoutany impurities. This indicates the good dispersion ofGd3 and La3 in the BFO lattice [27,28]. Increasingthe Gd3 content leads to gradual broadening in the(104) and (110) peaks which eventually merge into asingle peak at a lower diffraction angle (Fig. 2(b)). Thecrystallite size and lattice constant decrease with theincrease of Gd3 content (Table S1 in the ESM). Thisreveals the evolution of lattice deformation in thecrystal structure due to the A-site substitution [40,41].Compared to the La-rich samples (x 0.5), the Gd-richsamples (x 0.5) have smaller crystallite sizes andlarger deformation in the crystal lattice. This isattributed to the larger difference in the ionic radii ofGd3 (0.94 Å) and Bi3 (1.03 Å) compared with thoseof La3 (1.06 Å) and Bi3 (1.03 Å) at the A-site [36].The Raman spectroscopy was used to investigatelattice disorder and the associated defect formationupon introducing dopants. Eleven fundamental modesare observed in the Raman spectra of BFO andBi0.9(GdxLa1 x)0.1FeO3 (x 0, 0.3, 0.5, 0.7, and 1.0) inthe range of 100–800 cm 1 (Fig. S3 in the ESM). Allthese vibrational phonon modes suggest a rhombohedralstructure and are in agreement with the reported values[42,43]. Peaks at 137, 169, 217, and 471 cm 1 are theA1 modes, and peaks at 261, 276, 306, 346, 369, 526,and 597 cm 1 are the E modes of BFO. A1 and E modesat wavenumbers smaller than 400 cm 1 correspond tothe Bi–O bond, whereas peaks at wavenumbers above400 cm 1 correspond to the Fe–O bond [42]. Increasingthe Gd ratio from 0 to 0.7 leads to the peaks of the A1-1and A1-2 modes gradually broadening and shiftingtowards higher wavenumbers (Fig. 2(c)). This suggeststhat the substitution of Gd3 and La3 at the Bi-sitechanges the vibration motion in the FeO6 octahedra.The Raman shift and peak broadening can be attributedto the reduction of particle size and formation of OVsupon doping [44].The surface compositions and valence states werefurther analyzed using XPS. Figure S4 in the ESMshows the XPS spectra of the Bi 4f, Fe 2p, Gd 4d, andLa 3d regions for all the samples. The deconvolution ofthe Bi (4f7/2 and 4f5/2), Fe (2p3/2 and 2p1/2), Gd (4d5/2and 4d3/2), and La (3d5/2 and 3d3/2) peaks suggests 3oxidation states for these four elements. The O 1sspectrum of Bi0.9Gd0.07La0.03FeO3 can be resolved intothree peaks at 529.4, 531.0, and 532.8 eV, which areattributed to the O–M bond, dangling bond-O, andwww.springer.com/journal/40145
1074J Adv Ceram 2022, 11(7): 1069–1081absorbed-O, respectively (Fig. 2(d)) [45]. The emergenceof dangling bond-O and adsorbed-O has been suggestedto be related to the formation of OVs in the host latticeof perovskite oxides [41]. The concentration of OVs canbe approximately estimated by RIR given by Eq. (1):RIR IO– MI DL I ADS(1)where IO–M is the relative peak intensity of the O–Mbond, IDL is the relative peak intensity of the danglingbond, and IADS is the relative peak intensity of adsorbedoxygen [46]. A smaller RIR value indicates a higherconcentration of OVs [47]. The RIR values of thepristine BFO and Bi0.9(GdxLa1 x)0.1FeO3 (x 0, 0.3, 0.5,0.7, and 1.0) are calculated according to the peakintensities of the samples in Fig. 2(e) and are displayedin Fig. 2(f). The RIR decreases with the increase of Gdcontent, reaching a minimum value at around x 0.7.This indicates that OVs are introduced into the BFOcrystal lattice due to the Gd and La doping, and theBi0.9Gd0.07La0.03FeO3 nanostructure has the mostabundant OVs.3. 2Optical and piezoelectric propertiesFigure 3(a) shows the room-temperature UV–Visabsorption spectra of BFO and Bi0.9(GdxLa1 x)0.1FeO3(x 0, 0.3, 0.5, 0.7, and 1.0) nanotubes. Upon doping,the absorption spectra shift from the UV region to thevisible region. The optical absorption coefficient (αhv)follows the Tauc relationship described by Eq. (2):(αhv)n A(hv Eg)(2)where A , α , h , and v are a constant, absorptioncoefficient, Planck’s constant, and frequency ofincident photons, respectively. The corresponding Egcan be estimated from the Kubelka–Munk (K–M)theory by extrapolating the linear portion of the (αhv)nvs. hv plot to the hv axis (in which the value for n was2 for calculating indirect bandgap) [35]. The goodlinear fit above the band gap indicates the direct bandgap behavior of the nanotubes (Fig. S5 in the ESM)[48]. The calculated Eg values are 2.9, 2.7, 2.5, 2.3, 2.1,and 2.4 eV for BFO and Bi0.9(GdxLa1 x)0.1FeO3 (x 0,0.3, 0.5, 0.7, and 1.0), respectively, which are shown inFig. 3(b). The trend of variation in Eg coincides withthat in the RIR values of the doped BFO nanotubes,revealing a strong relationship between the decrease ofEg and the introduction of OVs. In the pristine BFO, Egis the region between the O 2p and Fe 3d hybrid states.Introducing OVs creates new sub-band defect states bylowering the adjacent 3d levels, which decreases theoverall Eg [49]. The Bi0.9Gd0.07La0.03FeO3 nanotubeshows the largest shift and smallest Eg due to thehighest concentration of OVs, which indicates that itcan absorb and utilize more visible light from the solarspectrum than the other samples.To elucidate the effect of Gd and La doping and theintroduction of OVs on the charge carrier excitation/separation ability of the nanotubes, PL spectra of BFOand Bi0.9(GdxLa1 x)0.1FeO3 (x 0, 0.3, 0.5, 0.7, and 1.0)were recorded using an excitation wavelength of400 nm (Fig. 3(c)). All the PL spectra show two visiblelight emissions, i.e., blue emission (BE) at 491.0 nm(2.52 eV) and yellow emission (YE) at 580.8 nm(2.13 eV). The BE corresponds to the near bandemission (NBE) which is characteristic of the radiativetransition of photo-generated charge carriers [48]. Astronger PL peak usually implies a higher chance ofrecombination between electrons and holes. When theGd doping ratio increases from 0 to 0.7, the peakintensity of the NBE peak gradually decreases, indicatingthat the Bi0.9Gd0.07La0.03FeO3 nanotube has the lowestradiative recombination rate [41].The time-dependent photocurrents of BFO andBi0.9(GdxLa1 x)0.1FeO3 (x 0, 0.3, 0.5, 0.7, and 1.0)nanotubes were measured under solar irradiation(on–off interval of 100 s) to investigate the chargetrapping and separation efficiency of the photo-generatedcharge carriers. A higher photocurrent response impliesa higher charge carrier density and efficient chargecarrier separation, which is beneficial to photocatalyticperformance. As shown in Fig. 3(d), the doped BFOsamples exhibit higher photocurrents than that of thepristine one, revealing a longer lifespan and moreefficient separation of photo-generated charge carriers[41]. The current appeared and disappeared withreproducible curves in the presence of BFO and dopedBFO samples, which indicates the separation andmigration of electric charges in the flowing system[50]. This is consistent with the PL spectra and thephotocatalytic performance results (discussed below).The Bi0.9Gd0.07La0.03FeO3 nanotube exhibits the highestphotocurrent intensity which indicates the highestphotoconversion ability and charge separation, andthus it is expected to exhibit the highest photocatalyticactivity. It is known that the chemisorption of gasmolecules such as O2 and H2O occurs at the surfaceand depletes the free electrons in the nanotube, i.e.,www.springer.com/journal/40145
J Adv Ceram 2022, 11(7): 1069–10811075Fig. 3 Effect of introduced OVs in BFO on the band structure and optical properties: (a) UV–Vis absorbance spectra in thewavelength range of 200–800 nm, (b) relationship between Eg and Gd doping ratio, (c) PL spectra with the magnified spectrainset, (d) transient photocurrent response with light on/off cycles of 100 s, and (e) schematic illustration of the charge trappingmode of OVs in BFO and co-doped BFO nanotubes.O2 e O2 and 2H2O O2 4e 4OH [51].OVs at the surface act as adsorption sites to donate freeelectrons, resulting in three charge states, i.e., doublyionized oxygen vacancies (VO ) (no electron captured),singly ionized oxygen vacancies (VO ) (one electroncaptured), and neutral oxygen vacancies (VOx ) (twoelectrons captured) [52,53]. When the concentration ofOVs is low, free electrons in the nanotubes arethoroughly depleted, and a wide depletion region andupward band bending form near the surface (as shownin the left panel of Fig. 3(e)). Doping the BFO nanotubewith La and Gd increases the concentration of OVs,which decreases the thickness of the depletion layer atthe surface (as shown in the right panel of Fig. 3(e)).The Fermi energy level would relocate to a higherenergy level, preferably above the energy level of VO and VO but below the energy level of VOx [52].The narrow depletion layer at the surface tuned byOVs enables more holes to be captured by surfaceadsorbed oxygen ions, and fewer holes are left in thebulk to undergo radiative recombination with electrons[52]. The photo-generated electrons and holes segregatewww.springer.com/journal/40145
1076J Adv Ceram 2022, 11(7): 1069–1081in opposite directions across the depletion region nearthe surface, thereby reducing the recombination throughexcitonic processes. This potentially permits an enhancedphotocatalytic efficiency because of the longer lifetimeof the photo-generated charge carriers, which are thenmore likely to become active species such as OH· forsubsequent MB degradation (schematically shown inFig. 4, in which DB stands for dangling bond and Efstands for the Fermi energy).Piezoelectric properties of the samples were testedusing the PFM. In the test, a conductive cantilever tipworks in contact mode to provide an external bias onthe sample, which is placed on a conductive substrate.Piezoelectric surface vibrations are induced in the sample.These vibrations are sensed through the cantileverdeflection and the piezoresponse is measured [54–56].Figures 5(a) and 5(e) show the phase contrast maps ofthe BFO and Bi0.9Gd0.07La0.03FeO3 nanotubes, and thecorresponding amplitude maps are shown in Figs. 5(c)and 5(g). Regions with different phase contrasts,particularly the peripheries, represent domains without-of-plane polarization alignments [57]. The amplitudeimages in Figs. 5(c) and 5(g) show that the ferroelectricdomains are distributed randomly in different regions.The ferroelectric behavior of the pristine BFO andBi0.9Gd0.07La0.03FeO3 nanotubes is confirmed by thepiezoresponse phase–voltage hysteresis loops shown inFigs. 5(b) and 5(f) and the amplitude–voltage butterflyloops shown in Figs. 5(d) and 5(h). The phase loopsshow the polarization reversal of ferroelectricity whenthe tip bias is reversed. The amplitude–voltage loopsshow the characteristics of a butterfly loop, which is astrong indication of ferroelectricity rather thanelectrostatic interaction [56]. The distorted hysteresisof the butterfly loops may be attributed to severalreasons including less tip bias voltage, inefficientelectrical contact between the cantilever tip and sample,and the presence of a substantial amount of nonswitchable components [58]. At 8 V, the amplitudefor the Bi0.9Gd0.07La0.03FeO3 nanotube reaches 100 pmwhile that for the pristine BFO reaches 55 pm, whichsuggests the enhanced ferroelectric behavior of theBi0.9Gd0.07La0.03FeO3 compared with the pristine BFOnanotube. The enhancement in ferroelectric propertiesis attributed to the induced lattice deformation due toA-site engineering by Gd and La dopants. Theferroelectric Bi3 -sites (1.03 Å) are replaced by Gd3 (0.94 Å) and La3 ions (1.06 Å) with different sizes.Hence, a gradual lattice shifting is observed, ultimatelychanging the bond angles and bond length between thevarious ions. The off-centro symmetry of the BFOlattice is distorted. With the increase of Gd concentration,the amount of distortion of the symmetry increases,and hence the ferroelectric behavior increases [59].The polarized ferroelectric domains could enhance thecharge separation efficiency.Fig. 4 Schematic illustration of the crystal structure and possible charge transfer mechanism: (a) BFO nanotubes under onlylight irradiation and (b) (Gd,La) co-doped BFO nanotubes under both light and ultrasound stimuli.www.springer.com/journal/40145
J Adv Ceram 2022, 11(7): 1069–10811077Fig. 5 PFM characterization of BFO and Bi0.9Gd0.07La0.03FeO3 nanotubes: (a, e) phase contrast maps; (b, f) phase–voltagehysteresis loops; (c, g) amplitude maps; and (d, h) amplitude–voltage butterfly loops.3. 3 Performance for the catalytic degradation of MBThe degradation of MB under sonication excitation(sonocatalysis), solar irradiation (photocatalysis), andsimultaneous sonication and solar irradiation (sonophotocatalysis) by BFO and Bi0.9(GdxLa1 x)0.1FeO3 (x 0, 0.3, 0.5, 0.7, and 1.0) nanotubes was investigated.The catalytic degradation efficiency can be monitoredthrough the UV–Vis absorption spectrum of MBsolution after irradiation and/or sonication excitationfor different times in the presence of BFO or doped-BFOnanotubes (Figs. 6(a)–6(c) and Fig. S6 in the ESM).With the increase of exposure time, the intensity of theabsorption peak at 664 nm decreases, indicating theremoval of MB dye from the solution. Figures 6(d)–6(f)show the C / C 0 ratio (where C and C 0 are theconcentrations of MB at exposure time t and 0,respectively) of all the samples as a function of theexposure time. The MB degradation by the pristineBFO nanotube is 7% under only vibration (i.e., underdark conditions). The vibration is introduced throughthe ultrasonic cavitation effect in the liquid solution atroom temperature, which has been widely reported asan effective method to exert stress on nanomaterials[26]. The low MB sonocatalysis degradation of pristineBFO indicates that the polarization charges generatedby the built-in electric field in
The piezoresponse force microscope (PFM; Bruker, Billerica, MA, USA) was performed to characterize the piezoelectric properties of the synthesized samples. 2. 3 Dye degradation measurements Different catalytic experiments were performed to investigate the degradation of MB by using the synthesized samples as the catalysts. The concentration