Transcription
AppendixPRINCIPLES OF EMERGY ANALYSIS FOR PUBLIC POLICY1Howard T. OdumEnvironmental Engineerin SciencesUniversity of Flori aGainesville, FLdThis paper explains EMERGY concepts for maximhhg public wealth, and gives explanationsfor why the principles are valid. The viewpoint is that the world economy, the nations, and statesincrease their real wealth and prevail according to these principles.A new quantity, the EMERGY, spelled with an " M measures real wealth. Here we are using"wealth to mean usable products and services however produced. Maximizing the EMERGY is anew tool for those making public policy choices among alternativeprograms, resources, andappropriations. Choosing actions and patterns with the greatest EMERGY contribution to the publiceconomy maximizes public wealth. Eh4ERGY analysis is not advocated as a tool for estimatingmarket values. This paper explains EMERGY evaluation and its use to improve public policies.Human Choices Consistent with Mudmum Sustainable WealthMany if not most people of the world assume that the economy is not s u b j j to scientificprediction but is a result of human free choices by businesses and individuals motivated by theirindividual needs. A different point of view is that the human economy, like many other selforganizing systems of nature,operates according to principles involving energy, materials,idonnation, hierarchical organization, and consumer uses that reinforce production.If those human choices that lead to successful, continuing wealth fit principles of larger xaleself organization, then the economy ultimately uses human choices to follow the scientific laws. Thehuman free choices are the means for finding the maximum public wealth by trial and error. Choicesthat do not contribute to the public wealth are not reinforced in the larger scale. Eventually patternsthat do develop more wealth take over and are sustained.However, if the designs of society that maximbe wealth can be determined from scientificprinciples, then better choices are possible with less trial and error. EMERGY evaluations anddesigns based on unchanging physical measures may provide an efficient and predictable means forachieving public wealth and sustainable economic patterns.Scientific Basis for Ecoz omicVitalityMore in the education of scientists and engineers than in that of purnalists and businesspeople is the recognition that resources and products are wealth. An economy is vital when it hasabundant goods and resources and uses them to reinforce productivity. Energy, minerals, andChapter 1. from "Eh4ERGYAND POLICY,"J. Wiley
NOTE TO READERSeptember 1, 2006This document was included as an Annex to Emergy Analysis of Shrimp Mariculture inEcuador, printed in 1991.THIS IS A SEARCHABLE PDF DOCUMENTThis document has been created in Adobe Acrobat Professional 6.0 by scanning the bestavailable original paper copy. The page images may be cropped and blank numbered pagesdeleted in order to reduce file size, however the full text and graphics of the original arepreserved. The resulting page images have been processed to recognize characters(optical character recognition, OCR) so that most of the text of the original, as well as somewords and numbers on tables and graphics are searchable and selectable. To print thedocument with the margins as originally published, do not use page scaling in the printerset up.This document is posted to the web site of theCoastal Resources Center,Graduate School of Oceanography,University of Rhode Island220 South Ferry RoadNarragansett, Rhode Island, USA 02882Telephone: 401.874.6224http://www.crc.uri.eduCitation:Odum, H.T. (1991). Principles of EMERGY Analysis for Public Policy.Gainesville, FL: University of Florida. Reprinted in Odum, H.T., Arding, J. (1991).Emergy Analysis of Shrimp Mariculture in Ecuador. Narragansett, RI: Coastal Resources Center,University of Rhode Island.
EMERGY ANALYSIS OF SHRIMP MARICULTUREIN ECUADORHoward T. Odum and JanE. ArdingEnvironmental Engineering SciencesandCenter for WetlandsUniversity of FloridaGainesville, Fl, 32611Repared forCoastal Resources CenterUniversity of Rhode IslandNarragansett, RI.March,
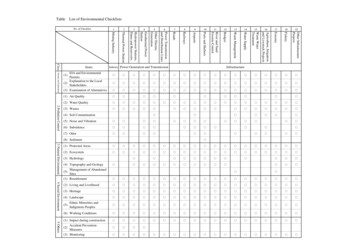
information are the real wealth. It takes energy to concentrate the minerals needed by an economy. Ittakes energy to maintain and process information. When resources are abundant and cheap, therecan be abundant wealth and a high standard of living. If resources and basic products are importedcheaply, abundant wealth is imported.The Irrelevance of Market Prices to WealthAlthough the market value of products and services is important to individuals and businessbudgets, it is largely imlwant as a measure of wealth. A tank of gasoline drives a car the samedistance regardless of what people are willing to pay for it. A day of summer sunlight generates somuch corn growth regardless of whether a human thinks it's free or not A nugget of copperconcentrated by geological work will make so much electric wire regardless of its price.When resources are abundant, wealth is great, standard of living is high, and money buysmore. But when l sourcesare abundant, market values and prices are small. Prices are not ameasure of resource contribution to wealth.When resources are scarce, prices are high not only because shortages affect demand, butbecause more human services are required tu mine, transport, or concentrate scarce resouices. By thetime the resources have been collected and used, the net contributions of the resource have beendiminished by the extra effork tu process the resources.Figure 1shows the economic interface between a typical environmental process that generatesthe resources and the human economy. Money circulates through the people involved in processingthe resources, but no money goes to the works of the environment. The money paid is not a measureof the wealth that comes from nature's work on the left In other words, prices are not only not ameasure of the contribution of resoums and commodities to an economy, they are inverse, beingfor evaluatinglowest when contributions are greatest. Another kind of measure is redcontributions to public wealth.Figure L Environmental production process and an interfacing economic user which is also ahuman-paid economic production process. Notice absence of reinforcement from w r toenvironment producer.
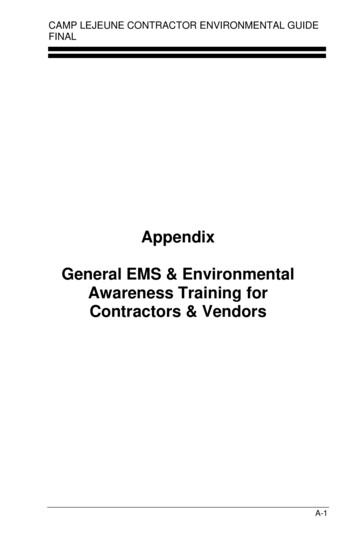
EMERGY DefinitionEMERGY of a product is the work which went into making it expressed in units of one type ofenergy. The unit of EMERGY measure is the emjoule.For example, a cubic meter of rain water over land has a solar EMERGY content of 7.5 El0solar emjoules. This means that 7.5 El0 solar joules directly and indirectly were involved in bringingthis much rainwater to the land.EMERGY and Sustainable UsesBecause EMERGY measures what went into a product, it is also a measure of what thatproduct should contribute to the economy if its use is to justify its production.In the self organizational process of economies and of environmental systems, products thatrequire more work in their rnanufacture either contribute more to the system commensurate withwhat was required to make them, or the production is discontinued.Thus,EMERGY is not only a measure of what went into a product, it is a measure of theuseful contributions which can be expected from that product as an economy self organizes formaximum production.EMERGY goes with a product as it is processed and transported. It is like a memory, since itrecords what went into that product. einforcementof Production Required for Sustainable UsesWhereas individualistic humancentered concepts of economic benefit view production asdirected to benefit the human consumer, real self organizing systems develop with a differentconsequence. All uses (by consumers) reinforce production processes or are displaced by thosewhich do. Economies which allow allocation of resources to wasteful luxuries are not sustainable,being displaced by those with better reinforcement of their productive basis. This viewpointcontrasts with the economic view that any expenditure of money is good whether it be forunnecessary products and services or not.Consumers that use products without contributing to production processes elsewhere in thesystem divert resources, reducing the wealth of the system below its potential. For example,consumers that use larger cars than necessary for their maximum service to the economy reduce thepotentials for economic reinforcement inherent in the products they consume.Consumers that use products of nature's production such as fisheries without contributingsome reinforcement to the natural production process cause that production system to be displacedby alternative systems which are not so exploited. Because marine fisheries have rarely reinforcedtheir stock production processes, many have been displaced. In contrast, most sustainable systems ofagriculture apply extensive reinforcement to their soil production processes by applying variousfertilizers and other soil improvements. Figure 2 compares sustainable systems that reinforce withan unsustainable design that does not reinforce.
4ProducerA- \ConsumerFigure 2. Comparison of consumem which reinforce production with those that don't. (a)Environmental production and consumption with consumer outputs of materials and servicesthat donft reinforce; (b) economic production and consumption with consumer outputreinforcing production.Some of the production proasses are those of environmental work such as that of forests,farms, fisheries,and mineral forming pmesses (geological processes). Other production processesare those within the human economic system of industries Both kinds of production processesrequire mMorammt with services and other inputs from the consumers to be sustainable. Forexample, means for reinforcing fisheries production include release of hatchery stocks, fertilizingfood chains, selective m v a l of competing species, and chumming with extra food suplernents.The circulation of money helps insure that human producers meive reinforcement for theircontributions, but the production processes of nature cannot accept money. As Figure 1shows,money paid to humans to process environmental products with market pricing does not lead toreinforcement. Maximihg human incomes does not include any reinforcement to theenvironmental systems necessary for sustainable production
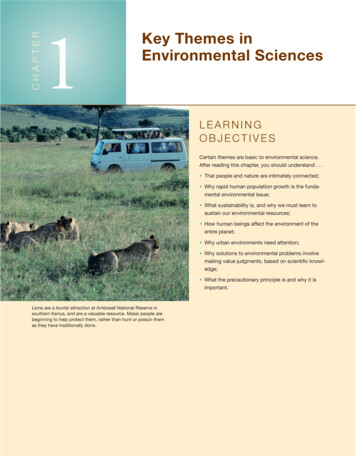
Public Policy to Maximize EMERGY Input and System-reinforcingUsesFrom the preceding explanations of EMERGY we conclude that greatest public wealth can beachieved by policies that bring in the most EMERGY and allocate it to uses that reinforceproduction, including environmental production processes on which the human production systemsdepend. For example, policy to maximize agricultural production of wealth includes reinforcingnatural soil maintenance processes, even if profits are less.Maximizing EMERGY Is the Old '?Maximum Power Principle"The principle that greatest wealth is achieved by maximizing input and reinforcement may berecognized as a statement of an old concept: "the maximum power principle" sometimes attributedto L o t h (1924).The concept has its roots in writings of theoretical scientists and economists in thelast century (Martinez-Alier, 1987).EMERGY-based Evaluation of Contribution to GNPThe total annual EMERGY use by a nation measures its annual wealth. Many people are usedto thinking of national economic vitality in terms of money circulating in that country measured bythe gross economic product. However, in different countries money buys different amounts of realwealth even when the currenciesare compared on a current international exchange basis. Theamount of real wealth that circulating money buys is indicated by the EMERGY/ ratio. Table 1hasthe gross economic products and solar EMERGY budgets of several nations. The last column is thesolar EMERGY/ ratio for each'country.Rural countries have higher EMERGY/ ratios because more of the wealth goes directly fromthe environment to human consumer without money being paid. For example, a family in remoterain forest gets most of its food, clothing, shelter, recreation, etc., directly from nature withoutmoney being involved.If some change in global environmental pmcesses reduced the EMERGY budget of a countryby lo%, the real wealth would be reduced by 10%.The same money circulation would buy less. Thisis inflation.Since public policy people already have values of gross economic product in their minds, it issometimes useful to express EMERGY in dollars of gross economic product. If one is given a solarEMERGY value, the equivalent gross economic product is found by dividing the solar EMERGY bythe solar EMERGY/ ratio (Table I).The dollars of gross economic product estimated from EMERGY evaluation of a product isusually much larger than the money first paid for the product (Figure 1). Sometimes we call theEMERGY-based GNP evaluation "macroeconomicdollars".Using Diagrams to Visualize Sustainable SystemsFor many people the principles already stated for maximizing wealth can be understoodbetter when the self organizing systems of environment in the economy are represented withnetwork diagrams. These are a pictorial way of representing production, consumption, andpathways of input and reinforcement. Figure 3 shows a systems network in which all uses reinforceother parts of the system with materials or services.
\Table 1.National Activity and EMERGY/ NationU, ENERGY used /yearE20 sej/yearGNPE9 /Y earEMERGY/ oviet UnionNew ZealandUSAWest GermanyNetherlandsSpainSwitzerlandThe specla1set of symbols and conventions for drawing a web (Figure 4) has been used fortwo decades to represent systems networks, gain overview perspectives, and explain concepts. Thenetworks of symbols connect flows of materials, goods, service, and information. These diagramsare an "energy systems language"because all pathways have some flow of energy. Even flows ofinfonnation have the tiny energy content of the paper, computer disks, electrical currents, soundwave, light waves, etc., that carry messages. Flows of minerals or other materials that are moreconcentrated than in the surroundingscontain the small energy content inherent in beingconcentrated. As we explain below, the importance of any flow is measured by its EMERGY content,whether the energy flow is large or small.The second law of thennodynamics requires that any process have some of its availableenergy be dispersed in degraded form leaving the system unable to do more work. This law alsorequires that any stored material, energy, goods, or information, depreciate, losing its concentrations(because its energy is dispersing). The flows of used energy leaving the system are shown in thediagrams by pathways that go downward (into the "heat sink").These pathways represent onlydegraded heat energy. Any dispersing materials, commodities, services, or energy still concentratedenough to do work are shown leaving the system by other pathways.Money is exchangd as a counter current to the flow of commodities and services wherehumans are involved. Money is only paid to people and thus does not flow over environmentalpathways. A s already said, money flows are not proportional to the input of EMERGY wealth to thehuman economy.Note that the designation of producer and consumer is relative. Things on the left areproducers passing products to consumers on the right. A consumer in the center of the diagram usesproducts incoming from the left, but is also a producer passing its products to the unit next on theright.
FromsmallerunitsIEnvironmentIEconomyIShared InformationFigure 3. Network diagram of a pined system of environment and human economy. Economicsectors have circulation of money (dashed lines).
Energy circuit. A pathway whose flow is pnjportional to thequantity in the storage or source upstream.Souxe. Outside source of energy delivering foxes according to aprogram controlled from outside; a forcing function.Tank. A compartment of energy storage within the system storing aquantity as the balance of inflows and outflows; a state variable.Heat sink. Dispe sionof potential energy into heat that accompaniesall real transformation processes and storages; loss of potentialenergy from M e r use by the system.Interaction. Interactive intersection of two pathways coupled toproduce an outflow in proportion to a function of both; controlaction of one flow on another; limiting factor action; work gate.Consumer. Unit that transforms energy quality, stores it, and feeds itback autocatalytically to improve intlow.Switching action. A symbol that indicates one or more switchingactions.Producer. Unit that collects and transforms lowquality energyunder control interactions of highquality flows.Self-limiting energy receiver. A unit that has a self-limiting outputwhen input drives are high because there is a limiting constantquality of material reacting on a cifiular pathway within.Box. Miscellaneous symbol to use for whatever unit or function islabeled.Constant-gain amplifier. A unit that delivexs an output inproportion to the input I but changed by a constant factor as long asthe energy source S is sufficient. -8*Transaction. A unit that indicates a sale of goods or services (solidline) in exchange for payment of money d e d h e . Price isshown as an external source.Figure 4. Symbols of the energy Language used to represent systems (Odum, 1971,1983)
Energy Hierarchy PrincipleDiagramming the economies of environment and humanity in network form as in Figure 5makes it easy to explain the important concept of energy hierarchy, which is necessary tounderstand how different kinds of flows have different EMERGY. Self organizing systems develop ahierarchical division of labor according to size that increases system reinforcement of production.All the processes of nature and of humans are hierarchical. Many small units converge theirproduction flows to form a few units of larger size and territory. These larger units converge flowsto fewer units of even larger size and temtory. For example, grass is converged into sheep and sheepto the shepherd and shepherd's products to the village and the village products to the town.As shown in Figure 5, we arrange the hierarchy with converging from left to right (byconvention). Items on the right are fewer, have larger size, and take longer to grow, depreciate, orturn over (are replaced). Each use is an energy transformation, changing the form of energy fromoneunit to the next.As already explained, consumers of sustainable systems have pathways reinforcing otherunits of production. In Figures 3 and 5 these reinforcement pathways are the services and materialsthat consumers on the right pass to the producers they use on the left. Because they go back to theleft, we call them feedbacks. Many of these feedback pathways are controls with the application ofuseful information. Even these information flows have small amounts of accompanying energy flow,since it is not possible to store or transmit information without a small energy flow to carry theinformation.Because it takes more of an item on the left to make an item on the right and because a smallamount of items on the right control larger amounts on the left, we can describe the right side of theenergy hierarchy as of higher quality. In sections that follow we will measure that quality.As Figure 5c shows, the energy flows on the pathways get less as one goes from left to right inthe energy hierarchy. This is because of the second law which requires that some potential energy bedegraded into used energy state (no longer reusable) at each use and transformation.Thus, it takes more energy of one type on the left to support the transformations that make asmaller amount of higher quality energy to the right Thus, it is incorrect to use energy as a measureof work or value, except where one is comparing energy flows of the same type. A Calorie ofsunlight does not contribute as much to the economy as a Calorie of coal. A Calorie of coal does notcontribute as much to the economy as a Calorie of human effort.Energy Flow Decrease Up the HierarchyThe definition often used in elementary physics and engineering courses that energy is theability to do work is incorrect Degraded energy can't do any work The work that potential energycan do depends on its position in the energy hierarchy (its position in the left-right hierarchyillustrated by Figures 3 and 5).
.Solar--.--Emergy flow:6E9Aggregated:"Iar 6E9 solar ehjoules psr timeEmergy , --- -- - -- -, - - - - i - - - -, --- --, - -- -, ;---:---- -'Transformation StepsFigure 5. Energetics of a food web. (a) Energy flows on the pathways (feedback control pathways omitted);(b) the energy transformed by aggregating the web; (c) graph of energy flows by position in hierarchy; (dlsolar transfonnityat various positions in heirarchy.98
TransformitiesBy examining the energy transformations in networks that have been proven to be sustainableover long periods of self organization (in nature or in the economy), we can determine the energy ofone form required to generate energy of another type under sustainable conditions. We introduce anew term, the "transformity"defined as the energy of one type required per unit of energy ofanother. For example, if 4 coal Calories are required to generate 1electrical Calorie, then the coaltransformity of electricity is 4 coal emcalories per Calorie. If one uses Joules instead of Calories asthe unit of energy, then the same statement using Joules is: the coal trawformity of electricity is 4coal emjoules per Joule.In order to make calculationseasier, we have been expressing all our transformities inEMERGY units of one type, solar equivalents, as solar emjoules per Joule. Table 2 has somerepresentative solar transformities for typical commodities and services.Consider any product whose energy is known. Its solar EMERGY was already defined as thesolar energy required to generate that product. Thus, another way to calculate a solar transformity isto divide the product's solar EMERGY by its energy. As stated before, the solar transformity unitsare solar empules per joule.Tables of solar transformities make calculations of EMERGY easy. One has only to multiplythe amount of a product by its solar transformity. If the product data are in energy units (Joules),multiply by a transformity in emjoules per Joule. If the data are in mass units (grams),multiply bythe transformity expressed in emjoules per gram.Transformity as a Measure of Unit WealthNotice in Figure 5 that the solar transfonnities rise as one goes from left to right in the systemhierarchy. The larger the transfonnity, the more resources were required to make a unit. The furtherto the right, the higher the quality and the larger the control action if it is fed back to reinforceproduction.Observed and Theoretical Lowest TransformitiesIf one evaluates the transfonnity of a newly initiated process, which has not been runninglong enough to develop its maximum efficiencies for full sustainable production, then a highertransformity (lower efficiency)may be found than later after the system is operating at highestoutput possible. For example, the transfonnity of steam engine work calculated from steam enginesin 1910 was higher than for the better engines that had been developed by 1940.There is a thermodynamic lower limit for transformities reflecting the inherent differences inquality concentration. For example, to convert dilute solar energy falling on the earth into aconcentrated fuel requires that much of the energy be dispersed as part of the concentrating process.If the green plants after a billion years of evolution have achieved the maximum possible sustainableoutput, then the transformity we obtain from evaluating biomass conversions from solar energy willnot be exceeded by new technology.Each EMERGY analysis generates transformities. As more and more analyses are done, andwe obtain many independent values for the same kinds of products, it will become clear which arethe consistent lower values. Then we can judge a process to be inefficient if the calculatedtransformity is much higher than that found in other analyses.
Table 2 Typical Solar Transformities (solar emjoules per joule)ItemSunlightWind kinetic energyUnconsolidated organic matterGeopotential energy in dispersed rainChemical energy in dispersed rainGeopotential energy in riversChemical energy in rivenMechanical energy in waves and tidesConsolidated fuelsFood, greens, grains, staplesProtein foodsHuman serviceslnfomationTransformity Matching in ReinforcementA product reinforces some other part of its system by interacting as a multiplier. For example,fuel interacts with a tractor to deliver farming work; phosphates interact with green plants to formcrop products; computer programs interact with computers to generate information services. In eachcase something of higher W t y with higher transfonnity reinforces its larger system by interactingwith a larger quantity of lower transformity to generate new products. The principle here is thatmore wealth is generated by production processes that join a smaller quantity of high transformitywith a larger quantity of lower transfonnity.Experience shows that items with very large difference in transfonnity cannot interact withmaximum effect directly, but need intermediate processes. For example, human bodies cannot usesunlight as an energy source directly; highly educated humans axe not well used gathering sticksfrom the woods; high tech ships axe not well used harvesting microscopic plankton; electricity is toovaluable for general heating.The transfonnities of products and by-products axe useful guidelines for developing newsystems and assigning resources.Equivalence of ResourcesBecause EMERGY wduation traces what was required for a product back to a common formof energy, it is a way of showing how the requirements for different products compaxe. As wediscussed already, self organization finds uses for products that reinforce some part of the systemcommensurate with what was required in the products manufacture. After appropriatereorganization, products with similar solar EMERGY requirements can be substituted withoutchanging the productivity of a system. The same origrnal amount of resource is going into the sameuse and reinforcement.
Thus, EMERGY evaluation of a product can indicate in advance what uses and substitutionsare appropriate to continued, sustainable wealth of the economy.Evaluating Human ServicesThe average EMERGY/ ratio for a nation (Table 1) can be used to evaluate the typicalservices. Data on costs in are multiplied by the EMERGY / ratio to estimate the EMERGYcontribution from the paid services. This method omits the many unpaid services. It probably doesnot appropriately represent information services. For example, it does not evaluate mothers raisingchildren.Individual human services have a very wide range of transformities from that of anuneducated youngster to national leaders who have become symbols in the whole population. Someefforts have been made to evaluate EMERGY per person for categories of education and occupation.Procedure for Making an EMERGY Evaluation TableThe EMERGY flows of a country, city, process, storage, or whatever may be evaluated by thefollowing procedure for making an EMERGY evaluation table. See example in Table 3. It may beconvenient to use a computer spread sheet.1. Assemble people knowledgeable about a system to be analyzed. Together diagram thesystem, thus identifying the main inputs, system p a . ,processes, and products yielded.2. Make an EMERGY analysis table with one line in the table for each input or product to beevaluated. Number the lines, using the same numbers for the footnotes that give thesources of data, references, calculations, or other details.3. In the first column of data put raw data for each line in Joules, grams,or dollars.4. Put the appropriate solar transformity in the next column.5. In the third column multiply data from column 1by the solar transformity from column 2,thus obtaining solar EMERGY values6. In the fourth column divide the solar EMERGY values by the solar EMERGY / ratio for aparticular economy for a particular year in order to express EMERGY in equivalents ofg o seconomicsproduct (for perspective).7. Calculate totals and indices for recommending public policies ( s e below).Evaluation of Environmental ResourcesDecisions on the use of environmental resources cannot be made correctly using moneybecause money is only paid for services, but an EMERGY comparison can be prepared for choosingamong environmental alternatives. The management with the largest EMERGY may be chosen tomaximize the economy.A use that fosters environmental EMERGY production also maintains the area's ability toattract more EMERGY from outside sources. The environmental EMERGY contribution serves as anattraction for economic investments that bring in fuels, goods, services, technologies, etc., fromoutside. Purchased inputs interact with the environmental resource in new production processes.One can multiply the environmentalEMERGY by the EMERGY investment ratio of the region (seebelow) to estimate the potential the environmental use has in attracting the additional EMERGY ofoutside purchased resources.
Table 3. Emergy Evaluation of Texas Cattle, Grain, and Vegetable Production in 1983"NoteItemRaw UnitsJ,& TransformitySej/unitSolarEMERGYE20Macroeconomic 1983US E9 /yr1. Cattle and Calves2. Grains3. VegetablesNotes:Odum, Odum, and Blissett (1987)Cattle and Calves 1983; 5.555 E9 pounds production (Texas Livestock, Dairy,and PoultryStatistics for 1983, Texas Department of Agriculture, 60 pp)(5.555 E9 lbsX454 g/lb)(2.82kcal/g)(4186 J/kcal) 2.98 El6 J/yTransformity of beef products estimated from Appendix 35 as ratio of 0.89 o
information are the real wealth. It takes energy to concentrate the minerals needed by . an . economy. It takes energy to maintain and process information. When resources are abundant and cheap, there can . be . abundant wealth and a high standard of living. If resources and basic products a