Transcription
SPOTFIRE UTILISATION PROJECT:IMPLEMENTATION OF THE VLS FILTERFinal reportDr Rachel Badlan & Prof Jason SharplesUNSW Canberra
SPOTFIRE UTILISATION PROJECT: IMPLEMENTATION OF THE VLS FILTER REPORT NO. 730.2022VersionRelease historyDate1.0Phase 1 update23/05/2022All material in this document, except as identified below, is licensed under theCreative Commons Attribution-Non-Commercial 4.0 International Licence.Material not licensed under the Creative Commons licence: Department of Industry, Science, Energy and Resources logo Cooperative Research Centres Program logo Bushfire and Natural Hazards CRC logo Any other logos All photographs, graphics and figuresAll content not licenced under the Creative Commons licence is all rightsreserved. Permission must be sought from the copyright owner to use thismaterial.Disclaimer:UNSW Canberra and the Bushfire and Natural Hazards CRC advise that theinformation contained in this publication comprises general statements based onscientific research. The reader is advised and needs to be aware that suchinformation may be incomplete or unable to be used in any specific situation. Noreliance or actions must therefore be made on that information without seekingprior expert professional, scientific and technical advice. To the extent permittedby lawUNSW Canberra and the Bushfire and Natural Hazards CRC (including itsemployees and consultants) exclude all liability to any person for anyconsequences, including but not limited to all losses, damages, costs, expensesand any other compensation, arising directly or indirectly from using thispublication (in part or in whole) and any information or material contained in it.Publisher:Bushfire and Natural Hazards CRCMay 2022Citation: Badlan, R.L. and J.J. Sharples (2022). Spotfire utilisation project:Implementation of the VLS filter: Final Report 2021. Bushfire and Natural HazardsCRC, Melbourne.Cover: VLS filter for NW wind for Yankees Gap Fire, Bemboka NSW. Source:Badlan and Sharples 2021.1
SPOTFIRE UTILISATION PROJECT: IMPLEMENTATION OF THE VLS FILTER REPORT NO. 730.2022TABLE OF CONTENTSACKNOWLEDGMENTS4END-USER STATEMENT5EXECUTIVE SUMMARY6INTRODUCTION7VLS and mass spotting events9The VLS terrain filter9Datasets10Case-studies10PHASE 1 RESEARCH13Calibration of filter13Validation of filter15Options for operational filter overlay18Using the filters19FINAL VERSION OF VLS FILTER21Static filter21EVALUATION OF FILTER22FURTHER WORK23Static filters23Dynamic filters23Concluding remarks23REFERENCES253
SPOTFIRE UTILISATION PROJECT: IMPLEMENTATION OF THE VLS FILTER REPORT NO. 730.2022ACKNOWLEDGMENTSThe authors would like to acknowledge the Bushfire and Natural HazardsCooperative Research Centre as well as the end-users: Brad Davies (NSW RuralFire), Joe Murphy and Mark Brown (ACT Emergency Services Agency), AndrewSturgess (Queensland Fire Service), Sarah Harris (Country Fire Authority (Victoria)),Mark Chladil (Tasmanian Fire Service), and Andrew Stark (Country Fire Service(South Australia).Digital Elevation Model (DEM) datasets courtesy ofGeoscience Australia.4
SPOTFIRE UTILISATION PROJECT: IMPLEMENTATION OF THE VLS FILTER REPORT NO. 730.2022END-USER STATEMENTLaurence McCoy, Manager - Predictive Services, NSW Rural Fire ServiceThe 2019-20 bushfire season was one of the worst recorded in Australia. The fireseason was characterised by periods of extreme fire behaviour with anunprecedented number of extreme fire behaviour events recorded.Although awareness of Vorticity-Driven Lateral Spread and ensuing extreme firebehaviour is increasing within the fire management community, additionaltraining and dynamic tools to identify high risk locations for extreme firebehaviour will assist fire agencies to improve planning and prioritising suppression,strategies and tactics for future bushfires. This research is an important step forassessing the risk of extreme fire behaviour. It could help to inform fire managersoperational decisions ahead of and during fire fighting operations.The results of the case study applying the products to the Yankees Gap casestudy was encouraging and we look forward to continuation of this research andtrial of the products in an operational setting.5
SPOTFIRE UTILISATION PROJECT: IMPLEMENTATION OF THE VLS FILTER REPORT NO. 730.2022EXECUTIVE SUMMARYThe aim of this research was to produce an operational tool to assist fire agencypersonnel in assessing the potential for extreme bushfire development.Specifically, this work’s intention was to aid in the identification of regions of thelandscape that are prone to mass spotting and other dynamic fire behaviourassociated with vorticity-driven lateral spread (VLS). The research was dividedinto three phases: 1) calibration of the slope scale to each DEM, 2) creation ofthe filter (first and second order) and finally refinement of the filter and, 3)develop training material and ensure filters and related documents aredistributed to relevant personnel.The first-order and second-order wind-terrain filter enables the user to identifyparts of the terrain which are susceptible to VLS through its establishedassociation with steep or broken leeward facing terrain elements. This is achievedusing terrain attributes such as topographic slope, aspect, and profile curvature,as well as environmental variables such as the wind speed and direction. Thisbuilds upon the research initially undertaken as part of the original BushfireCooperative Research Centre.This report summarises the three phases of the project, during which time theresearchers have gained familiarity and VLS mapping capability with the GISsoftware “ArcGIS Pro”, which is used to create and validate the wind-terrainfilters. This facilitated the two main research objectives – to develop and thenrefine the first order and second order wind-terrain filters so that they may beapplied using DEMs of any resolution.Initially, this involved manual tuning of the first-order wind-terrain filter’sparameters to fit a number of calibration events. This tuning was also confirmedthrough analyses of slope distributions over various landscape domains. Thesestatic cases were then validated with real case conditions and the filtercompared to areas where VLS was known to have occurred. Scaling thresholdsfor the 30, 90 and 250 metre resolution DEMs were also evaluated explicitly, anda general linear model has been determined to allow estimation of parameterthresholds for more general DEM resolutions.The second-order filter was then designed and tested in a similar manner to thefirst-order filter. The two filters were then merged into a combined operationalproduct, which was also validated using known cases of VLS. Both filters arepresented here - separately and as a combined product - for the operationalconsideration of end-users. End-user feedback was then evaluated to furthertailor the operational product to specific operational needs, platforms, andformats. Due to travel restrictions static filters have been produced for immediateuse. Development of a dynamic mapping tool is also continuing in which otherfactors such as the forecast wind speed and direction (and potentially othervariables) can be incorporated automatically to provide heightenedoperational intelligence on extreme bushfire development.6
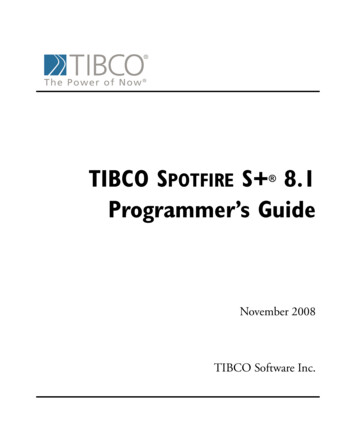
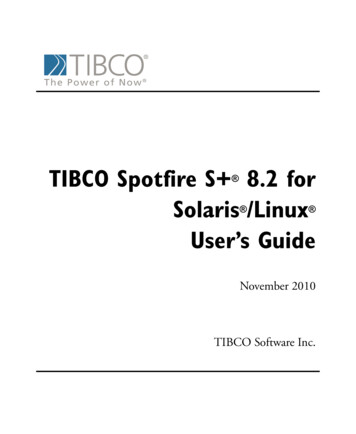
SPOTFIRE UTILISATION PROJECT: IMPLEMENTATION OF THE VLS FILTER REPORT NO. 730.2022INTRODUCTIONAn extreme bushfire is the most dangerous manifestation of a fire and is definedas “a fire that exhibits deep or widespread flaming in an atmosphericenvironment conducive to the development of violent pyroconvection, whichmanifests as towering pyrocumulus (pyroCu) or pyrocumulonimbus (pyroCb)storms” (Sharples et al. 2016). These fires are increasingly in frequency andintensity due to changing conditions such as increased drought and globaltemperatures.Extreme bushfires development is driven by a number of factors that can causesmall fires to rapidly escalate in size and intensity. Extreme fires exhibit expansiveareas of active flaming – referred to as ‘deep flaming’ (McRae et al. 2015). Firesthat have regions of deep flaming have also been referred to by other authorsas ‘areal fires’ or ‘mass fires’. Factors thay may act as triggers for extreme firesinclude change of wind direction, strong winds, eruptive fire behaviour, massspotting and fire coalescence, and VLS (Badlan et al. 2017). The last three ofthese involve dynamic fire propagation, whereby the fire spread transitions froma quasi-steady to accelerated rate of spread. Dynamic fire behavours areproblematic not only because the fires increase their size rapidly, but may alsocatch people in the vicinity offguard, leading to loss of life and property. VLS hasbeen identified as a driver of extreme fire development in numerous events suchas the 2003 Canberra fires (McRae 2004;Sharples et al. 2012;Simpson et al. 2015),and the Aberfeldy (Quill et al. 2015) and the Wambelong fires of 2013 (Dillon2013). These case studies have been chosen to calibrate and validate the filters.VLS occurs when steep (or broken) topography and strong winds interact toproduce flow separation, creating horizontal vorticity such as a lee slope eddy.The fire’s updraft may then stretch and tilt this horizontal vorticity into intensevertical vorticity, which may then cause the fire to spread laterally along theridge line (Simpson et al. 2014;Simpson et al. 2013). As lateral spread is associatedwith intense vorticity, this means that ember generarion is enhanced. Theseembers are then transported laterally and downwind due to the combinedinfluence of the vertical vorticity and the prevailing wind, potentially resulting inmass spotting and fire coalescence (Sharples et al. 2019).FIGURE 1. SIMULATION OF VLS ACROSS LEEWARD SLOPE, WITH LINES REPRESENTING AIRFLOW. RED SHADING REPRESENTS THE FIRE. WIND IS ALIGNEDPERPENDOICULAR TO RIDGE AXIS (SIMPSON ET AL. 2016).7
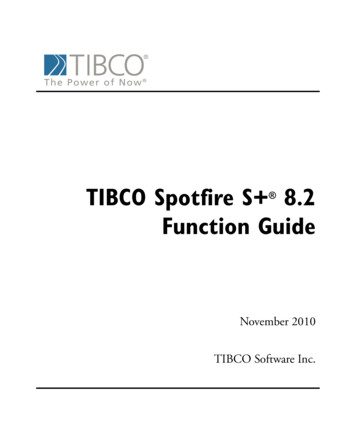
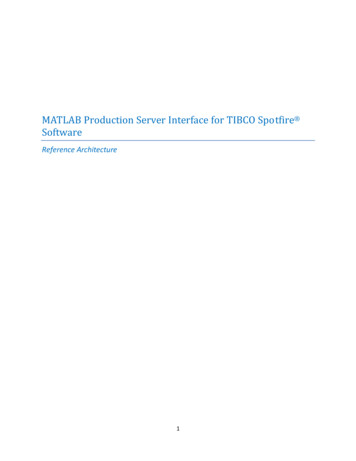
SPOTFIRE UTILISATION PROJECT: IMPLEMENTATION OF THE VLS FILTER REPORT NO. 730.2022This aim of this project was to create an operational overlay that highlights areasof high VLS risk. This was begun by developing static overlays that indicate asingle wind direction for an area and then progress to using real-time windvectors to calculate filters that reflect the changing, dynamic conditions thataffect VLS.The original research by (Sharples et al. 2012) used a 250 metre DEM to initiallyinvestigate what slope threshold and aspect to use for a given DEM. They foundthat a minimum slope of 10.5 degrees was necessary to identify VLS using a 250metre resolution DEM.However, there are issues with how slopes scale with DEM resolution. This isbecause slopes get smoothed (i.e., the angle of slope reduces) with decreasingresolution. The threshold for the flow separation required for VLS is usually cited as20 degrees and this raises the question of “What minimum slope is required fordifferent resolution DEMs?”. Further investigations by the authors examined thedistribution of slopes in a given domain, using different resolution DEMs. This wasrepeated for this work (see Section ‘Slope Distributions’, under Phase 1 Research).Two filters are required for analysing VLS – a first-order differential of elevation (i.e.the slope). A first-order filter on its own would be sufficient if real topographyreflected a hill such as that in Figure 2a. However, is not sufficient in ruggedterrain which has ‘broken’ topography. Ridge lines and bluffs which adjoin VLSprone slopes, are all part of the VLS-prone landscape. Unfortunately, these ridgesare not identified by a first-order filter as this filter only captures slope greater thana certain threshold (but not the top of the ridge, which tends to have gentlerslopes (Figure 2b)). Therefore, a second-order is needed to identify the leewardridgelines (Figure 2c).FIGURE 2. FIRST-ORDER VLS FILTERS FOR A) AN 'UNBROKEN' HILL PROFILE, AND A SIMPLE RIDGE PROFILE WITH A FIRST-ORDER FILTER (B) AND SECONDORDER FILTER (C).8
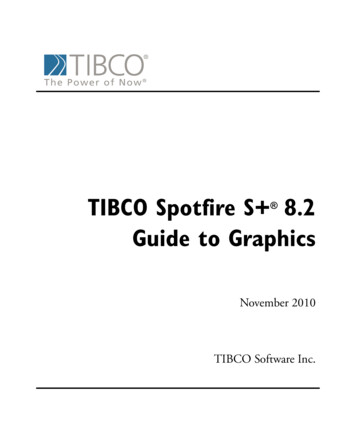
SPOTFIRE UTILISATION PROJECT: IMPLEMENTATION OF THE VLS FILTER REPORT NO. 730.2022VLS AND MASS SPOTTING EVENTSVLS plays an important role in the generation of mass-spotting, which in turncontributes to the escalation of an extreme fire. Figure 3 shows a schematic of afire which has ignited on the mid-slope of a windward facing slope. This fire initiallyspreads up the slope in the direction of the prevailing wind. When the fireencounters the ridge line (indicated by the white dashed line), dynamic fireinteractions then drive the fuel laterally (VLS) along the ridge line. These regionsof lateral spread act as an enhanced source of embers, which are consequentlydeposited downwind on the lee-facing slope, as a dense ember attack. Theresulting dense spot fires then interact, coalesce, and form deep flaming zones.FIGURE 3. SCHEMATIC DIAGRAM ILLUSTRATING A TYPICAL SCENARIO INVOLVING VLS AND ASSOCIATED DOWNWIND SPOTTING, SPOT-FIRECOALESCENCE AND FORMATION OF DEEP FLAMING.THE VLS TERRAIN FILTERFirst-order filterAs described previously, VLS is dependent on the slope and and apect of thatslope to the prevailing wind. These conditions may be expressed formally as:𝜒𝜒(𝜎𝜎, 𝛿𝛿 ) 1 if 𝑆𝑆 𝜎𝜎 and 𝜃𝜃 𝛼𝛼 𝛿𝛿,0otherwise,Where S is the topographic slope, α is the topographic aspect and θ is thedirection the wind is blowing from. This is the opposite of the standard winddirection and is calculated by subtraction or addition of 180o from the standardwind direction; therefore, a westerly wind has a direction of 90o. σ and δ are theslope threshold and aspect discrepancy respectively. In summary, the first-orderfilter identifies areas of the landscape with lee-facing slopes where flowseparation is likely to occur (i.e., slope greater than 20o), however the slope9
SPOTFIRE UTILISATION PROJECT: IMPLEMENTATION OF THE VLS FILTER REPORT NO. 730.2022threshold will depend on the resolution of the DEM being used. This is addressedby the calibration stage of the research.Second-order filterThe second-order filter depends on the second order directional derivative ofthe surface (DEM) and the aspect:𝜙𝜙(𝐶𝐶, 𝛿𝛿 ) 1 if 𝐶𝐶 0 and 𝜃𝜃 𝛼𝛼 𝛿𝛿,0otherwise,Where C is the profile curvature, α is the topographic aspect and θ is thedirection the wind is blowing from. The profile curvature tool in ArcGIS Pro is usedto achieve this. The profile curvature is parallel to the slope, indicating maximumslope. This filter identifies areas of the landscape that are associated with ridgelines, whereas the first-order identifies slopes. Initially this filter is set to identify areasof negative curvature (C 0), which results in identifying typical ridge lines suchas those shown in Fig. 2 b and c. However, a study of how thresholds for C mightchange with resolution may be useful in the future (see Further Work).DATASETSThe datasets used for this research were from the Shuttle Radar TopographyMission (SRTM)(Farr et al. 2007); the 1 second, 3 second-derived (GeoscienceAustralia 2009) and 9 second datsets with resolutions of approximately 30, 90, and250 metres respectively.CASE-STUDIESTo test the slope threshold for the filters, it was first necessary to create somedomains based on previous case studies where VLS was noted to play a role inthe escalation of the fire. One case-study was chosen for calibration of the slopethresholds (Fig. 4) used for each dataset, with another two added for validationof those slopes afterwards (Figs. 5 and 6).10
SPOTFIRE UTILISATION PROJECT: IMPLEMENTATION OF THE VLS FILTER REPORT NO. 730.2022For calibrationCanberra fires, ACT and NSW, 18th January 2003Wind direction: NW-WNW 305oFIGURE 4. MAP OF CANBERRA DOMAIN WITH POLYGONS INDICATING AREAS OF VLS SPREAD. YELLOW ARROW INDICATES DIRECTON OF WIND.FIGURE 5. MAP OF THE JINGELLIC DOMAIN WITH POLYGONS INDICATING AREAS OF VLS SPREAD. YELLOW ARROW INDICATES DIRECTON OF WIND.For validationAberfeldy Fire, Victoria, January 2003Wind direction: NW 337.50oFIGURE 5. MAP OF ABERFELDY DOMAIN WITH POLYGONS INDICATING AREAS OF VLS SPREAD. YELLOW ARROW INDICATES DIRECTON OF WIND.11
SPOTFIRE UTILISATION PROJECT: IMPLEMENTATION OF THE VLS FILTER REPORT NO. 730.2022Wambelong Fire, NSW, 30th December 2013Wind direction: NW 315oFIGURE 6. MAP OF WAMBELONG DOMAIN WITH POLYGONS INDICATING AREAS OF VLS SPREAD. YELLOW ARROW INDICATES DIRECTON OF WIND.12
SPOTFIRE UTILISATION PROJECT: IMPLEMENTATION OF THE VLS FILTER REPORT NO. 730.2022PHASE 1 RESEARCHUsing ArcGIS Pro software, a first-order filter was made for the Canberra Domainusing 30, 90 and 250 metre SRTM DEMs. Three static rasters were created: slope,aspect, and curvature (for the 2nd-order filter). A conditional statement was thenused to capture areas that have slopes greater than the chosen threshold andan aspect which is the wind direction discrepancy.CALIBRATION OF FILTERThese first-order filters were then calibrated by manually tuning the filter. This wasdone by running the filter at with different slope thresholds and varying theaspect from 35 to 45 degrees, and visually assessing whether the filter capturedmost of the polygons in Fig. 4. As a result, the slope thresholds were then chosento be 18o, 15o and 11o for the 30, 90, and 250 metre DEM datasets respectively,with an aspect discrepancy of 40o.Slope DistributionsAnother method of determining equivalent angle of slope for a given DEM, wasto look at the distribution of slopes in a given area and to look at the equivalentproportions of slope in each DEM. Figure 7 shows the slope distributions for theACT domain; a 5 metre resolution LIDAR DEM has also been added.FIGURE 7. GRAPH OF THE SLOPE DISTRIBUTIONS FOR THE 5 M LIDAR AND THE 30, 90, AND 250 METRE SRTM DEMS.13
SPOTFIRE UTILISATION PROJECT: IMPLEMENTATION OF THE VLS FILTER REPORT NO. 730.2022FIGURE 8. CORRELATION BETWEEN VARIOUS RESOLUTION DEMS FOR SRTM AND SRTM-DERIVED DATASETS (NASA & LIDAR) AND MANUALLY SMOOTHEDDEMS FROM THE 30 METRE DEM.The relationship between these SRTM and LIDAR DEMs is shown in Figure 8 (redline). This figure also shows a comparison with DEMs that were created bysmoothing (averaging) the 30 metre DEM (blue line). The SRTM datasets are verydifferent to those produced by only smoothing, as they are created usingsmoothing which involves sophisticated statistical and interpolative methods.A graph was then produced looking at the equivalent slopes for each SRTM DEMfor the Canberra domain to aid in calibration of the filter (Fig. 9). As a result ofthe probability density graphs, slope threshold values of 10, 16 and 18 degreeswere then chosen for the 30, 90 and 250 metre datasets.FIGURE 9. SLOPE DISTRIBUTIONS OF THE CANBERRA DOMAIN USING THE THREE SRTM DATASETS. THE VERTICAL LINES SHOW THE EQUIVALENT VALUES OFTHE DISTRIBUTION OF SLOPES ABOVE 20 DEGREES.14
SPOTFIRE UTILISATION PROJECT: IMPLEMENTATION OF THE VLS FILTER REPORT NO. 730.2022Comparison of proportion of filter inside polygons to that outsideFor the ‘Canberra fires’ domain, the proportion of the area inside a givenpolygon, which is captured by the filter, was then compared to the proportion ofthe area outside the polygons covered by the filter. Obviously, although VLS or afire is not associated with those regions, it does not mean one could not haveoccurred outside the polygon regions marked. The filter was designed to identifyregions of risk, without there being an associated fire and without capturing toomuch of the landscape.For the 250 metre filter (first-order)and using a 10 degree slope threshold and a40 degree aspect, the percentage of the area within the polygon captured bythe filter was approximately 32%, whereas the area outside the filter wasapproximately 9%. As the slope threshold decreases, the filter obviously capturesmore of the landscape, but will increasingly capture regions that are not a realVLS risk. The aim was to use the highest slope threshold, without loss of information.For the 90 metre data, it was 21% within and 7% outside and for the 30 metre, itwas 19% within and 6% outside. This indicated that the filter captured the areasof VLS risk however, it did not capture too much of the other areas of thelandscape, making it a useful tool as it identifies areas within the polygons withoutcomplicating VLS assessment by identifying large areas outside. These numberswould change obviously given different landscape and different slopedistributions.VALIDATION OF FILTERFIGURE 10. THE FIRST-ORDER VLS FILTERS FOR THE 30, 90, AND 250 METRE DEMS, WITH THE SLOPE THRESHOLDS OF 18, 16 AND 10 DEGREES RESPECTIVELY.15
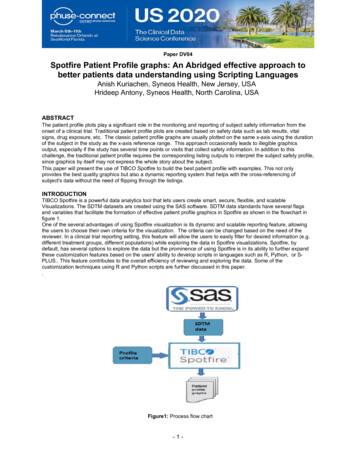
SPOTFIRE UTILISATION PROJECT: IMPLEMENTATION OF THE VLS FILTER REPORT NO. 730.2022Figure 10 shows the first-order filters for the Canberra domain with the threedifferent resolution DEMs. Obviously, the 250 metre filter lacks the detail of thetwo finer filters but does indicate the general areas at risk of VLS.All three domains (Canberra, Aberfeldy and Wambelong were then used tovalidate both the first and second-order filters (Figure 11). This was done by avisual inspection of the polygon areas in each domain to ensure that the filtercaptured the VLS prone areas, given the wind direction around the time lateralspread occurred.FIGURE 11. FIRST-ORDER FILTER (IN RED) OVERLYING SECOND-ORDER FILTER (IN BLUE) FOR ALL FOUR DOMAINS USING 30 METRE DEM.As can be seen in Figure 11, the first-order filter (regions in red) did the best inidentifying the broad areas for VLS. The second-order filter (blue regions) onlygave more information where there were broad ridge lines (i.e. the width of theridge is much greater than the resolution of the DEM) or in areas of plateaus orbluffs (such as in the case of the Wambelong bluff – LH polygon – where a broadarea of blue can be seen on the windward side of the bluff). For ease ofinterpretation, the domains show the second-order filter overlain by the first-orderfilter to ascertain how much more of the landscape is captured by the secondorder filter.16
SPOTFIRE UTILISATION PROJECT: IMPLEMENTATION OF THE VLS FILTER REPORT NO. 730.2022Note: This method was also unofficially applied to an international event andsuccessfully captures VLS prone areas in the case of the Cerro Grande Fire, LosAlamos, New Mexico, 2010 as well as the 2020 Bridger Hills Fire in Montana (seethe training manual (Badlan and Sharples 2021), for more detail).Noise reduction – removal of isolated pixelsTo aid with interpretation of regions with complex terrain where the second-orderfilter may identify many small areas of VLS risk, a noise reduction mask was alsoapplied to the combined first- and second-order overlay. The method used,identifies where pixels that are adjacent (have faces touching) and then, usinga post-processing tool, removes groups comprising less than 10 pixels (for the 30m DEM). This number is obviously changeable but analysis of the 3 case studies(plus an international example) has shown that removing groups ofapproximately 8 - 10 removes most isolated pixels without losing essentialinformation. Figure 12 shows the region near the Wambelong fire. The pink areasindicate the combined first and second order filters with the green areasremoved as they are less than 8 pixels in size. For the 90 metre and 250 metredatasets, blocks of less than 6 and 4 are used respectively. However, in very‘broken’ topography, these could be reduced futher.FIGURE 12. VLS FIRST AND SECOND ORDER FILTER (PINK) WITH ISOLATED PIXELS REMOVED (IN GREEN). REGION SHOWN IS NEAR THE WAMBELONG FIRE.POLYGONS SHOW AREAS WHERE VLS WAS IDENTIFIED. CONTOUR LINES ARE EVERY 50 METRES.17
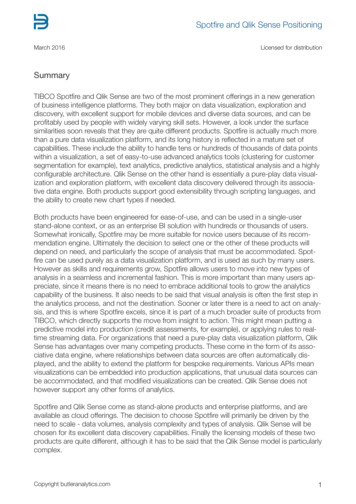
SPOTFIRE UTILISATION PROJECT: IMPLEMENTATION OF THE VLS FILTER REPORT NO. 730.2022OPTIONS FOR OPERATIONAL FILTER OVERLAYThere were therefore some options for the information contained in the finaloperational filter. Figure 13 shows the various configurations that could havebeen chosen for the eventual filter.The options were:a) the first-order filter only (this shows the main areas of risk),b) the second-order filter only. While this does identify the ridge tops wherethe lateral spread ends to be confined. It omits the broader regionsprone to the impacts of VLS.c) first-order and second-order filters as a two-layer overlayd) combined (union of) first-order and second-order filterse) Combined filter with isolated pixels removed.f) The option of removing isolated pixels, to make it easier forinterpretation, without loss of the major VLS zones.FIGURE 13. VARIOUS VLS WIND-TERRAIN FILTERS APPLIED TO YANKEES GAP FIRE, BEMBOKA. A.1ST-ORDER VLS FILTER B.2ND-ORDER VLS FILTER C.1ST-ORDERFILTER OVERLYING 2ND-ORDER FILTER D. BOTH FILTERS MERGED E. BOTH FILTERS - PIXELS REMOVED18
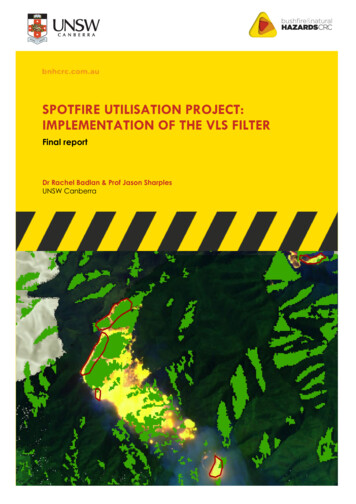
SPOTFIRE UTILISATION PROJECT: IMPLEMENTATION OF THE VLS FILTER REPORT NO. 730.2022USING THE FILTERSYankees Gap fire (Bemboka)To illustrate the use of the filter, the case study of the Yankees Gap Fire isconsidered.1) The fire authorities are informed of a fire with ignition at point ‘x’ (Figure14 a) on 15th September 2018 at approx. 1320 hrs. Wind is approximatelyWNW.2) VLS filter for WNW wind for first and second order filter combined showsthe fire near VLS-prone areas (Fig. 14 b).3) Linescan on 15th September 2018 at approx. 1417 hrs with polygonsshowing areas where VLS occurred (Fig. 14c)4) VLS filter overlain to show where VLS occurred and where the filterpredicted (Fig. 14d).This case-study is thoroughly covered in the training manual.The first and second order VLS filters have been tested for the chosen case studiesand have identified areas of high VLS risk, for those examples. However, thereare areas of low slopes and broken topography that have experienced VLS butwould not be captured by this filter. This is due to the extent of the slope beingless than the resolution of the DEM and would need to identify solely by thesecond order filter. For a balance between accuracy and ease of interpretation,the merged first and second order filters with the removel of isolated pixels waschosen for all the static filters.19
SPOTFIRE UTILISATION PROJECT: IMPLEMENTATION OF THE VLS FILTER REPORT NO. 730.2022FIGURE 14. YANKEES GAP FIRE 15 SEPTEMBER 2018. A) LINESCAN AT 1320 HRS, B) VLS FILTER FOR WNW WIND, C) LINESCAN AT 1417 HRS, AND D) FILTERAND LINESCAN OVERLAIN.20
SPOTFIRE UTILISATION PROJECT: IMPLEMENTATION OF THE VLS FILTER REPORT NO. 730.2022FINAL VERSION OF VLS FILTERSTATIC FILTERThe version of the filter initially supplied is the static filter. These are produced usinga uniform wind direction for each of the main 16 cardinal points (N, NNE, NE, ENE,E, ESE, SE, SSE, S, SSW, SW, WSW, W, WNW, NW, and NNW). The filters are producedfor each of the following states: New South Wales, Queensland, South Australia,Tasmania, and Victoria. Each filter is supplied in a coarse resolution (based on a250 metre resolution DEM) and an intermediate resolution (based on a 90 metreresolution DEM). High resolutions may be produced if requested.The suggestion is to apply the coarse resolution filter initially to identify broadregions where VLS may occur given the synoptic wind direction being forecast.The intermediate filter may then be used to get more detail for a particular area.The associated training manual (Badlan and Sharples 2021) gives a morecomprehensive overview of the filters and guides the reader through two casestudies to gain familiarity in use and interpretation.21
SPOTFIRE UTILISATION PROJECT: IMPLEMENTATION OF THE VLS FILTER REPORT NO. 730.2022EVALUATION OF FILTERUnfortunately, due to the COVID pandemic, and the resultant border closuresand travel restrictions, it was not possible to incorporate first-order VLS filterprototype into operational framework or engage in face-to-face meetings aspart of the development stage.However, it was possible to consult with Simeon Telfer (Department ofEnvironment and Water, South Australia), in April 2021 who gave acomprehensive overview of the platform that DEW use and how the filter wouldbe incorporated into operational overlays. We also discussed the method ofincorporating real-time wind data into the filter (see further work). Simeon alsoconfirmed the usefulness of such a filter for research and to determinedangerous conditions for fire-prone areas.Musa Kilnic from Country Fire Authority in Victoria has also provided positivefeedback and has shown interest in use of the filter for operational purposes.22
SPOTFIRE UTILISATION PROJECT: IMPLEMENTATION OF THE VLS FILTER REPORT NO. 730.2022FURTHER WORKSTATIC FILTERSSome additions are planned to the static filter datasets. Firstly, the addition offilters for the southern part of Western Australia is planned as it has experienceda number of extreme fires and would therefore benefit having fiter overlays toallow analysis of fires in the region.The current collection of filters will also be expanded to allow for a high resolutionset of filters which may be of particular use for more detailed analysis of pastevents and to interpret certain scenarios.Avenues for future refinement may potentially include calibration of secondorder filter with slope, inclusion of other factors such as fuel load and moisturecontent and, further research into identifying any parts of the landscape whereVLS has been noted to occur but has not been identified by the current filter.DYNAMIC FILTERSTo accommodate the dynamic conditions that affect the likelihood of VLS, it isintended to incorporate the wind forecast used by each state. The approach isto create a Python script that could be run daily to create VLS filters for eachwind forecast (usually hourly). As FBANs are trying to decide how the conditionsare changing throughout the day, they can apply whichever filter they need,depending on the time of the forecast needed.Each agency must then also create an area to store all the filters, so analysis ofevents can take place afterwards if needed, for either training, case studyanalysis (learned outc
SPOTFIRE UTILISATION PROJECT: IMPLEMENTATION OF THE VLS FILTER . Version Release history Date . 1.0 Phase 1 update 23/05/2022 . All material in this document, except as identified below, is licensed under the Creative Commons Attribution-Non-Commercial 4.0 International Licence. Material not licensed under the Creative Commons licence: