Transcription
Using flow cytometry to improvewater qualityCharmian Abbott15 May 2018
United UtilitiesCopyright United Utilities Water Limited 20162
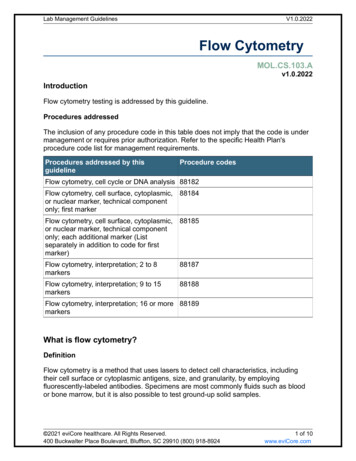
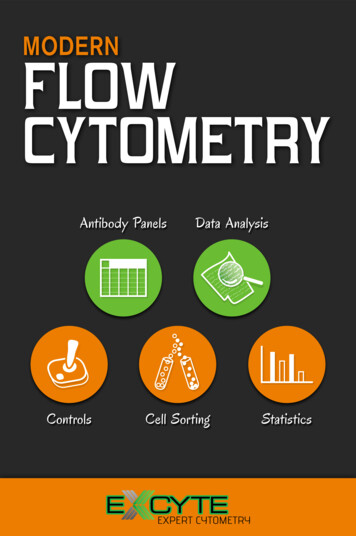
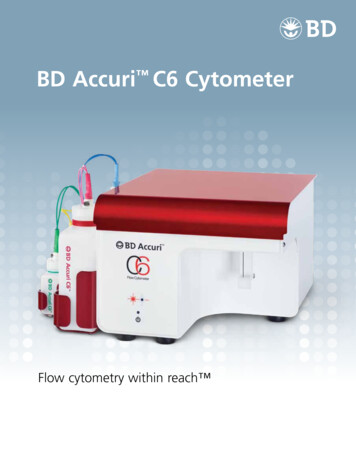
Water Quality Data15562 regulatory WTW coliform samples 201715561 zero results1 infringementUseful data to enhance water quality ?Mean Zonal ComplianceCopyright United Utilities Water Limited 20163
So what does the data tell us?Copyright United Utilities Water Limited 20164
Flow CytometryOverview of the timeline since introduction Feb 2014 - First cytometer (C6) commissioned (FC1)Initial testing on target samples, small stability trial carried out. July 2015 - Second cytometer (C6) commissioned (FC2)Introduced to provide more capacity for analysis of all WTW and SR monitoring points. July 2017 - Third cytometer (FACSVia) commissioned (FC3)Introduced over the C6 solely to enable on site repair/servicing.For development/validation work – but C6 issues are delaying this. Apr 2018 - Fourth cytometer (FACSVia) expected to replace FC1 or FC2This will bring more resilience to the lab, aid future validation exercises, and release a C6 to the Ops/Process scientists.Copyright United Utilities Water Limited 20165
Flow Cytometry Two stains – SYBR Green and Propidium Iodide Intact cells take up the fluorescent stain SYBR green This stain binds to DNA and RNA and fluoresces at530 nm Propidium iodide can only enter cells with damagedmembranes PI also binds to DNA and RNA but fluoresces at 690nm By using a mixture of the stains intact and damagedcells can be identified Report Intact, Dead and Total cell counts plus %dead cell counts to the business.Copyright United Utilities Water Limited 20166
Flow cytometry at United Utilities In place since late 2014 All WTW and SR final water samples are automatically analysed for flow cytometry alongsideroutine regulatory analysis and available on corporate systems Any abnormal results are automatically highlighted and notification sent to the water qualityanalysts for review, dissemination and action Flow Cytometry data is trended and feeds into: Weekly reports for all sites distributed to the Director of Water and his wider team Tier meetings for process and network which feed into our DWSP risk assessments Reviews following abnormal results or infringements/events Reactive risk assessments providing provisional view of water quality in emergency situationsCopyright United Utilities Water Limited 20167
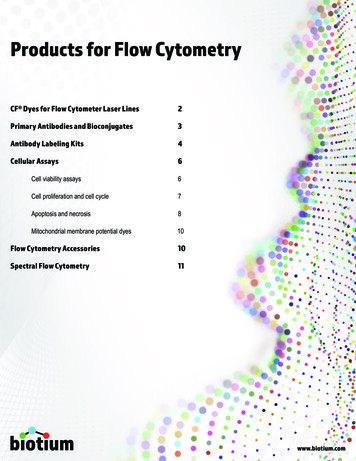
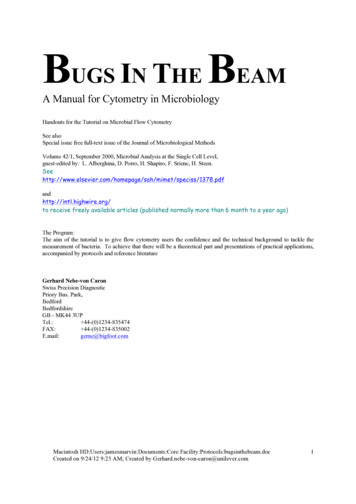
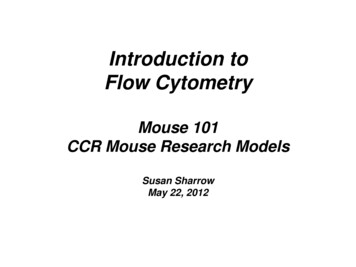
So what does the data tell us?Flow cytometry live cells and free chlorineCopyright United Utilities Water Limited 20168
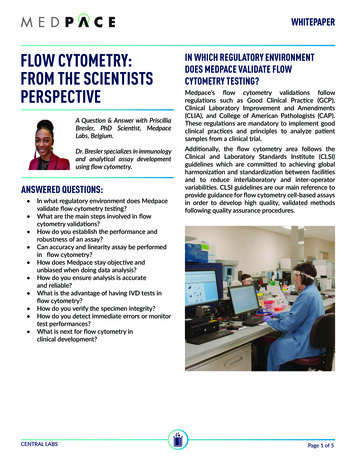
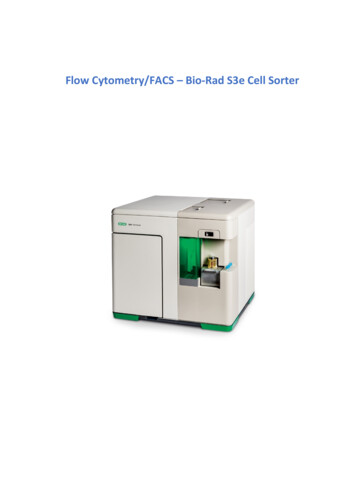
Flow cytometry as a leading indicator of performanceCopyright United Utilities Water Limited 20169
Inform operational decisions and risk assessmentsCopyright United Utilities Water Limited 201610
Reducing challenge to the disinfection processCopyright United Utilities Water Limited 201611
Proactive actionCopyright United Utilities Water Limited 201612
Flow cytometry challenges Understanding what the data is saying: what is abnormal and when to respond? In our experience, earlier models were not very reliable, needed to be sent away for repair andreproducibility of results was low. Forming baseline and fingerprint for each water supply system Understanding the impact of different treatment processes: e.g not as insightful for sites with UVtreatmentCopyright United Utilities Water Limited 201613
Flow Cytometry - Advantages Highly sensitive Live cell numbers much greater than shown bycolony counts Fast (same day results) Small sample volumes required (we use 50µl) Versatile (protocols available for many types of analysis in clinical and industrial fields) Allows simultaneous quantitative assessmentof multiple cellular parameters at the single-cellShows similar rates of removal to that of particlecounting ( 99.6%) Provides another tool to proactively investigateand improve treatment performancelevelCopyright United Utilities Water Limited 201614
Using flow cytometry to enhance water quality: Raw water source risk Particularly borehole sources Process optimisation including assessment of disinfection efficiency Leading indicator, early warning Understanding the challenge to the disinfection process from upstream processes Bacteriological infringement investigations Assessment of risk to inform Drinking Water Safety Plan Potential identification of ingress Identification of bacterial regrowth Potential indicator of water age and/or taste and odour Early indication of microbiological quality of the water following mains repair/intrusive work Potential for use as a field instrument ?Copyright United Utilities Water Limited 201615
Feb 2014 - First cytometer (C6) commissioned (FC1) Initial testing on target samples, small stability trial carried out. July 2015 - Second cytometer (C6) commissioned (FC2) Introduced to provide more capacity for analysis of all WTW and SR monitoring points. July 2017 - Third cytometer (FACSVia) commissioned (FC3)