Transcription
Introduction toFlow CytometryMouse 101CCR Mouse Research ModelsSusan SharrowMay 22, 2012
FLOW CYTOMETRYA technology that provides:Rapid, Quantitative, Single CellFluorescence Analysis and CellSeparation
How does it work?
?5.4%3.2%87.6%1.9%How to get from tissueto flow cytometry result?
Experimental DesignAndSample PreparationFlow Cytometric Analysisand/orSortingData Analysis
Experimental DesignAndSample Preparation-- Quality of sample is important. This means viability and single cells.-- What is the question? This determines what controls you do.-- What is the question? This determines which reagents you use.--How many parameters are needed? This determines the probes youselect and the instrument you use.--Use the optimal amount of antibody!!!!!
TOP TEN MISTAKESEXPERIMENTAL DESIGN AND SAMPLE PREPARATION1.2.3.4.5.6.7.8.9.10.Too much antibodyToo little antibodyBelieving that a manufacturer’s test amount is meaningfulToo few washesToo many different reagents in a single incubationSelecting a fluorochrome inappropriate for the instrumentFailure to mix cells and reagents completelyChanging the protocol!!!Lack of precision in final staining volume .too large a volumeSMASHING YOUR CELLS!
FLUOROCHROME SELECTION: CRITICAL VARIABLES1.Available excitation wavelengths2. Relative intensities of staining(proportional to level of expression of molecule of interest)3.Number of detectors available for each excitation wavelengthNote: the “number of colors” that an instrument can measure isnot a relevant question.
FLUOROCHROME SELECTION: GUIDELINES1.Consult an online Fluorochrome Spectrum or/spectrumviewer/index.jsp2.Choose fluorochromes that can be excited on the instrument.3.Do not pair very bright and very dull reagents in colorcombinations requiring significant compensation such as Fitcand Pe.4.For critical comparisons, choose fluorochrome pairs excited bydifferent lasers.
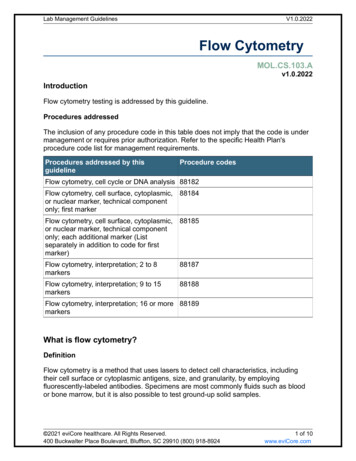
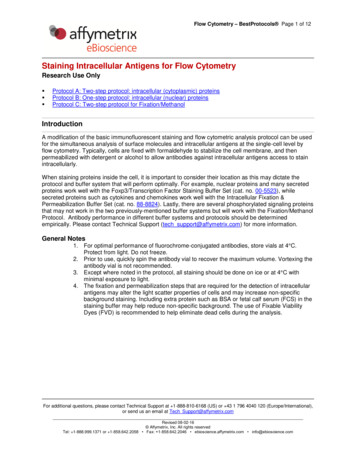
488 nm Laser Excitation: Spectra of Fitc and of Pacific BluePacific Blue DOES NOT EXCITE with 488nmBandpass FilterExcitationEmission
Bandpass FilterExcitationEmissionOVERLAPNOTE:Spectral overlap is greater when measuring thelonger wavelength emission of anyfluorochrome pair.
There is no “cross-talk” when using the fluorochrome pair Fitc and APC488 nm excitationFitc does exciteAPC does NOT excite640 nm excitationFitc does NOT exciteAPC does excite
FLUOROCHROME SELECTION:REMEMBER THAT DETECTORSARE INHERENTLY LESSSENSITIVE IN “RED” THAN IN“GREEN”A TANDEM DYE CONSISTS OFTWO DIFFERENT DYE MOLECULES;1. A DONOR DYE and2. An ACCEPTOR DYEThe emission of the donor dye excitesthe acceptor dye whose emission is thenmeasured.Example: PE-Cy7
Fluorochrome Selection .What is a tandem dye?A tandem fluorochrome is made by conjugation of two fluorescent dye molecules.One dye molecule is excited by, for example, 488nm. This dye emits at 578nm andbecause of the close spatial relationship this emission excites the second dye whichemits at 670nm.Tandem fluorochromes thus provide a way to provide additional “colors” from asingle excitation source.Caution: The second dye in the tandem can also produce fluorescence emissionwhen excited by a second laser!
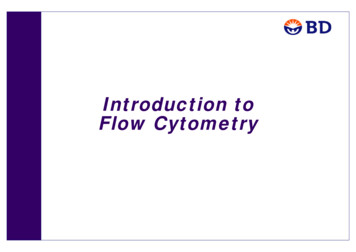
Potential antibody-binding scenarios to a cell(s).Zhang et al.: Quantification of Ab Avidities: Scale-Up Implications 815Biotechnology and Bioengineering. DOI 10.1002/bit
VARIABLES AFFECTING ANTIBODY BINDINGTO CELLS1.2.3.4.5.6.7.8.Ligand Concentration AntibodyLigand Concentration CellsLigand Concentration Antigen DensityTimeTemperatureValency of BindingAntibody AffinityLocal Stoichiometry
The optimal amount of antibody (antibody concentration) providesmaximum signal:noise.1.For a monoclonal antibody used for surface staining, this will generallybe 0.125 to 0.5 micrograms ab per 1 million cells in 50ul.2.For internal staining, or for polyclonal reagents, the maximum signal:noisemust be determined empirically.3.It is impossible to determine the optimal amount based upon themanufacturer’s “test”.Sample titration of anti-CD8-PEDoubling dilutions from 1ug down to .004ug per million thymocytes
TOP TEN MISTAKESEXPERIMENTAL DESIGN AND SAMPLE PREPARATION1.2.3.4.5.6.7.8.9.10.Too much antibodyToo little antibodyBelieving that a manufacturer’s test amount is meaningfulToo few washesToo many different reagents in a single incubationSelecting a fluorochrome inappropriate for the instrumentFailure to mix cells and reagents completelyChanging the protocol!!!Lack of precision in final staining volume .too large a volumeSMASHING YOUR CELLS!
Flow Cytometric Analysisand/orSorting
TOP TEN MISTAKESINSTRUMENT SETUP AND DATA COLLECTION1.2.3.4.5.6.7.8.9.10.Setting voltage too LOW on one or more detectors.Setting voltage too HI on one or more detectors.Setting voltage imbalance between detectors.Errors in setting compensationFailure to collect and save compensated data on comp controlsUsing the wrong compensation controlsBelieving that software compensation always worksCollecting data on too few cellsFailure to perform doublet discriminationFailure to clean instrument before AND after experiment
Pulse HeightVsPulse WidthVsPulse AreaPulse HeightPulse WidthPulse AreaINTENSITYTIMELASER 1LASER 2LASER 3
The ACCEPTOR Dyein a tandem dye can beexcited by more thanone laser.TANDEM DYEINTENSITYTIMELASER 1LASER 2LASER 3
FLUOROCHROME SELECTION:REMEMBER THAT DETECTORSARE INHERENTLY LESSSENSITIVE IN “RED” THAN IN“GREEN”A TANDEM DYE CONSISTS OFTWO DIFFERENT DYE MOLECULES;1. A DONOR DYE and2. An ACCEPTOR DYEThe emission of the donor dye excitesthe acceptor dye whose emission is thenmeasured.Example: PE-Cy7
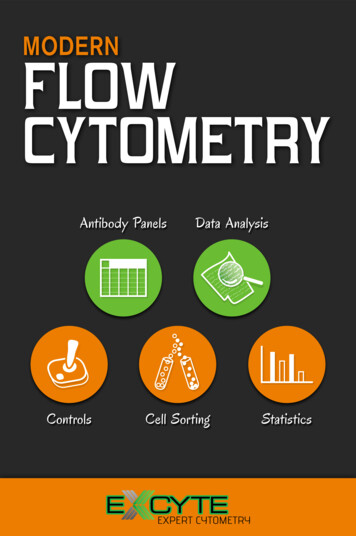
What is compensation, and why do we need it?NOTE:More spill-over at high wavelengthend of emission profileA F1 signal to be subtracted from F2B F2 signal to be subtracted from F1Figures – D. Chambers, Salk Institute for Biological Studies
THINGS TO REMEMBER ABOUT COMPENSATION1. F3 volts F2 volts F1 volts2. Less is better!!! Try to use a brighter reagent at the longer wavelength.3. “too much” compensation will distort the fluorescence profiles. This meansanything over about 10%. Even this is “too much” .best data when valuessubtracted are less than 5%.4. When values subtracted are small ( 1%), errors can be greater, but harder to see.5. The background of the negative cells in your sample may not be the same asthe stained cells check a totally unstained sample.6. The background of a subpopulation can be very different than the total cell background.7. Compensation REQUIRES using single stained cells rather than a tube of cellsstained for multiple reagents.8. Set compensation using the “brightest” reagent for each color, but check singlecolor controls for the “dullest”.
COMPENSATION CONTROLS1.Proper compensation controls MUST be used !The “right” negative compensation control is UNSTAINED cellsThe “right” positive compensation control is the Brightest reagentfor each color stained ALONE.2.Compensation Data MUST be collected !3.Controls should include negatives for EACH color !4.If there is NO compensation data and/or there are not enoughcontrols, the expt cannot be interpreted!
Compensation? Before or After Data Collection ?In a perfect world, could be done after data collection .newest digital instruments storeall data Uncompensated.HOWEVER, if compensation is NOT performed prior to data collection, the followingproblems may arise:a.Detector Voltage selections chosen may make compensation sub-optimal or impossible.b.Results will not be known until after data analysis .c.Technical problems, such as failure of a reagent to stain, will NOT be known untilafter data analysis. Prior compensation will allow the chance to recover the experiment(by restaining).
DOUBLETS ARE TROUBLE !MEASURED SIGNALINTENSITYLASER EXCITATIONDoublets lead to artifacts in measurements:eg. the “green” cell erroneously appears to be “red”.These artifacts lead to contamination in analysisand sorting.Doublets can be caused by inherent cell adhesionand/or by cross-linking of cells by staining reagents.Remember that antibodies are bivalent and that eachavidin molecule can bind 4 biotin molecules.
DOUBLET DISCRIMINATION – PULSE PROCESSINGMEASURED SIGNALINTENSITYLASER EXCITATIONPULSE HEIGHTINTENSITYPULSE WIDTHTIME
DOUBLET DISCRIMINATIONPulse width analysis can be used to exclude “most” doublets.In practice, we use Forward Scatter width this is NOTavailable on the FACSCalibur.
TOP TEN MISTAKESINSTRUMENT SETUP AND DATA COLLECTION1.2.3.4.5.6.7.8.9.10.Setting voltage too LOW on one or more detectors.Setting voltage too HI on one or more detectors.Setting voltage imbalance between detectors.Errors in setting compensationFailure to collect and save compensated data on comp controlsUsing the wrong compensation controlsBelieving that software compensation always worksCollecting data on too few cellsFailure to perform doublet discriminationFailure to clean instrument before AND after experiment
Data AnalysisISSUES:Is this a valid experiment ?What is the question ?What is the control ?How should gates be applied ?
TOP 10 MISTAKES IN DATA ANALYSIS1.Gating IN too much2.Gating OUT too much3.NEVER looking at single-parameter histograms4.Using the WRONG negative control5.Losing peak structure by relying only on dot plots6.Using the WRONG gate! Look at the singles!7.NOT using ANY negative control8.Calculating frequency when intensity is what you really want to compare9.Trying to analyze a rare ( 1%) population with only one gate10. Forgetting to ask, “WHAT IS THE QUESTION?”
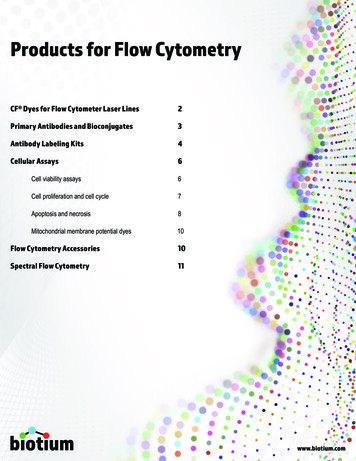
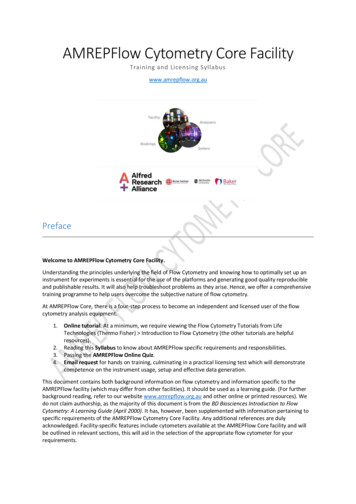
GATING: Where are the cells ?Gate using Dot PlotGate using FLS 00.0050101102FSC 11021031040100101102103104
Lessons:1.Gating using dot plots can be dangerous !2.Gating is a subjective process that makes assumptions.These assumptions can be wrong.
TOP 10 MISTAKES IN DATA ANALYSIS1.Gating IN too much2.Gating OUT too much3.NEVER looking at single-parameter histograms4.Using the WRONG negative control5.Losing peak structure by relying only on dot plots6.Using the WRONG gate! Look at the singles!7.NOT using ANY negative control8.Calculating frequency when intensity is what you really want to compare9.Trying to analyze a rare ( 1%) population with only one gate10. Forgetting to ask, “WHAT IS THE QUESTION?”
Experimental DesignAndSample PreparationOther Resources:Flow Cytometric Analysisand/orSortinghttp://cyto.purdue.eduAb Manufacturer WebsitesBD Biosciences, especially Spectrum ViewereBiosciencesBiolegendCOMMENTARYInterpreting flow cytometry data: a guide for the perplexedLeonore A Herzenberg, James Tung, Wayne A Moore, Leonard A Herzenberg & David R ParksNature Immunology 7, 681-685 (2006)Data Analysis
Introduction to Flow Cytometry Mouse 101 CCR Mouse Research Models Susan Sharrow May 22, 2012 . . Flow Cytometric Analysis and/or Sorting Other Resources: . Biolegend COMMENTARY Interpreting flow cytometry data: a guide for the perplexed Leonore A Herzenberg, James Tung, Wayne A Moore, Leonard A Herzenberg & David R Parks Nature Immunology .