Transcription
AMREPFlow Cytometry Core FacilityTraining and Licensing Syllabuswww.amrepflow.org.auPrefaceWelcome to AMREPFlow Cytometry Core Facility.Understanding the principles underlying the field of Flow Cytometry and knowing how to optimally set up aninstrument for experiments is essential for the use of the platforms and generating good quality reproducibleand publishable results. It will also help troubleshoot problems as they arise. Hence, we offer a comprehensivetraining programme to help users overcome the subjective nature of flow cytometry.At AMREPFlow Core, there is a four-step process to become an independent and licensed user of the flowcytometry analysis equipment.1.2.3.4.Online tutorial. At a minimum, we require viewing the Flow Cytometry Tutorials from LifeTechnologies (Thermo Fisher) Introduction to Flow Cytometry (the other tutorials are helpfulresources).Reading this Syllabus to know about AMREPFlow specific requirements and responsibilities.Passing the AMREPFlow Online Quiz.Email request for hands on training, culminating in a practical licensing test which will demonstratecompetence on the instrument usage, setup and effective data generation.This document contains both background information on flow cytometry and information specific to theAMREPFlow facility (which may differ from other facilities). It should be used as a learning guide. (For furtherbackground reading, refer to our website www.amrepflow.org.au and other online or printed resources). Wedo not claim authorship, as the majority of this document is from the BD Biosciences Introduction to FlowCytometry: A Learning Guide (April 2000). It has, however, been supplemented with information pertaining tospecific requirements of the AMREPFlow Cytometry Core Facility. Any additional references are dulyacknowledged. Facility-specific features include cytometers available at the AMREPFlow Core facility and willbe outlined in relevant sections, this will aid in the selection of the appropriate flow cytometer for yourrequirements.
Reading this material and participating in a small number of online tutorials will be sufficient for answering thequestions in the next stage of your training. This education will enhance your hands-on training experience andyour operation of the flow cytometers available at AMREPFlow (or any other location globally).Please review this syllabus and answer the online quiz questions before you request training.ONLY INITIATE PRACTICAL TRAINING IF YOU ARE PLANNING ON STARTING EXPERIMENTS WITHIN A MONTH.WE DO NOT CONDUCT GENERIC TRAINING. YOU SHOULD BE ABLE TO CONCLUDE YOUR TRAININGPROGRAMME WITHIN 1-4 WEEKS (DEPENDING ON PREVIOUS EXPERIENCE). ANY TRAINING SESSIONS THATEXTEND BEYOND 4 WEEKS DUE TO CLIENT NON-COMPLIANCE OR LACK OF FOLLOW UP, WILL BETERMINATED, RESULTING IN THE CLIENT BEING NON LICENSED, AND NOT ABLE TO UTILISE OURINSTRUMENTS.If you are planning on using and performing regular immunophenotyping on primary human samples on any ofthe AMREPFlow instruments, the sample MUST be fixed. (Fixation protocol SOP’s - www.amrepflow.org.au)If you require to run and analyse primary human samples that are NOT FIXED for functional/kinetic etc. studies,you MUST submit a Risk Assessment Document and Safe Work Instruction (SWI) to AMREPFlow, as the studywill have to be approved by the AMREPFlow OHS Committee.Thank you for your cooperation and for making our/your working environment safer.
Table of ContentsPreface . 1Document Revision History . 41Introduction to Flow Cytometry . 52The Fluidics System . 73The Optics System . 10456783.1Light scatter . 103.2Fluorescence: absorption and emission of light energy . 113.3Fluorescent-labelled antibodies. 143.4Optical bench . 143.5Optical filters . 153.6Signal detection . 163.7Threshold. 173.8Separating emitted light of different wavelengths – compensation . 183.9Four Golden Rules for good compensation. . 19The Electronic System & Data Analysis . 214.1Data collection and display . 214.2Identifying subpopulations of interest within data sets: Gating . 224.3Data analysis . 22Designing an experiment . 255.1Selecting fluorochrome combinations . 255.2Controls . 265.3Further considerations when choosing antibody-fluorochrome combinations. 275.4Power analysis and sample size . 28Sorting Clients (FACS – Fluorescence Activated Cells Sorting) . 296.1Sheath fluid. 296.2Cell recovery and viability. 296.3Thresholding . 29Cell Preparation. 297.1Tissue preparation . 297.2OMIPS (Optimised Multicolour Immunofluorescence Panels) . 297.3Antibody staining . 307.4Antibody Titration . 307.5MIFlowCyt. 317.6Authorship & Acknowledgements . 31Applications for flow cytometry & key considerations – clinical and research . 328.1Clinical applications for flow cytometry & key considerations . 328.2Research (analytical) applications for flow cytometry & key considerations . 32
9AMREPFlow Website . 349.1Navigating the AMREPFlow website . 34Document Revision HistoryDatePre 201720200513Author InitialsGPGP, EOO, MC, SLComment/sRevised, new sections, OHS info andreformatDate Approved and Sign
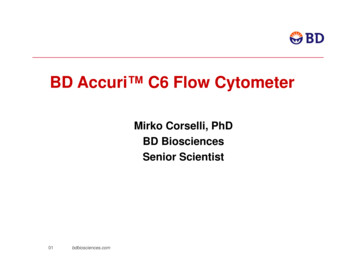
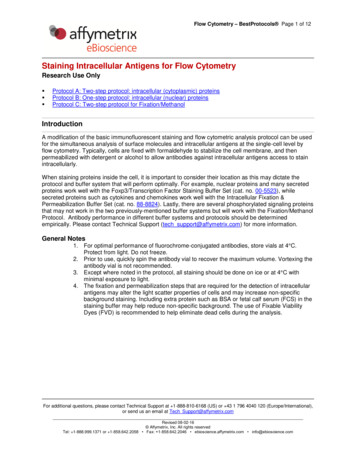
1 Introduction to Flow CytometryFlow cytometry is a technology that simultaneously measures and analyses multiple physical characteristics ofsingle particles (usually cells) as they flow in a fluid stream in single file through a focused light source (usuallyLASER/s). The measured properties include a particle’s relative size and granularity (or internal complexity),inherent fluorescence of the particles (autofluorescence) as well as the fluorescence associated with thefluorophore combinations in the experimental panel. These characteristics about a particle are determinedusing an optical-to-electronic system that records how the particle scatters incident laser light and emitsfluorescence.A flow cytometer is made up of three main systems: fluidics, optics and electronics. The Fluidics system transports and hydrodynamically focuses single particles/cells in a stream to theLASER/s beam for interrogationThe Optics system consists of (a) LASER/s to illuminate the particles in the sample stream and excitethe present fluorophores (b) optical filters that filter and route the photons. Filtered photons (lightand fluorescence) are directed to detectors. These detectors (photomultiplier tubes, PMTs) collect andamplify the signals.The Electronic system converts the amplified signals from photons to photoelectrons, resulting in anelectronic pulse that can be processed and quantitated by a computer. For some instrumentsequipped with a sorting feature, the electronic system is also capable of initiating sorting decisions tocharge and deflect droplets of sample stream containing particles/cells of interest into collection tubesfor downstream applications.In a flow cytometer, particles/cells are carried and hydrodynamically focused in a fluid stream to the LASERintercept point for interrogation. Any single suspended particle or cell generally between 0.2 μm - 80 μm in sizeis suitable for analysis. Cells from solid tissues must be disaggregated and prepared into a single cell suspensionbefore analysis.At AMREPFlow it is a requirement that all samples be filtered through a 70 μm cell strainer prior toacquisition.The portion of the fluid stream where particles are located is called the sample core. When particles/cells passthrough the LASER intercept point, they scatter LASER light, which is measured in the forward (forward scatter,FSC) and side directions (side scatter, SSC). Any fluorescent molecules present on the particle/cell that havepotential to fluoresce once excited by the appropriate LASER wavelength, will absorb light at one wavelengthand emit at a longer wavelength. The scattered and fluorescent light is filtered and directed by appropriatelypositioned lenses and optical filters to appropriate detectors (usually Photomultiplier Tubes, PMTs). Thedetectors (PMTs) convert the filtered light from photons to photoelectrons, which become electronic signals(pulses) that are proportional to the incoming optical signals.List mode data is a data file where each particle or event is listed sequentially, parameter by parameter. Thecharacteristics (or parameters) of each particle are based on its light scattering and fluorescent properties. Thedata are collected and stored in the computer. This data can be analysed to provide information aboutsubpopulations within the sample.
Figure 1-1: Overview of a conventional cytometer.
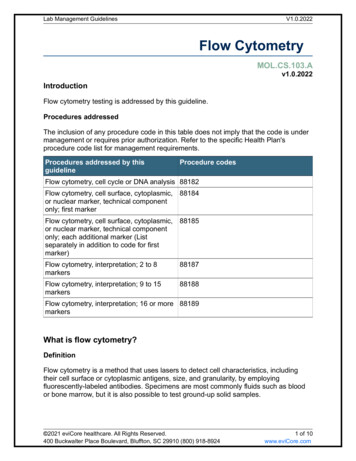
2 The Fluidics SystemThe purpose of the fluidics system is to transport and hydrodynamically focus particles/cells in a fluid stream,to the LASER intercept point for interrogation. For optimal illumination, the core stream transporting theparticles/cells should be aligned in the centre of the LASER beam and only one particle should move though theLASER beams at any given moment.To accomplish this, the sample is injected into a stream of sheath fluid within the flow chamber. The flowchamber on a benchtop flow cytometer is called a flow cell.Note: At AMREPFlow Core we have a sorting platform, called the Influx, that is a stream-in-air cytometer andthe flow chamber is called a nozzle.The design of the flow chamber and inherent pressure/velocity differences between the sheath fluid andsample, establish a laminar flow environment creating a central core stream, which is hydrodynamicallyfocused in the centre of the sheath fluid. This provides the LASER beam to optimally intercept particles/cells atthe interrogation point. Based on fluid dynamic principles relating to laminar flow (at low velocity, fluid flowingin parallel layers will flow without lateral mixing), the sample core remains separate but coaxial within thesheath fluid. The flow of sheath fluid accelerates the particles/cells and restricts them to the centre of thesample core. This process is known as hydrodynamic focusing (Figure 2-1).Figure 2-1: Diagram of the Fluidics system in a cytometer. A) Transverse section of a flow cell, highlighting thesample core stream; B) Hydrodynamic focusing of sample and its delivery to the interrogation point through aflow cell.Important: With the exception of sorting platforms which use 0.9% saline solution as sheath fluid, all analysersat AMREPFlow use double distilled H 2O (dd H2O) as sheath fluid. There is no mixing of cells with sheath untilafter the analysis interrogation point with the LASER/s (as described above), therefore the ddH2O does notaffect cell sample preparations. Take care that sheath does not drip into your cell sample tubes at the time ofacquisition.Only use the double distilled H2O tanks provided in each lab to fill the sheath containers (never use tapwater).Please see an AMREPFlow staff member if you want to use your own sheath as there are additionalrequirements you need to be aware of.
The sample and sheath fluid pressure are always different, with the sample pressure always exceeding thesheath fluid pressure. A sample pressure regulator controls the sample flowrate by changing the samplepressure relative to the sheath pressure.Most of our analysers are BD benchtop analysers where the sample stream is pressurised upward, through anoptically clear region of the flow cell or cuvette: particles pass through the LASER beam while they are stillwithin this flow cell. At AMREPFlow the BD Calibur and Canto-II flow cytometers have fixed sample pressuresettings (LO, MED, HI). The LSR-II, Fortessa and X20 additionally have a “fine adjustment dial” for intermediatesettings (10 full rotations). We are also equipped with a CytoFlex analysis platform, which delivers a knownvolume of sample via a peristaltic pump. This allows researchers simultaneous measurement of absolutecounts for cell populations.Figure 2-2: Describing the effect of sample pressure on flow rate and core stream size. Low flow rate lowsample pressure and narrow sample core stream (Cells pass beam in a single file resulting in highest resolutionof signals). High flow rate high sample pressure and wider sample core stream ( 1 cell passes the beamresulting in lower signal resolution).Increasing the sample pressure increases the flowrate by increasing the width of the sample core, allowingmore cells to enter the stream within a given moment (Figure 2-2). However, with a wider sample core, somecells could pass off-centre and intercept the laser beam at a less optimal angle (decreasing optimal resolutionof data). However, this trade-off might be appropriate for your application. A higher flowrate is generally acceptable for qualitative measurements such as immunophenotyping.The data is less well resolved, because cells are less in line in the wider core stream but are acquiredmore quickly. At AMREPFlow we encourage our clients to not exceed 5000 events/second. (Note: thisalso decreases the chance of blocking the instrument.)A lower flowrate decreases the width of the sample core and restricts the position of the cells to asmaller area. Majority of cells will pass through the centre of the laser beam: the light illuminating theparticles and fluorescence emitted from the particles will be optimal and uniform. A lower flowrate isgenerally used in applications where greater sensitivity is critical, such as DNA analysis.Cells should be prepared at a concentration of 1x10⁶ cells/mL for acquisition on the analysers whichshould allow 5000event/second acquisition at a low flow rate. (This is a guide and will vary dependingon sample preparation and type).Important: Proper operation of the fluidics compartment is critical for particles to properly intercept the laserbeam. Almost all troubleshooting relates back to the fluidics compartment, therefore, the operator mustalways ensure that the fluidics system is free of air bubbles and debris and is always properly pressurized.
After opening sheath thanks, you have introduced air into the system, therefore once closed and the system isre-pressurised, prime and bleed all bubble trap filters and ensure all bubbles are removed from the fluidic andwaste lines by running ddH2O for a few minutes.
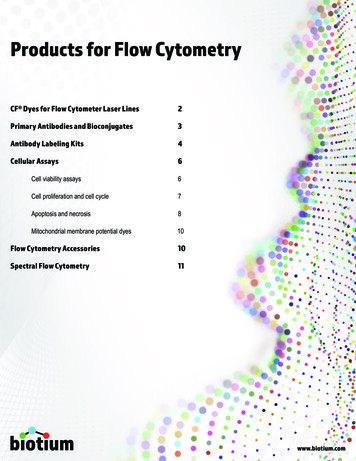
3 The Optics SystemThis section will look at what happens to the particles that have been aligned by the fluidics system to pass in asingle file through the sample core to be interrogated by LASER beams. The subsequent detection andprocessing of these light signals are key to understanding how the flow cytometer identifies events.3.1 Light scatterLight scatters when a particle deflects incident LASER light. The extent to which this happens depends on thephysical characteristics of the particle, mainly its size and internal complexity. Factors that affect total lightscattering are the cell’s membrane, nucleus, interior granular content, cell shape and surface topography.Forward-scattered light (FSC) is approximately proportional to cell-surface area or size. FSC is a measurementof mostly diffracted light and is detected just off the axis of the incident LASER beam in the forward directionby a photodiode (Figure 3-1). FSC provides a suitable method of detecting particles greater than a given size(threshold), independent of their fluorescence and is therefore often used in immunophenotyping experimentsto trigger an event for further signal processing. Events smaller than a specified threshold are ignored, thoughthey still go through the instrument.Side-scatter light (SSC) is approximately proportional to cell granularity or internal complexity. SSC is ameasurement of mostly refracted and reflected light that occurs at any interface within the cell where there isa change in refractive index (Figure 3-1). SSC is collected at approximately 90 degrees to the LASER beam by acollection lens and then redirected by a beam splitter to the appropriate detector.Figure 3-1: Diffraction and refraction of incident laser light in cells results in unique light scattering properties.Correlated measurements of FSC and SSC can allow for differentiation of cell types in a heterogeneous cellpopulation. Major leukocyte subpopulations in whole blood can be differentiated using FSC and SSC (Figure 32).
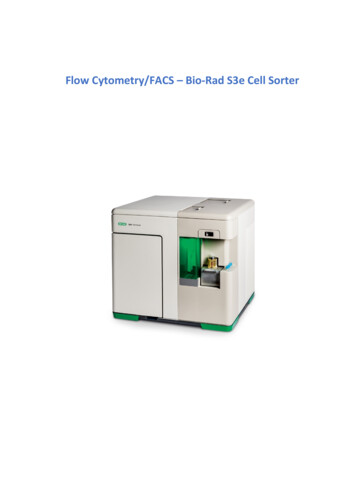
Figure 3-2: Identification of cell subpopulations in lysed whole blood based on FSC and SSC (Calibur data).Note: FSC and SSC can also give you an idea of the health (viability) of a sample preparation. Dead and dyingcells exhibit altered FSC and SSC profiles and can introduce artefacts when not sufficiently accounted for(including non-specific staining).3.2 Fluorescence: absorption and emission of light energyA molecule that has the potential to fluoresce absorbs light energy at a specific wavelength. The electrons inthe molecule are transiently excited and then quickly decay back to their ground (unexcited) state, emitting thisabsorbed energy as photons of light (Figure 3-3). This transition of energy is called fluorescence. The wavelength range a fluorochrome absorbs light (becomes excited): Excitation spectraThe wavelength range a fluorochrome of the emitted light: Emission spectraEmission is always greater than Excitation wavelengths, the difference called Stoke’s Shift.Figure 3-3: A) Schematic of the excitation and return to ground state of an electron in a fluorescent molecule, B)The measured difference between Excitation (Absorption) and Emission Maxima is the Stoke's Shift.
The range over which a fluorescent compound can be excited is termed its absorption spectrum. Uponabsorption, some energy is lost as kinetic/thermal energy and the emitted wavelengths will be longer (lessenergy) than those absorbed (shorter wavelengths are higher energy). The range of emitted wavelengths for aparticular compound is termed its emission spectrum.This means that for each given fluorophore, the emission intensity is dependent on how closely the laserwavelength is to the fluorophore’s excitation maximum. As a result of this, the emission intensity isproportional to the amplitude of the excitation wavelength.The argon ion laser is commonly used in flow cytometry because the 488 nm light that it emits excites morethan one fluorochrome. A very common fluorochrome is fluorescein isothiocyanate (FITC). In the absorptionspectrum of FITC, the 488 nm light is close to the FITC absorption maximum (Figure 3-4). Excitation with thiswavelength will result in high FITC emission. If this fluorochrome were excited by another wavelength (nonoptimally) within its absorption spectrum, light emission from FITC would still occur albeit less optimally and beof a lower intensity.Figure 3-4: Excitation and emission spectral profiles of FITC. (Fluorescence Spectral Viewer, Life Technologies).More than one fluorochrome can be used simultaneously if each is excited at a specified wavelength and ifthe peak emission wavelengths are not extremely close to each other.As an example, the combination of FITC with phycoerythrin (PE), another common fluorochrome, satisfiesthese criteria. The emission spectrum of FITC and PE is shown (Figure 3-5).Figure 3-5: Spectral profiles of FITC and PE fluorochromes. Note their separate emission peaks. (FluorescenceSpectra Viewer, Life Technologies).
Note: Specific to Calibur and Canto-II analysers, although the absorption maximum of PE is not near 488 nm,the fluorochrome is excited enough at this wavelength to provide adequate fluorescence emission fordetection. The LSR-II and Fortessa analysers are equipped with a 561 nm yellow-green laser which aligns betterwith the excitation maximum of PE leading to more optimally excitation of the PE fluorochrome (Figure 3-6).Figure 3-6: Fluorescence spectra of FITC and PE; highlighting the alternate optimal excitation of PE using a561 nm laser.More importantly, the peak emission wavelength is 530 nm for FITC and 570 nm for PE. These peak emissionwavelengths are far enough apart such that each signal can be detected by a separate detector (Figure 3-7).The intensity of fluorescent signal detected is proportional to the number of fluorochrome molecules presenton the particle.Figure 3-7: Fluorescence spectra of FITC and PE with emission detection filters indicated by the broad verticalbands.
Figure 3-8: Excitation and emission spectra of four common fluorochromes; FITC, PE, PerCPCy5.5 and APC, asanalysed on a two-laser system.3.3 Fluorescent-labelled antibodiesWhen a fluorescent dye is conjugated to a monoclonal antibody, it can be used to identify a particular cell typebased on the individual antigenic surface (or intracellular) markers of the cell (Figure 3-9). In a mixedpopulation of cells, different fluorochromes can be used to distinguish separate subpopulations. The stainingpattern of each subpopulation, combined with FSC and SSC data, can be used to identify which cells are presentin a sample and to count their relative percentages. (These subpopulations can also be isolated on the sortingplatforms available at AMREPFlow).Figure 3-9: Identification of cells by labelling using fluorescently-conjugated antibody specific to surfaceantigens.3.4 Optical benchThe optical system consists of excitation optics and collection optics. The excitation optics consists of the lasersand lenses that are used to shape and focus the LASER beam/s. The collection optics consist of a collection lensto collect light emitted from the particle-laser beam interaction and a system of optical mirrors and filters toroute specified wavelengths of the collected light to designated optical detectors. The design of the opticalbench allows for these functions to occur.The optical bench in a flow cytometer provides a stable surface that holds the excitation light source andcollection optics in fixed positions. The alignment of a benchtop analyser is very stable because the flow cell isfixed in its alignment with the LASER beam/s and ensures that the laser intercepts the sample streamconsistently from day to day. The optical bench for the BD Calibur is shown (Figure 3-10).
Figure 3-10: Diagram of the BD Calibur optical bench indicating important components of the Optical osis.html?lang en)3.5 Optical filtersIn the flow cytometer the fluorescent signals are collected by photomultiplier tubes (PMTs). To optimise thesesignals specific to a wavelength range, filters are placed in front of the PMT allowing only a narrow wavelengthrange to reach the detector.Once a particle passes through the LASER light, FSC signals are collected by a photodiode but SSC and emittedfluorescence signals are diverted to photomultiplier tubes (PMTs). All the signals are routed to their detectorsvia a system of mirrors and optical filters. The specificity of a detector for a particular fluorescent dye isoptimised by placing a filter in front of the PMT, which allows only a narrow range of wavelengths to reach thedetector. This spectral band of light is close to the emission peak of the fluorescent dye. Such filters are calledbandpass (BP) filters. For example, the filter used in front of the FITC detector is labelled 530/30. This numberidentifies the characteristics of the spectral band that is transmitted: 530 15 nm (wavelengths between 515nm and 545 nm; the band being 30 nm wide in total, and 530 nm being the central point, hence the 530/30Bandpass filter).Other filters used in flow cytometry are shortpass (SP) filters, which transmit wavelengths of light equal to orshorter than a specified wavelength, and longpass (LP) filters, which transmit wavelengths of light equal to orlonger than a specified wavelength (Figure 3-11).Beam splitters are devices that direct light of different wavelengths in different directions. Dichroic mirrors area type of beam splitter.
Figure 3-11: Light transmission through longpass (LP), shortpass (SP), and 500/50 bandpass filter respectively.3.6 Signal detectionLight signals are generated as particles pass through the LASER beam in the fluid stream. These light signals asphotons, are detected by photodetectors and converted to electronic signals or electronic pulses(photoelectrons) and then assigned a channel number on a data plot based on the pulse properties (usuallyPulse Height, but there are other pulse properties such as Pulse Area and Pulse Width). There are two types ofphotodetectors in flow cytometers: photodiodes and photomultiplier tubes. The photodiode is less sensitive tolight signals than the PMTs and thus is used to detect the stronger FSC signal. Because greater sensitivity isrequired, PMTs are used to detect the weaker signals generated by SSC and fluorescence.A voltage pulse is created when a particle enters the laser beam and starts to scatter light or fluoresce. Oncethe light signals (or photons) strike one side of the PMT or photodiode, they are converted into a proportionalnumber of electrons (photoelectrons) that are multiplied, creating a greater electrical current. The electricalcurrent travels to the amplifier and is converted to a voltage pulse. PMT sensitivity or degree of amplification isadjusted via voltage ranges within the cytometer software, controlling data acquisition, as described below.The highest point of the pulse occurs when the particle is in the centre of the beam and the maximum amountof scatter or fluorescence is achieved. As the particle leaves the beam, the pulse comes back down to thebaseline (Figure 3-12).
Figure 3-12: Generation of a voltage pulse. A voltage pulse is created when a particle enters the laser beam andstarts to scatter incident light or fluoresce. Particle enters from the bottom in this example.The size of the voltage pulse depends on the number of photons detected, the PMT voltage is a pre-amplifiergain, and the amplifier gain. Signals can be amplified by applying a voltage to the PMTs, thus creating a greaterelectrical current, or by increasing the amplification gain. Amplifier settings in modern digital instruments aremostly linear, but historically were linear or logarithm
At AMREPFlow Core, there is a four-step process to become an independent and licensed user of the flow cytometry analysis equipment. 1. Online tutorial. At a minimum, we require viewing the Flow Cytometry Tutorials from Life Technologies (Thermo Fisher) Introduction to Flow Cytometry (the other tutorials are helpful resources). 2.