Transcription
Chapter 9: Phase DiagramsISSUES TO ADDRESS. When we combine two elements.what equilibrium state do we get? In particular, if we specify.--a composition (e.g., wt% Cu - wt% Ni), and--a temperature (T )then.How many phases do we get?What is the composition of each phase?How much of each phase do we get?Phase BPhase ANickel atomCopper atomChapter 9 - 1
Phase Equilibria: Solubility LimitIntroduction– Solutions – solid solutions, single phase– Mixtures – more than one phaseAdapted from Fig. 9.1,Callister 7e.Sucrose/Water Phase Diagram Solubility Limit:Question: What is thesolubility limit at 20 C?Answer: 65 wt% sugar.Temperature ( C)Max concentration forwhich only a single phasesolution occurs.100SolubilityLimit80L(liquid)60L40(liquid solutioni.e., syrup)20 S(solidsugar)PureWaterPureSugarIf Co 65 wt% sugar: syrup020406065 80100If Co 65 wt% sugar: syrup sugar.Co Composition (wt% sugar)Chapter 9 - 2
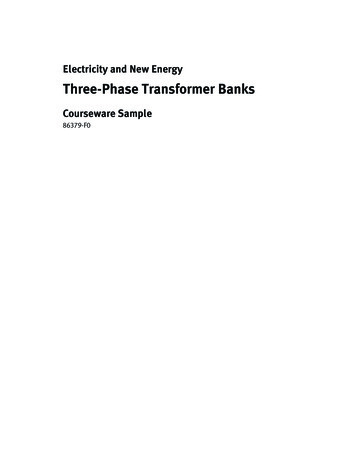
Components and Phases Components:The elements or compounds which are present in the mixture(e.g., Al and Cu) Phases:The physically and chemically distinct material regionsthat result (e.g., α and β).AluminumCopperAlloyβ (lighterphase)α (darkerphase)Adapted fromchapter-openingphotograph,Chapter 9,Callister 3e.A phase maybe defined as a homogeneous portion of a system that hasChapter 9 - 3uniform physical and chemical characteristics.
Effect of T & Composition (Co) Changing T can change # of phases: path A to B. Changing Co can change # of phases: path B to D.B (100 C,70) D (100 C,90)1 phasewatersugarsystemAdapted fromFig. 9.1,Callister 7e.Temperature ( C)1002 phasesL80(liquid)60L(liquid solution40i.e., syrup) S(solidsugar)A (20 C,70)202 phases00204060 70 80100Co Composition (wt% sugar)Chapter 9 - 4
Phase EquilibriumEquilibrium: minimum energy state for a given T, P, and composition(i.e. equilibrium state will persist indefinitely for a fixed T, P andcomposition).Phase Equilibrium: If there is more than 1 phase present, phasecharacteristics will stay constant over time.Phase diagrams tell us about equilibrium phases as a function of T,P and composition (here, we’ll always keep P constant for simplicity).Chapter 9 - 5
Unary SystemsTriple pointChapter 9 - 6
Phase EquilibriaSimple solution system (e.g., Ni-Cu solution)CrystalStructureelectronegr (nm)NiFCC1.90.1246CuFCC1.80.1278 Both have the same crystal structure (FCC) and havesimilar electronegativities and atomic radii (W. Hume –Rothery rules) suggesting high mutual solubility. Ni and Cu are totally miscible in all proportions.Chapter 9 - 7
Unary SystemsSingle component systemConsider 2 metals:Cu has melting T 1085oCNi has melting T 1453oC(at standard P 1 r 9 - 8What happens when Cu and Ni are mixed?
Binary Isomorphous Systems2 componentsComplete liquid and solid solubilityExpect Tm of solution to lie in between Tm of two pure componentsTTliquidliquidL1453oC1085oCsolid0CuSwt% Nisolid100NiFor a purecomponent,complete meltingoccurs before Tincreases (sharpphase transition).But formulticomponentsystems, there isusually acoexistence of Land S.Chapter 9 - 9
Phase Diagrams Indicate phases as function of T, Co, and P. For this course:-binary systems: just 2 components.-independent variables: T and Co (P 1 atm is almost always used).T( C) PhaseDiagramfor Cu-Nisystem 2 phases:16001500L (liquid)α (FCC solid solution)L (liquid)1400liq1300L αuslidso1200α(FCC solidsolution)11001000usdiu020406080 3 phase fields:LL ααAdapted from Fig. 9.3(a), Callister 7e.(Fig. 9.3(a) is adapted from PhaseDiagrams of Binary Nickel Alloys, P. Nash(Ed.), ASM International, Materials Park,OH (1991).100wt% NiChapter 9 - 10
Phase Diagrams:# and types of phases Rule 1: If we know T and Co, then we know:--the # and types of phases present.A(1100 C, 60):1 phase: αB(1250 C, 35):2 phases: L α1600L (liquid)1500B (1250 C,35) Examples:T( C)14001300solution)11001000 α αL (FCC solid1200Adapted from Fig. 9.3(a), Callister 7e.(Fig. 9.3(a) is adapted from PhaseDiagrams of Binary Nickel Alloys, P. Nash(Ed.), ASM International, Materials Park,OH, 1991).Cu-NiphasediagramsuduiliqusdilsoA(1100 C,60)020406080100wt% NiChapter 9 - 11
Phase Diagrams:composition of phases Rule 2: If we know T and Co, then we know:--the composition of each phase. Examples:T( C)Cu-NisystemATACo 35 wt% Nitie line dusuiqil1300 L (liquid)At T A 1320 C: αLOnly Liquid (L)BsidulToBsCL Co ( 35 wt% Ni)ααAt T D 1190 C:L (solid)1200DOnly Solid ( α)TDCα Co ( 35 wt% Ni)203032 35 404350At T B 1250 C:CLCoCα wt% NiBoth α and LAdapted from Fig. 9.3(b), Callister 7e.9.3(b) is adapted from Phase DiagramsCL C liquidus ( 32 wt% Ni here) (Fig.of Binary Nickel Alloys, P. Nash (Ed.), ASMCα C solidus ( 43 wt% Ni here) International, Materials Park, OH, 1991.)Chapter 9 - 12
Determining phase compositionin 2-phase region:1. Draw the tie line.2. Note where the tie line intersectsthe liquidus and solidus lines (i.e.where the tie line crosses thephase boundaries).3. Read off the composition at theboundaries:Liquid is composed of CL amountof Ni (31.5 wt% Ni).Solid is composed of Cα amount ofNi (42.5 wt% Ni).Chapter 9 - 13
Phase Diagrams:weight fractions of phases Rule 3: If we know T and Co, then we know:--the amount of each phase (given in wt%). Examples:Co 35 wt% NiAt T A : Only Liquid (L)W L 100 wt%, W α 0At T D: Only Solid ( α)W L 0, Wα 100 wt%At T B : Both α and LWL Wα 43 35S 73 wt %R S 43 32R 27 wt%R SCu-NisystemT( C)ATAL (liquid)1300tie line dusil i quBR STBL1200TD20 αD3032 35CLCoα Lids olusα(solid)40 4350Cα wt% NiAdapted from Fig. 9.3(b), Callister 7e.(Fig. 9.3(b) is adapted from Phase Diagrams ofBinary Nickel Alloys, P. Nash (Ed.), ASMInternational, Materials Park, OH, 1991.)Chapter 9 - 14
Lever Rule: DerivationSince we have only 2 phases:WL Wα 1(1)Conservation of mass requires that:Amount of Ni in α-phase amount of Ni in liquid phase total amount of Nior(2)Wα Cα WL C L CoFrom 1st condition, we have:Sub-in to (2):Wα 1 WL(1 WL )Cα WL C L CoSolving for WL and Wα gives :WL Cα CoCα C LWα Co C LCα C LChapter 9 - 15
The Lever Rule Tie line – connects the phases in equilibrium witheach other - essentially an isothermT( C)1300tie line dusil i quL (liquid)1200Lids olSR30C C40 CαL owt% NiWL usMαMLα(solid) αR20α LBTBHow much of each phase?Think of it as a lever (teeter-totter)50SM α S M L RAdapted from Fig. 9.3(b),Callister 7e.MLSC C0 αM L M α R S C α CLWα RC CL 0R S Cα CLChapter 9 - 16
Ex: Cooling in a Cu-Ni Binary Phase diagram:Cu-Ni system. System is:--binaryi.e., 2 components:Cu and Ni.T( C) L (liquid)130 0L: 35 wt% Niα: 46 wt% Nii.e., completesolubility of onecomponent inanother; α phasefield extends from0 to 100 wt% Ni. ConsiderCo 35 wt%Ni.A32--isomorphousL: 35wt%Ni35BCα4643D241200L Cu-NisystemL: 32 wt% Ni36α Lα: 43 wt% NiEL: 24 wt% Niα: 36 wt% Niα(solid)11002030Adapted from Fig. 9.4,Callister 7e.35Co4050wt% NiChapter 9 - 17
Microstructures in Isomorphous AlloysMicrostructures will vary on the cooling rate (i.e. processing conditions)1. Equilibrium Cooling: Very slow cooling to allow phase equilibrium tobe maintained during the cooling process.a (T 1260oC): start ashomogeneous liquid solution.b (T 1260oC): liquidus linereached. α phase begins tonucleate. Cα 46 wt% Ni; CL 35 wt% Nic (T 1250oC): calculate compositionand mass fraction of each phase.Cα 43 wt% Ni; CL 32 wt% Nid (T 1220oC): solidus line reached.Nearly complete solidification.Cα 35 wt% Ni; CL 24 wt% Nie (T 1220oC): homogeneous solidsolution with 35 wt% Ni.Chapter 9 - 18
Non-equilibrium coolingSince diffusion rate is especially low in solids, consider case where:Cooling rate diffusion rate in solidCooling rate diffusion rate in liquid(equilibrium maintained in liquids phase)Chapter 9 - 19
Non-equilibrium coolinga’ (T 1260oC): start ashomogeneous liquid solution.b’ (T 1260oC): liquidus linereached. α phase begins to nucleate.Cα 46 wt% Ni; CL 35 wt% Nic’ (T 1250oC): solids that formed at pt b’remain with same composition (46wt%) andnew solids with 42 wt% Ni form around theexisting solids (Why around them?).d’ (T 1220oC): solidus line reached. Nearlycomplete solidification. Previously solidified regions maintain originalcomposition and further solidification occurs at 35wt% Ni.e (T 1220oC): Non-equilibrium solidificationcomplete (with phase segregation).Chapter 9 - 20
Cored vs Equilibrium Phases Cα changes as we solidify. Cu-Ni case: First α to solidify has Cα 46 wt% Ni.Last α to solidify has Cα 35 wt% Ni. Fast rate of cooling:Cored structure Slow rate of cooling:Equilibrium structureFirst α to solidify:46 wt% NiLast α to solidify: 35 wt% NiUniform C α:35 wt% NiCored structure can be eliminated by a homogenizationheat treatment at a temperature below the solidus pointChapter 9 - 21for the particular alloy composition.
Mechanical Properties: Cu-Ni System Effect of solid solution strengthening on:--Ductility (%EL,%AR)Tensile Strength (MPa)At RT400TS forpure Ni300TS for pure Cu2000 20 40 60 80 100CuNiComposition, wt% NiAdapted from Fig. 9.6(a), Callister 7e.--Peak as a function of CoElongation (%EL)--Tensile strength (TS)60%EL for pure Cu%EL forpure Ni504030200 20Cu406080 100NiComposition, wt% NiAdapted from Fig. 9.6(b), Callister 7e.--Min. as a function of CoChapter 9 - 22
Binary-Eutectic Systemshas a special compositionwith a min. melting T.2 componentsCu-AgsystemT( C)Ex.: Cu-Ag system1200 3 single phase regionsL (liquid)1000(L, α, β)α L α 779 C Limited solubility:L β β800Tα: mostly Cu8.071.9 91.2Eβ: mostly Ag600 TE : No liquid below TEα β400 CE : Min. melting TEcomposition2000 Eutectic transitionL(CE)α(CαE) β(CβE)204060 CE 80100Co , wt% AgAdapted from Fig. 9.7,Callister 7e.Chapter 9 - 23
Eutectic PointEutectic point: Where 2 liquidus linesmeet (pt. E).Sometimes also referred to as invariantpoint.Eutectic Reaction:coolL(CE)α(CαE) β(CβE)heatsimilar to one component (pure) systemexcept 2 solid phases.Cu-Ag phase diagramEutectic Isotherm: Horizontal solidusline at T TE.Single phase regions: α, β, L-phase2-Phase coexistence regions: α β, α L and β LChapter 9 - 24
EX: Pb-Sn Eutectic System (1) For a 40 wt% Sn-60 wt% Pb alloy at 150 C, find.--the phases present: α βT( C)--compositions of phases:CO 40 wt% SnCα 11 wt% SnCβ 99 wt% Sn--the relative amountof each phase:Wα C - COS βR SCβ - CαPb-Snsystem300200L (liquid)αL α18.31501005999 - 40 67 wt%99 - 1188C - CαWβ R OCβ - CαR SL β β183 C61.9R97.8Sα β 40 - 1129 33 wt%99 - 11880 11 20Cα40Co6080C, wt% Sn99100CβAdapted from Fig. 9.8,Callister 7e.Chapter 9 - 25
EX: Pb-Sn Eutectic System (2) For a 40 wt% Sn-60 wt% Pb alloy at 200 C, find.--the phases present: α LT( C)--compositions of phases:CO 40 wt% SnCα 17 wt% SnCL 46 wt% Sn--the relative amountof each phase:CL - CO46 - 40 Wα CL - Cα46 - 176 21 wt%29Pb-Snsystem300L (liquid)L α220200αRL β βS183 C100CO - Cα23 WL 79 wt%CL - Cα29α β017 20Cα40 46 60Co CL80C, wt% SnAdapted from Fig. 9.8,Callister 7e.Chapter 9 - 26100
Microstructuresin Eutectic Systems: I Co 2 wt% SnT( C)Adapted from Fig. 9.11,Callister 7e.L: Co wt% Sn400Lα1. One component richcomposition.a: start with homogeneous liquid.b: α-phase solids with liquid.Compositions and mass fractionscan be found via tie lines and leverrule.c: α-phase solid solution only.Net result: polycrystalline α solid.Cooling at this composition is similarto binary isomorphous systems.L300α200L α(Pb-SnSystem)α: Co wt% SnTE100α β0Co102030C , wt% Sno2(room T solubility limit)Chapter 9 - 27
Microstructuresin Eutectic Systems: II 2 wt% Sn Co 18.3 wt% SnAdapted from Fig. 9.12,Callister 7e.L: Co wt% SnT( C)400L2. One-component rich but cooling to α β coexistence.d: homogeneous liquid.e: α L phase (same as previous but atdifferent compositions and mass fractions).f: all α-phase solid solution.g: α β phase (passing through solvus lineleads to exceeding solubility limit and βphase precipitates out).Net result: polycrystalline α-solid with fineβ crystals.Lα300L αα: Co wt% Snα200TEαβ100α β01020Pb-Snsystem30CoCo , wt%2(sol. limit at T room )18.3(sol. limit at TE)SnChapter 9 - 28
Microstructuresin Eutectic Systems: III Co CE Result: Eutectic microstructure (lamellar structure)--alternating layers (lamellae) of α and β crystals.T( C)L: Co wt% Sn300Micrograph of Pb-SneutecticmicrostructureLPb-SnsystemL αα200L β β183 CTE100α β02018.3Adapted from Fig. 9.13,Callister 7e.40β: 97.8 wt% Snα: 18.3 wt%Sn60CE61.980160 µmAdapted from Fig. 9.14, Callister 7e.10097.8C, wt% SnChapter 9 - 29
Lamellar Eutectic StructureαβSnαPb richLβSn richPbIn order to achieve largehomogeneous regions, longdiffusion lengths are required.Adapted from Figs. 9.14 & 9.15, Callister7e.Lamellar structure forms becauserelatively short diffusionlengthsChapter 9 - 30are required.
Microstructuresin Eutectic Systems: IV 18.3 wt% Sn Co 61.9 wt% Sn Result: α crystals and a eutectic microstructureL: Co wt% SnT( C)300LαLPb-Snsystemα LL αα200RTEL β βSSRprimary αeutectic αeutectic β02018.3Adapted from Fig. 9.16,Callister 7e.406061.9Cα 18.3 wt% SnCL 61.9 wt% SnSWα 50 wt%R SWL (1- Wα) 50 wt% Just below TE :α β100 Just above TE :80Co, wt% Sn10097.8Cα 18.3 wt% SnCβ 97.8 wt% SnWα S 73 wt%R SWβ 27 wt%Chapter 9 - 31
Hypoeutectic & Hypereutectic(Pb-SnSystem)300LT( C)Adapted from Fig. 9.8,Callister 7e. (Fig. 9.8adapted from Binary PhaseDiagrams, 2nd ed., Vol. 3,T.B. Massalski (Editor-inChief), ASM International,Materials Park, OH, 1990.)α200L αTEα β10002040hypoeutectic: Co 50 wt% Sn(Figs. 9.14 and 9.17from MetalsHandbook, 9th ed.,Vol. 9,Metallography andMicrostructures,American Society forMetals, MaterialsPark, OH, 1985.)αααMicroconstituent: anelement of amicrostructure withidentifiable andL β βcharacteristic structure (atpt. m there are 2microconstituents: primaryα and eutectic structures)6080eutectic61.9100hypereutectic: (illustration only)eutectic: Co 61.9 wt% Snββα αβα175 µmAdapted fromFig. 9.17, Callister 7e.Co, wt% Snβ ββ160 µmeutectic micro-constituentAdapted from Fig. 9.14,Callister 7e.Adapted from Fig. 9.17,Callister 7e. (Illustrationonly)Chapter 9 - 32
Intermediate phasesIntermediate solid solutions (intermediate phases): Solid solutions that donot extend to pure components in the phase diagram.Cu-ZnTerminal solidsolutions: α and η.Intermediate solidsolutions: β, γ, δ and ε.Tie lines and lever rule canbe used to determinecompositions and wt% ofphases.e.g. at 800oC with 70 wt%ZnCL 78 wt% ZnCγ 67 wt% ZnChapter 9 - 33
Intermetallic CompoundsAdapted fromFig. 9.20, Callister 7e.Mg2PbNote: intermetallic compound forms a discrete line - not anarea - because stoichiometry (i.e. composition) is Chapterexact.9 - 34
Eutectoid & Peritectic Eutectic - liquid in equilibrium with two solidsL cool α βheat Eutectoid - solid phase in equation with two solidphasesintermetallic compoundS2S1 S3- cementiteγ cool α Fe3C(727ºC)heat Peritectic - liquid solid 1 solid 2 (Fig 9.21)S1 LS2coolδ L heat γ(1493ºC)Chapter 9 - 35
Eutectoid & PeritecticCu-Zn Phase diagramPeritectic transition γ LAdapted fromFig. 9.21, Callister 7e.Eutectoid transitionδγ εChapter 9 - 36δ
Congruent phase transformationCongruent transformation: no change in composition upon phasetransformation. (for example: allotropic transformation)Incongruent transformation: phase transformation where at least one of thephases go through composition change. (for example: isomorphous, eutectic andeutectoid system)Chapter 9 - 37
Ceramic phase diagramsAl2O3-Cr2O3MgO-Al2O3Chapter 9 - 38
Gibbs Phase RuleA criterion for the number of phases that will coexist within a system at equilibriumNumber of nonNumber ofcompositional variables(Temperature & Pressure)phases presentP F C NDegree of freedom (externally controllableparameters: i.e. T, P, and C)Number ofcomponentse.g. Cu-Ag phase diagramCu and Ag are the only components- C 2Temperature is the only non-compositional variablehere (i.e. fixed pressure).- N 1 (but in general N 2)When 2 phases are present- P 2 which leads to F C N-P 2 1-2 1When only 1 phase is present.- P 1 which leads to F 2What does this mean? Why should you care?Chapter 9 - 39
Gibbs Phase RuleIn the previous example of Cu-Ag phase diagram, when F 1, only oneparameter (T or C) needs to be specified to completely define the system.e.g. (for α L region)If T is specified to be 1000oC,compositions are already determined(Cα and CL).OrIf composition of the a phase isspecified to be Cα then both T and CLare already determined.The nature of the phases is important,not the relative phase amounts.CαCLChapter 9 - 40
Gibbs Phase RuleWhen F 2, both T and C have to be specified to completely define thestate of the system.e.g.(for α region)If T is specified to be 800oC, Cα can beany where between 0 to 8 wt% Ag)OrIf composition of the a phase isspecified to be Cα 3 wt%, then T andcan be any where between 600 to1100oC.CαChapter 9 - 41
Gibbs Phase RuleWhere in the Cu—Ag diagram, is there a 0 degree of freedom?(i.e. T, P, and C are all fixed)---eutectic isothermF 3-P 0Chapter 9 - 42
Concept Check Question: For a ternary system, threecomponents are present; temperature is alsoa variable. What is the maximum number ofphases that may be present for a ternarysystem, assuming that pressure is heldconstant?Chapter 9 - 43
Iron-Carbon Systemstructural materialFerrite MagnetsTVR Tuscan Speed 6, high-performance sportscar with an austempered ductile iron crankshaft.The world's first bridge made of ironin 1779. The entire structure ismade of cast iron. (near Broseley,UK)Chapter 9 - 44
Iron-Carbon SystemSteel bridgesThe Akashi Kaikyo bridge, a 3-span 2hinged truss-stiffened suspension bridge.completed in 1998. It connects Kobe withAwaji Island. It is the world's longestsuspension bridge, with a span betweenthe towers of 1.9 km.Millau Viaduct in France, thehighest bridge in the world.Golden Gate BridgeChapter 9 - 45
Iron-Carbon System Iron-carbon (Fe-C) system is one of the mostimportant binary systems due to the versatile uses ofthe iron-based structural alloys. This phase diagram is so important in understandingthe equilibrium structure, and in the design of heattreatment process of iron alloys. The most important part of the phase diagram is theregion below6.7 w% carbon. All practical iron-carbonalloys contain C below 6.7 w%. This part is of thephase diagram is thus the most analyzed part of theiron carbon phase diagram.Chapter 9 - 46
Iron-Carbon SystemTypical metal (e.g. Cu)TIronT(oC)LiquidLiquid1538TmFerrite (BCC)1394Austenite (FCC)Solid912Ferrite (BCC)Chapter 9 - 47
Iron-Carbon SystemIron-Iron Carbide DiagramChapter 9 - 48
Remarks on Fe-C system C is an interstitial element in Fe matrix. C has limited solid solubility in the alpha BCC phase (narrow region close topure iron). Max solid solubility of C in alpha iron is 0.022 w% at 727 C. Alpha iron an be made magnetic below 768 C. Austenite phase is not stable below at 727 C. Max solid solubility of C intoaustenite is 2.14 w% at 1147 C, much larger that that in alpha phase. Austenite is a non-magnetic phase, and heat treatment of Fe-C alloysinvolving austenite is so important. Cementite phase (intermetallic, Fe3C) forms over a large region of the Fe-Cphase diagram, but it is a metastable phase (heating above 650 C for yearsdecomposes this phase into alpha iron and graphite). Cementite is very hardand brittle. δ ferrite is stable only at relatively high T, it is of no technological importanceand is not discussed further.Chapter 9 - 49
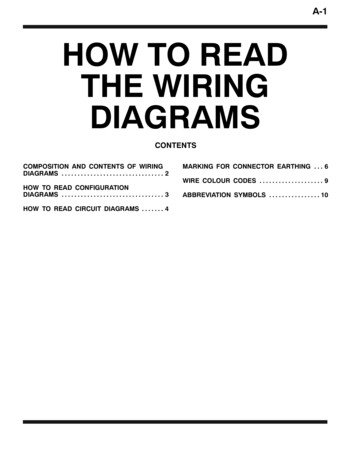
Ferrite (90x)Relatively softDensity: 7.88g/cm3Austenite (x325)Chapter 9 - 50
Classification Scheme of Ferrous Alloys IronPure ion contains less than 0.008wt% C Steel0.008-2.14 wt% C, in practice, 1.0 wt% C Cast Iron2.14-6.70 wt% C, in practice, 4.5 wt% CChapter 9 - 51
Iron-Carbon (Fe-C) Phase DiagramcoolEutectoid cooling:γ (0.76 wt% C)L γ Fe3C-Eutectoid (B):heatT( C)1600δL14001200γ α Fe3Cγ Lγ(austenite)γα 800α120 µmResult: Pearlite alternating layers ofα and Fe3C phases(Adapted from Fig. 9.27, Callister 7e.)γ Fe3C727 C TeutectoidR4000(Fe)SBSα Fe3C10.76C eutectoid600L Fe3CRγ γγ γ1000A1148 C23456Fe3C (cementite) 2 importantpoints-Eutectic (A):α (0.022 wt% C) Fe3C (6.7 wt% C)6.74.30Co, wt% CFe3C (cementite-hard)α (ferrite-soft)Adapted from Fig. 9.24,Callister 7e.Chapter 9 - 52
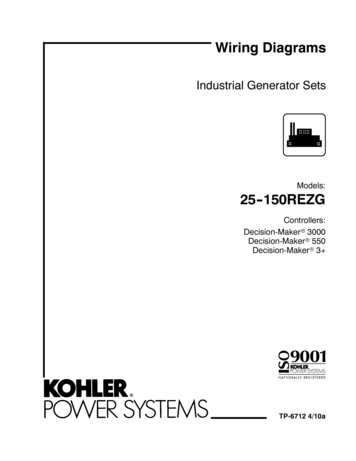
PearlitecoloniesPearl-microscope picture(X500)Mechanically, pearlite has properties intermediate between theChapter 9 soft, ductile ferrite and the hard, brittle cementite.53
Hypoeutectoid SteelT( C)1600δLγ γγ γγ Lγ1200(austenite)γ γγ γ1000αγγαγ αγ800γ Fe3Cr s727 CαRSw α s/(r s) 600w γ (1- wα )4000(Fe)pearliteα Fe3C1C023450.76αL Fe3C1148 C6Co , wt% C100 µmpearliteAdapted from Figs. 9.24and 9.29,Callister 7e.(Fig. 9.24 adapted fromBinary Alloy PhaseDiagrams, 2nd ed., Vol.1, T.B. Massalski (Ed.-inChief), ASM International,Materials Park, OH,1990.)6.7w pearlite w γw α S/(R S)w Fe3C (1-w α )(Fe-CSystem)Fe3C (cementite)1400Hypoeutectoidsteelproeutectoid ferriteAdapted from Fig. 9.30,Callister 7e.Chapter 9 - 54
Hypereutectoid SteelT( C)1600δLγγγ Lγ1200(austenite)γγ1000γ γγ γ800Fe3Cw Fe3C r/(r s)w γ (1-w Fe3C )rα R6004000(Fe)pearliteL Fe3C1148 Cγ Fe3C0.76γγγγ(Fe-CSystem)sSα Fe3C1 Cow pearlite w γw α S/(R S)w Fe3C (1-w α )23456Fe3C (cementite)1400Adapted from Figs. 9.24and 9.32,Callister 7e.(Fig. 9.24 adapted fromBinary Alloy PhaseDiagrams, 2nd ed., Vol.1, T.B. Massalski (Ed.-inChief), ASM International,Materials Park, OH,1990.)6.7Co , wt%C60 µmHypereutectoidsteelpearliteproeutectoid Fe3CAdapted from Fig. 9.33,Callister 7e.Chapter 9 - 55
Example: Phase EquilibriaFor a 99.6 wt% Fe-0.40 wt% C at a temperaturejust below the eutectoid, determine thefollowinga) composition of Fe3C and ferrite (α)b) the amount of carbide (cementite) in gramsthat forms per 100 g of steelc) the amount of pearlite and proeutectoidferrite (α)Chapter 9 - 56
Chapter 9 – Phase EquilibriaSolution: a) composition of Fe3C and ferrite (α)b) the amount of carbide(cementite) in grams thatforms per 100 g of steelCO 0.40 wt% CCα 0.022 wt% CCFe C 6.70 wt% C31600δ12000.4 0.022 x 100 5.7g6.7 0.022Lγα 94.3 g1000γ Fe3C727 CRSα Fe3C6004000L Fe3C1148 C(austenite)800Fe3C 5.7 gγ LFe3C (cementite)Fe3CCo Cα1400 x100 T( C)Fe3C α CFe3C CαCα CO123456Co , wt% C6.7CFe3CChapter 9 - 57
Chapter 9 – Phase Equilibriac. the amount of pearlite and proeutectoid ferrite (α)note: amount of pearlite amount of γ just above TE1600δL1400T( C)γ LγCo Cαγ x 100 51.2 g 1200(austenite)γ α Cγ Cα1000γ Fe3C800727 CRSpearlite 51.2 gproeutectoid α 48.8 g6004000L Fe3C1148 Cα Fe3C1Cα C CγO23456Co , wt% CChapter 9 - 58Fe3C (cementite)Co 0.40 wt% CCα 0.022 wt% CCpearlite Cγ 0.76 wt% C6.7
Effect of alloying elements on Fe-Cphase diagramChapter 9 - 59
Alloying Steel with More ElementsTiMoSiWCrMnNiwt. % of alloying elementsAdapted from Fig. 9.34,Callister 7e. (Fig. 9.34from Edgar C. Bain, Functions of the AlloyingElements in Steel, American Society for Metals,1939, p. 127.) Ceutectoid changes:C eutectoid (wt%C)T Eutectoid ( C) Teutectoid changes:NiCrSiTi MoWMnwt. % of alloying elementsAdapted from Fig. 9.35,Callister 7e. (Fig. 9.35from Edgar C. Bain, Functions of the AlloyingElements in Steel, American Society for Metals,1939, p. 127.)Chapter 9 - 60
Summary Phase diagrams are useful tools to determine:--the number and types of phases,--the wt% of each phase,--and the composition of each phasefor a given T and composition of the system. Alloying to produce a solid solution usually--increases the tensile strength (TS)--decreases the ductility. Binary eutectics and binary eutectoids allow fora range of microstructures.Chapter 9 - 61
path A to B. Changing Co can change # of phases: path B to D. A(20 C,70) 2 phases 0 20 40 60 70 80 100 Temperature ( C) Co Composition (wt% sugar) L (liquid solution i.e., syrup) 20 100 40 60 80 0 L (liquid) S (solid sugar) water-sugar system. Chapter 9 - 5 Phase Equilibrium