Transcription
Carbon Footprint ofMagnesium Productionand its Use inTransport Applications- Summary -
IMA LCA StudyTitleUpdate of Life Cycle Assessment of Magnesium Components inVehicle ConstructionDateOctober 30th, 2020AuthorSimone EhrenbergerGerman Aerospace Center e.V.Institute of Vehicle ConceptsProf. Dr.-Ing. H. E. FriedrichPfaffenwaldring 38-40D-70569 Stuttgart, GERMANYSimone EhrenbergerTel.: 49 (0)711/6862-256Fax: 49 (0)711/6862-258 49 (0) 711/6862-412 49 (0) 711/6862-258simone.ehrenberger@dlr.der2
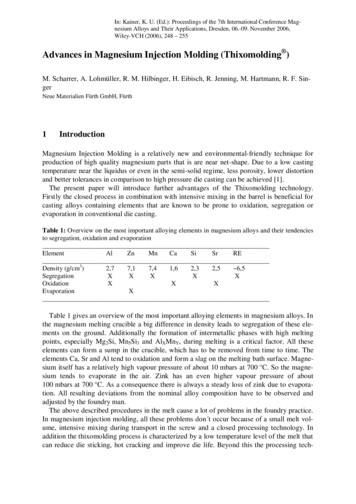
IMA LCA Study1 Motivation and GoalFinding new lightweight solutions is one of the major tasks that the automotive industry isaddressing for various reasons. Apart from reducing the vehicle’s energy consumption, theincrease of electrical mileage is a further motivation in case of electric vehicles. Magnesium is oneof the materials which offer advantages as a lightweight material for many transport applications.In order to assess the potential environmental benefits of magnesium, to show the status andprogress of different production routes to manufacture magnesium and magnesium alloys and tocompare these with each other and with competitive lightweight materials, the InternationalMagnesium Association (IMA) initiated a study on the life cycle assessment of magnesium thatwas published in 2013. The study “Life Cycle Assessment (LCA) of Magnesium Components inVehicle Construction” was written by the Institute of Vehicle Concepts of the German AerospaceCentre (DLR) and analysed the entire life cycle of magnesium components for transportapplications (Ehrenberger, Dieringa, and Friedrich 2013). Environmental concerns of theproduction, alloying, components production and use of magnesium were addressed as well asthe end-of-life of magnesium components (Figure 1). Since the magnesium production andespecially the Pidgeon process in China are subject of continuous improvements, an update ofthe LCA study reflecting the carbon dioxide (CO2) and greenhouse gas (GHG) emissions of thecurrent production situation is presented in this update of the 2013 study. The key changes ofthis update address the following aspects:---The focus is on the update of the data on the Pidgeon process. Main changes of the Pidgeonprocess affect the energy sources of the plants, the amount of energy needed and theupstream processes for China specific energy supply. Additionally, the energy supply anddirect emissions of the ferrosilicon (FeSi) production are updated.Information on the CO2 balance of alternative existing and of newly planned magnesiumproduction processes is included in this analysis.For the magnesium end-of-life phase, additional information on the recycling rate of postconsumer magnesium scrap as well as data on the secondary magnesium production isincluded.A comparison of an automotive and an aircraft part with a reference part made of aluminumis presented in this study in order to show how the magnesium source influences the resultson greenhouse gas emissions.Figure 1: Overview of magnesium life cycle for transport applications analysed in the LCA study in2013 (Ehrenberger, Dieringa, and Friedrich 2013)3
IMA LCA StudyConcerning the applied methodology, the study follows the standards for life cycle assessmentDIN EN ISO 14040 and 14044 (ISO 14040 2006; ISO 14044 2006). The results of this study areavailable to all interested parties. Above all, the study intends to provide up-to-date and reliabledata and results on magnesium production. The results of the magnesium production evaluationcan be used for any magnesium product as it is not part specific. In general, the user of this studyneeds to bear in mind that the LCA methodology is an estimate of environmental impacts andthe results have to be interpreted as potential impacts rather than predictions on environmentalburdens or risks.2 Analysis of Primary Magnesium ProductionPidgeon Process in ChinaIn the past years since the 2013 LCA study has been published, the Pidgeon process has beenfurther improved. Major efforts have been made to improve the energy efficiency of the process,e.g. by waste heat utilization. Furthermore, stricter requirements concerning the reduction of airpollutants forced the magnesium producers to install additional equipment for air purification.This leads to higher electricity demand for the peripheral equipment and partly compensates forthe efforts of energy savings in the reduction process.The fuel gases used by the various Pidgeon process plants are defined as follows (Ehrenberger,Dieringa, and Friedrich 2013): Producer gas (made in dedicated gas plants for magnesiumsmelters), coke oven gas (from coking plants), semi-coke oven (from semi-coke plant) and naturalgas. The data on the energy consumption of the Pidgeon process has been surveyed by CMA andrepresents the state of Pidgeon process in 2019. Compared to the data of the 2013 LCA study,the use of semi coke oven gas has increased from 45 % to 64 %. The share of producer gas hasdecreased from 34 % to 22 % and from 14 % to 6 % in case of coke oven gas. Though theoverall amount of magnesium produced with natural gas increased from 43 kt in 2011 to 75 kt in2019, its relative share remains almost constant at a low level of 8 % (compared to 6 % in 2011).The average consumption of fuel gas as well as other production materials is calculated accordingto the number of companies without considering the individual production volume of therespective companies.The emissions of the FeSi production are subject of uncertainty. Due to the nature of the process,certain amounts of CO2 and CO (carbon monoxide) are released during production. The data forthe direct emissions of FeSi production have been updated using data provided by Kero (2017).Furthermore, current FeSi production in China largely takes place in regions with CO2 intensiveelectricity supply. Directing attention to a low carbon supply chain would further reduce theoverall emissions of the magnesium production (Ehrenberger and Brost 2015).Results for Greenhouse Gas EmissionsThe calculation of the greenhouse gas emissions of the Pidgeon process includes all upstreamprocesses like FeSi or fuel gas production. The production of FeSi, the calcination of dolomite andthe reduction itself remain the most GHG-emission intensive life cycle steps. Emissions of FeSi4
IMA LCA Studyproduction amount to 12.5 kg CO2eq per kg magnesium. Results for the calcination process varyfrom 6.7 to 9.1 kg CO2eq / kg Mg depending on the energy source used. Due to the reducedenergy consumption, the emissions of the Pidgeon process are lower than in 2011. The overallaverage emissions of the current process amount to 28 kg CO2eq including all upstream processes.The calculation of the life cycle inventory is based on an allocation for the production of cokeoven gas and semi coke oven gas according to the energy contribution of the fuel gases to theentire production from the (semi) coke plant. As at present, these fuel gases are provided to themagnesium producers either for free or at low prices, the gas which would be otherwise releasedto the atmosphere without use and can be credited to the magnesium production. In this case,the production of these fuel gases is not part of the magnesium production system. The cokeproduction which is an upstream process for the FeSi production is burdened with the fullenvironmental loads in this scenario. When applying this crediting method to the emissions, theweighted average emissions of the Pidgeon process from a cradle to gate perspective amount to21.8 kg CO2eq per kg magnesium. The direct emissions of the Pidgeon process steps amount to12.1 kg CO2eq per kg of primary magnesium (Figure 2).Figure 2: Weighted average greenhouse gas emissions per process and contribution to totalemissions (only emissions of the Pidgeon process without upstream processes) 1Other Processes on Industrial LevelApart from the Pidgeon process in China, there are some other plants which provide primarymagnesium (Figure 3). Another plant using the Pidgeon process is located in Central Turkey. Thisplant has also a solar power unit. Its CO2eq emissions are in a similar range to those of the ChinesePidgeon process (Ehrenberger and Brost 2015). Considerable savings potential results from thepossibility an alternative source of FeSi which uses a higher share of renewable electricity.Another plant located in Brazil uses a silicothermic process which is a modified type of BolzanoProcess. (Russ, Sandilands, and Hasenberg 2012) have calculated CO2eq emissions of 10.1 kg perkg magnesium. This includes a credit for the CO2 uptake by eucalyptus trees that are used asbiomass in the production process.1No direct CO2 emissions result from the briquetting process step.5
IMA LCA StudyAlternatively to thermal production pathways, primary magnesium can be produced viaelectrolysis. In this case, the emissions depend mainly on the energy source used for this process.The 2013 LCA study analyzed an electrolytic process located in Israel in detail (Ehrenberger,Dieringa, and Friedrich 2013). With credits for the process by-products, the global warmingpotential is 14.0 kg CO2eq per kg magnesium. Another electrolysis plant is located in the provinceof Qinghai, China (Magontec 2017). In this process, pure magnesium is produced frommagnesium chloride (MgCl2) brine which is a waste product of the adjacent potash production.The energy for the plant stems from different sources. The overall greenhouse gas emissions ofthe electrolysis amount 8.5 kg CO2eq per kg magnesium. Crediting the further use of chlorine asby-product of the process, the magnesium electrolysis leads to overall emissions of 5.3 kg CO2eqper kg of magnesium.Figure 3: Greenhouse gas emissions of further industrialized magnesium production sitesProduction Processes on Project LevelIn the past years, there have been various projects for establishing new production processes forprimary magnesium. Generating low environmental impact in magnesium production is onecriterion for establishing new processes. This can either be achieved by using renewable energy,by avoiding pollutant emissions or by using waste of other industrial processes as raw material.Figure 4 shows the greenhouse gas emissions of two different processes. One is ahydrometallurgical process in Canada combined with an electrolytic process using serpentine asraw material. Combined with a low carbon energy supply, this results in greenhouse gasemissions lower than 5 kg CO2eq per kg magnesium (Fournier 2017). Another planned primarymagnesium production site in Australia uses fly ash, a waste material from another industrialprocess, as raw material. As a thermal process, the process as such has higher CO2eq emissionscompared to the electrolytic process. But the remaining ash waste generated from the processcan be used as a cement substitute in the concrete industry. Credits given for the use of this byproduct lower the emission balance to about 7.5 kg CO2eq per kg magnesium (Paterson 2020).6
IMA LCA StudyFigure 4: Greenhouse gas emissions of magnesium production on project level3 Analysis of End of Life and RecyclingA detailed analysis of different magnesium recycling pathways can be found in the 2013 LCAreport. The following information adds an analysis of secondary magnesium production in Europeto the data given in the original report. Furthermore, results of the IMA study “MagnesiumRecycling in the EU” (Bell et al. 2017) are presented and included in the analysis of themagnesium overall life cycle.Recovery of Magnesium as secondary AlloyDuring the manufacturing of magnesium parts or during the further processing, magnesiumscrap is generated which in some sites is treated in-house, but often is delivered to dedicatedmagnesium recycling plants. Two plants run by Magontec GmbH in Europe are analysed. Theresulting greenhouse gas emissions are quite similar for both sites (Figure 6). The energy supply isthe dominant process for the recycling plant. Apart from the emissions of the process itself, theemissions of material transport have to be added to the GHG balance of the secondarymagnesium.Figure 5: Greenhouse gas emissions from the recycling of new magnesium scrapRecycling of End-of-Life ScrapTechnically, it would be possible to separate magnesium from the rest of the vehicle, but due torelatively low volumes per unit which reduce the economic benefits of recovering the magnesiumless magnesium is recycled than possible. Bell et al. (2017) analyzed the fate of magnesium forautomotive end-of-life parts. The figures are based on an analysis of statistical data on7
IMA LCA Studymagnesium content in passenger cars, calculations of in-use accumulation and end-of-life vehiclestatistics in Europe. Based on this analysis, we assume that functional and non-functionalrecycling of magnesium substitute for primary magnesium in the follow-up process for theanalysis of the life cycle of the automotive part in this study. As presented in the 2013 LCA study,the contribution of vehicle’s end-of-life processing is comparatively small (0.2 CO2eq / kgrecovered material), while the re-use of magnesium for aluminium alloying, as assumed asstandard case in the 2013 LCA study, amounts to 3.6 kg CO2eq.4 Analysis of Magnesium UseMagnesium as a Car ComponentOn average, magnesium shows higher emissions during component production compared tosteel or aluminium on a per kg base. These higher emissions should be compensated during theuse stage. The amount of fuel and emissions that can be saved depends on the weight savings. Inthis study, we compare a cross car beam (CCB) made of magnesium with the same part made ofaluminium. The characteristics of the exemplary CCB are taken from Fackler and Berkmortel(2016). The main structure of the magnesium is cast out of magnesium. The magnesium partweights 4 kg and is made from an AM50 alloy. The weight of the aluminium part is 5.4 kg andan AlMg3 alloy is used. The emissions of the die casting process incl. alloying elements amount to1.5 kg CO2eq per kg material for the magnesium part and 1.4 kg CO2eq per kg material in case ofthe aluminium part. The functional unit of the comparison is the use of the component in apassenger car with a life time mileage of 200,000 km. In case of aluminium we refer to a 90 %recovery rate, while magnesium has a recovery rate of 66 %.For the ecological assessment of the use of lightweight materials in transport, the use phase hasconsiderable influence on the overall balance. The calculation of the fuel savings using a fuelreduction value of 0.35 l gasoline per 100 kg and 100 km results in CO2eq savings of 32 kg for the200,000 km mileage. The component die-casting and the alloying elements account for 7.3 kgCO2eq per component in case of magnesium and 9 kg CO2eq in case of aluminium. The maincontributor to the production emissions is the production of primary metal. Therefore, theemissions range considerably between the different sources of magnesium. Except for the lowcarbon QSLM production path, the production of magnesium has a positive difference toaluminium which means that the emissions for magnesium are higher in this life stage. Thisincludes production of primary metals and alloys as well as the manufacturing of the CCB via diecasting. The magnesium world average gives a hint on average emissions. Due to the dominanceof the Chinese Pidgeon process, the value is similar to the average Pidgeon process. Theemissions of the CCB production based on average Pidgeon process as source of primarymagnesium amount to 115 kg CO2eq while the emissions for the aluminium CCB assuming anaverage aluminium mix in Europe are 53 kg CO2eq. The CO2 emissions of the component usingmagnesium from the RIMA process result in a similar level like the aluminium reference.For calculating the overall difference to the reference component, the emissions of the overall lifecycle are summed up (Figure 6). The results show a positive net balance of greenhouse gas8
IMA LCA Studyemission for all magnesium production scenarios that represent the current magnesium market.The results presented represent the range of current probable scenarios. They are valid for acomparison to the European aluminium use mix. If the aluminium part uses carbon intensivematerial produced in China, the result would look quite different. The same applies for scenarioswhere a share of low carbon secondary aluminium is assumed for the parts production. Equally, ifother upcoming magnesium production paths are compared to the aluminium compontent, themagnesium components could gain much higher savings.Figure 6: Overall greenhouse gas difference of different magnesium sourcing options compared toaluminium (used in Europe)Aircraft PartAs the operation of aircrafts is energy intensive, the use of lightweight materials helps to reducefuel consumption and emissions. To show the potential of emissions saving, parts used in anaircraft door are taken as an example. The parts are a gearbox and a seal closer for each of topand bottom of an aircraft door. The emissions of the sandcasting process incl. alloying elementsamount to around 6 kg CO2eq per kg material for the magnesium part and around 5 kg CO2eq perkg material in case of the aluminium parts. The weight of the magnesium door parts amounts to6.6 kg using an AZ91 alloy. The aluminium part (A356 alloy) which is used for componentcomparison weights 8.5 kg which is a weight difference of 22 %. The relation of aircraft weightand fuel consumption is taken from the DLR model VAMP zero. For the component example inthis report, the fuel consumption is calculated for an A320. The correlation of fuel consumptionand aircraft weight is analysed for a flight of 4,100 km and an operating empty aircraft mass of41 t.Only few flights are necessary to reach a break-even point for the amortization of higheremissions during component production. Due to the very high energy consumption of an aircraftduring its flight, the absolute emission saving potential justifies the use of lightweight materials.Compared to the emissions of the use phase, the emissions of the magnesium pathways are9
IMA LCA Studyalmost equal to the aluminium reference. In any case, only a few mid-haul flights are necessary tocompensate higher emissions of the use phase. In the examples shown in Figure 13, five or lessflights are necessary for emissions compensation. If magnesium is produced via the RIMA orQSLM process, the production emissions are even lower compared the aluminium reference.Apart from the high annual mileage and greenhouse gas emissions, aircrafts have a long lifetimeof up to 30 years which would lead to an even higher lifetime emission saving potential of almost250 t CO2eq.Figure 7: Greenhouse gas emissions from production of aircraft parts (left side) compared to annualGHG emissions during aircraft operation (right side)5 ConclusionsMagnesium Production---Emissions from magnesium production in the Pidgeon process have been reduced since 2011(reference year of the 2013 LCA study). Yet, considering a potentially growing market forcarbon neutral components in the car market, further improvements in magnesium productionneed to be achieved with a higher share of renewable energy. As the number of plants thathave been surveyed for this study is limited, single plants can be below or above the figurespresented in this study.Further reduction of the overall cradle-to-gate process emissions are possible, e.g. when usingFeSi from alternative sourcing, though it is a question of further external factors whether thiswill happen or not. In future studies on magnesium production and application, the FeSi supplyshould be subject to further sensitivity analysis.The magnesium production site in Qinghai, China is a promising way to reduce the impactsfrom primary magnesium production. First calculations on the greenhouse gas emissionsresulted in the lowest greenhouse gas emissions of all magnesium pathways that are currentlyin operation. The increased output of the Qinghai plant bears the potential of becoming a gamechanger for the world average magnesium. Other processes in Canada and Australia that arecurrently in planning stage show similar low CO2 emissions and potential savings.10
IMA LCA StudyMagnesium Recycling--The use of secondary material is a critical factor. Both aluminium and magnesium haveestablished pathways for recycling and reusing scrap from parts production (post-industrialscrap) which is used for high quality secondary alloys. Though aluminium comes with anestablished end-of-life recycling loop, the actual content of secondary material that comes fromend-of-life products into automotive components is less certain. Reuse of industrial scrap andof scrap from end-of-life vehicles are both important. Yet from a product’s LCA perspective,recovery and reuse of materials from end-of-life vehicles is crucial.The share of end-of-life scrap of magnesium needs to be increased in the future. Though itwould be technically feasible, a lack of established value-added chains for end-of-lifemagnesium scrap reduces the potentials of a functional recycling of magnesium parts.Magnesium Use--The use of magnesium in both transport application analysed in this report results in lowergreenhouse gas emissions over the whole life cycle. The source of primary magnesiuminfluences the point where higher emissions of the production phase are compensated.According to present literature (World Aluminium 2017, European Aluminium 2018),aluminium likewise shows a large range of emissions from primary production depending onits geographic source. The actual difference of emissions in such product comparison highlydepends on the component characteristics and the material sourcing. Therefore, it is difficultto give generalized statements about the emission savings for these lightweight materials.The high fuel reduction potential for aircraft leads to extremely fast amortization of emissionsfrom the production stage. The aviation industry should use more magnesium from this pointof view.ReferencesBell, Nia, Rachel Waugh, and David Parker. 2017. “Magnesium Recycling in the EU - MaterialFlow Analysis of Magnesium (Metal) in the EU and a Derivation of the Recycling Rate.”prepared for International Magnesium Association.ecoinvent Center. 2019. Ecoinvent Version 3.6. www.ecoinvent.org.Ehrenberger, Simone, and Mascha Brost. 2015. “Life Cycle Assessmentofa New Pidgeon Processat Kar Mineral - Summary of Results.” Stuttgart, pdf/LCA Study Summary.pdf.Ehrenberger, Simone, Hajo Dieringa, and Horst E. Friedrich. 2013. “Life Cycle Assessment ofMagnesium Components in Vehicle Construction.” Deutsches Zentrum für Luft- undRaumfahrt. http://elib.dlr.de/87332/.European Aluminium. 2018. “Life-Cycle Inventory Data for Aluminium Production andTransformation Processes in Europe.” ental-profile-report-2018/.Fackler, H., and R. Berkmortel. 2016. “Design and Optimization of Magnesium Cross Car Beamfor the New Mercedes GLC.” In . Rome, Italy.Fournier, Joel. 2017. “Results of Environmental Analysis - Confidential Table,” February 2017.11
IMA LCA StudyFriedrich, H.E., Elmar Beeh, and S. Ehrenberger. 2018. “Next Generation Car‘s Requirements,Constraints and Potentials for Magnesium Lightweight Concepts with IntegratedFunctions.” In . Old Windsor, UK.ISO 14040. 2006. Environmental Management – Life Cycle Assessment – Principles andFramework.ISO 14044. 2006. Environmental Management – Life Cycle Assessment – Requirements andGuidelines.Kim, Hyung Chul, and Timothy J. Wallington. 2016. “Life Cycle Assessment of VehicleLightweighting: A Physics-Based Model To Estimate Use-Phase Fuel Consumption ofElectrified Vehicles.” Environmental Science & Technology 50 (20): .Koffler, C., and K. Rohde-Brandenburger. 2018. “Correction to: On the Calculation of FuelSavings through Lightweight Design in Automotive Life Cycle Assessments (TheInternational Journal of Life Cycle Assessment, (2010), 15, 1, (128-135), 10.1007/S11367009-0127-z).” International Journal of Life Cycle Assessment 23 (7): 4.Koffler, Christoph, and Klaus Rohde-Brandenburger. 2010. “On the Calculation of Fuel Savingsthrough Lightweight Design in Automotive Life Cycle Assessments.” The InternationalJournal of Life Cycle Assessment 15 (1): 128–35. https://doi.org/10.1007/s11367-0090127-z.Magontec. 2017. “Magontec Qinghai - The World’s Greenest Magnesium Alloy /2018/02/MagontecBrochure FINAL Web2 SinglePages.pdf.Meng 2020, personal communication of former CMA member.Nuss, P., and M. J. Eckelman. 2014. “Life Cycle Assessment of Metals: A Scientific Synthesis.”PLoS One 9 (7): e101298. son, David. 2020. “Research, Development and Demonstration Application for LatrobeMagnesium - Confidential Information,” May 2020.Rohde-Brandenburger, K., and C. Koffler. 2019. “Reply to Kim et al. (2019): Commentary on‘Correction to: On the Calculation of Fuel Savings through Lightweight Design inAutomotive Life Cycle Assessments’ by Koffler and Rohde-Brandenburger (2018).”International Journal of Life Cycle Assessment 24 (3): -y.Russ, D., J. Sandilands, and V. Hasenberg. 2012. “Dataset for Magnesium Production at RimaIndustrial.” Leinfelden-Echterdingen: PE International.USGS. 2020. “Magnesium Metal.” agnesium-metal.pdf.World Aluminium. 2017. “Life Cycle Inventory Data and Environmental Metric for the PrimaryAluminium Industry.” http://www.worldaluminium.org/media/filer public/2017/06/28/lca report 2015 final.pdf.12
gas. The data on the energy consumption of the Pidgeon process has been surveyed by CMA and represents the state of Pidgeon process in 2019. Compared to the data of the 2013 LCA study, the use of semi coke oven gas has increased from 45 % to 64 %. The share of producer gas has decreased from 34 % to 22 % and from 14 % to 6 % in case of coke .
