Transcription
ModernFlowCytometryAntibody PanelsControlsData AnalysisCell SortingStatistics
ModernFlowCytometryCopyright 2015 by Tim Bushnell, Ph.D. and Expert Cytometry LLCIntellectual Property Rights:A. Except as expressly authorized in writing by Expert Cytometry LLC (Excyte), You shall not (via anymeans, now known or later discovered or created) reproduce, modify, distribute in any manner(including rent, lease, loan, or sell), mirror, republish, download, transmit, create derivative works of,or remove or modify any copyright or trademark notice or other notice of ownership relating to,the Content of Expert Cytemetry LLC or others, in whole or in part.B. Unless explicitly stated herein, nothing in these Terms shall be construed as conferring any licenseto intellectual property rights, whether by estoppel, implication, or otherwise.C. If You believe that Your copyright, trademark, or privacy right has been infringed, in any way,by Content on the Website, please provide a detailed description of the alleged infringementfor further investigation via e-mail to copyright@Excyte.com. Excyte’s receiving, investigating, orresponding to your e-mail shall not constitute Excyte’s agreement or verification of your claim(s)nor any admission of liability therefor.D. Excyte makes no commitment, covenant, promise, warranty, representation, or guarantee that it willreceive, review, investigate, or respond to your claim within any particular time.
MODERN FLOW CYTOMETRYcontentsINTRODUCTION – WHAT IS MODERN FLOW CYTOMETRY?.4. 7AUTOFLUORESENCE CONTROL . 7ISOTYPE CONTROL . 8FMO CONTROL . 8CELL COUNTING . 9COMPENSATION . 13CHAPTER 1 – CONTROLLING A FLOW CYTOMETRY EXPERIMENTCHAPTER 2 – CREATING AN EFFECTIVE FLOW CYTOMETRY ANTIBODY PANEL.ANTIBODY RANKING .FLUOROCHROME BRIGHTNESS .INSTRUMENT CONFIGURATION .PANEL BUILDING SOFTWARE .STAIN INDEX .TITRATION .OMIPs .CHAPTER 3 – FLOW CYTOMETRY STATISTICAL ANALYSIS.FLOW CYTOMETRY STATISTICS .APPLYING THE RIGHT STATISTICAL TEST TO YOUR FLOW CYTOMETRY DATA .HOW TO PERFORM A T-TEST .141415151718212223232527. 30IMPROVING CELL RECOVERY . 32MEASURING CELL SORTING PERFORMANCE . 34CHAPTER 4 – CELL SORTINGCHAPTER 5 – FLOW CYTOMETRY DATA ANALYSIS.FLOWJO VERSION X TIPS .PERFORMING A SPICE ANALYSIS WITH FLOWJO .TIPS FOR USING FACSDIVA SOFTWARE .CHAPTER 6 – ADVANCED TOPICS.MEASURING AND REPORTING APOPTOSIS IN FLOW CYTOMETRY .PHOSPHO-FLOW CYTOMETRY .AVOIDING PITFALLS OF FLOW CYTOMETRY PROLIFERATION EXPERIMENTS .CELL CYCLE ANALYSIS .CRITICAL STEPS IN DNA CELL CYCLE ANALYSIS .CyTOF .3740474952525457596063CONCLUSION . 64WORKS CITED . 65INDEX . 67
MODERN FLOW CYTOMETRYintroductionWhat is ModernFlow Cytometry?Flow cytometry is a tool in biotechnology that is used to evaluatephysical and chemical characteristics of single cells at the whole celllevel. The technology was introduced in the 1930s, but it wasn’t untiltechnological advancements in instrumentation that flow cytometry wasable to expand its usefulness beyond basic cell calculating and sorting.Today, researchers can use the technology to perform complex experimentsto work toward solving some of the world’s greatest mysteries in healthscience. In addition to impacting how cells are analyzed, the commercialinnovations of flow cytometry have also had an important impact onhow researchers conduct experiments. This book provides instructionsand guidelines for performing modern flow cytometry that should renderexperiments that are more successful.In modern flow cytometry, the way you start an experiment remains thesame. You must define the hypothesis or biological question that you wantto answer. This initial step helps to confirm that flow cytometry is the correcttechnique for answering the question. One major determination that youneed to make is whether the cells should be purified using sorting or if theexperiment is simply for analytical purposes. In Chapter 1, “Controlling Your4ExpertCytometry.com
MODERN FLOW CYTOMETRYintroduction – What is modern flow cytometry?Experiments”, we consider the controls that can help ensure the experimentaccurately tests the hypothesis.Once you’ve established that flow cytometry is a suitable tool for yourexperiment, you next need to design your flow cytometry panel. Animportant part of this step is identifying the reagents that are needed forthe experiment. In immunophenotyping experiments, this involves knowingwhich subpopulations need to be identified and determining the antibodiesthat are needed for the experiment. Not all experiments will involve complexphenotyping. For example, cells may be transformed to express greenfluorescent protein (GFP) or other fluorescent proteins as a measure ofthe expression of some gene. Other experiments may involve measuringbiological processes such as reactive oxygen, proliferation, or cell cycle.Regardless of your experiment parameters, understanding how to developthe flow cytometry panel is a very critical step. Chapter 2, “Creating theRight Panel”, provides strategies for designing a panel that can save youtime and ensure the experiment is efficient.A final precursor to conducting an experiment using modern flowcytometry is understanding the output data and how it will be analyzed.This is accomplished by understanding the statistical analytical processthat will be used to prove or disprove the hypothesis determined in thefirst step. Output data in flow cytometry is discussed in Chapter 3, “FlowCytometry Statistical Analysis”.Once you understand your experiment, you are ready to conduct theexperiment. This is the part of the process that varies significantly in moderncytometry in comparison to the processes of old. It involves knowing theprotocols that will be used, setting up the instrument, and collecting the data.Core managers and their staff that run facilities have expertise in these areasand can offer assistance. In modern cytometry, cell sorting continues to bea central focus of conducting an experiment. In Chapter 4, “Cell Sorting”, weexplore how this process has advanced.Next in the process is analyzing the data. This step consists of using the flow5ExpertCytometry.com
MODERN FLOW CYTOMETRYintroduction – What is modern flow cytometry?cytometry software application of your choice to identify the populations thatare relevant for the experiment. This should line up with the reagents youidentified earlier in the process. Then, you extract the information necessaryto test the hypothesis and answer the question you posed in the initial step.In Chapter 5, “Data Analysis”, we discuss techniques for gathering data analysisfor your flow cytometry experiments.The final step in a flow cytometry experiment is to relax and enjoy. Flowcytometry is a powerful tool for answering biological processes at the wholecell level. A well-designed and executed experiment can provide a wealthof data, and being the first to unravel some secret about the biology of anorganism is a very powerful feeling. Repeat the process as needed. Flowcytometry is constantly evolving and researchers must stay informed of thechanges. Chapter 6, “Advanced Topics”, provides an introduction to some of thetopics you may want to consider to learn more about modern flow cytometry.6ExpertCytometry.com
MODERN FLOW CYTOMETRYchapter 1CONTROLLING A FLOWCYTOMETRY EXPERIMENTControls in a flow cytometry experiment serve to manage points inthe process that could steer it from achieving accurate assessmentof its hypothesis. You should apply these controls to each andevery flow cytometry experiment. The following techniques can help youcontrol your flow cytometry experiments and make sure they accuratelytest your hypotheses:hhAutofluorescence ControlhhIsotype ControlhhFMO ControlhhCell CountinghhCompensationAutofluorescence controlAutofluorescence is the term used to describe the natural fluorescence thatoccurs in cells. The common compounds that give rise to this fluorescencesignal include cyclic ring compounds such as NAD(P)H, Collagen, and Riboflavin.Aromatic amino acids such as tyrosine, tryptophan, and phenylalanine also7ExpertCytometry.com
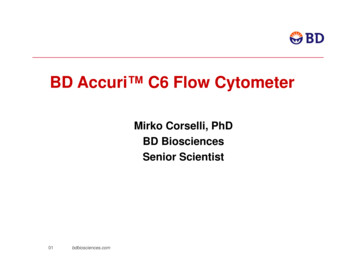
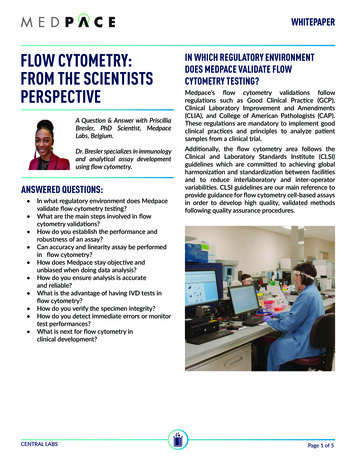
MODERN FLOW CYTOMETRYchapter 1 – CONTROLLING A FLOW CYTOMETRY EXPERIMENThave a fluorescence characteristic. These compounds absorb in ultravioletto Blue range (355-488 nm) and emit in the Blue to Green range (350-550nm). The consequence of autofluorescence is the loss of signal resolution inthese light ranges and a decrease in signal sensitivity.Autofluorescence typically increases with cell size. Large cells have moreautofluorescence than smaller ones because larger cells often contain moreautofluorescent compounds. You can control this variability by aligning yourinstrument to compensate for excess excitation. This involves investigatingthe laser lines to determine if they are able to minimize autofluorescence.ISOTYPE CONTROLIsotype control refers to the genetic variation in the heavy and light chainsthat make up the whole antibody moiety. In mammals, there are nine possibleheavy-chain isotypes and two light-chain isotypes. Every antibody will have aspecific isotype, and you can find this information on the technical informationspecification sheet. For example, you might have an antibody with an isotypeof IgG1, kappa. This indicates the heavy chain is a IgG1 isotype.Isotypes can have different non-specific binding affinity to cells, which leadresearchers to use isotype controls to identify what cells were positive ornegative. Even though some researchers (and reviewers) continue to insiston using isotype controls to set positivity, they can only be used to identifypotential blocking problems. Thus, isotype controls serve a purpose in earlystage development of panels and in revealing blocking issues, but must neverbe used as the basis of determining positivity.FMO CONTROLFluorescence Minus One (FMO) control is a type of control that you can useto properly interpret flow cytometry data. It is used to identify and gate cellsin the context of data spread due to the multiple fluorochromes in a givenpanel. An FMO control contains all the fluorochromes in a panel, except forthe one that is being measured. For example, in a four-color panel there8ExpertCytometry.com
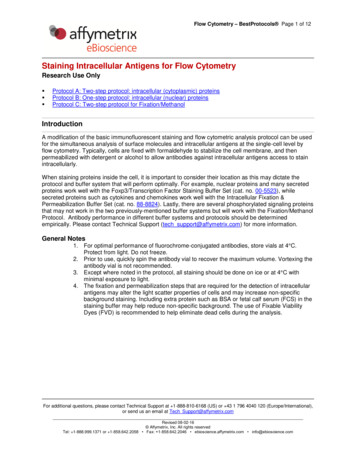
MODERN FLOW CYTOMETRYchapter 1 – CONTROLLING A FLOW CYTOMETRY EXPERIMENTwould be four separate FMO controls, as shown in Figure 1.Figure 1: A 4-color panel with FMO ControlsThe FMO control ensures that any spread of fluorochromes into the channelof interest is properly identified. The proper use of a single FMO control ina 3-color experiment is illustrated in Figure 2 below.The image in Figure 2 shows the difference between the isotype bound andthe FMO bound represents the spread of the data due to the fluorescencespread in the PE channel.cell countingThe hemocytometer is considered the gold standard for cell counting.Invented by Louis Charles Malassez, this precision-etched microscope slideallows researchers to count cells under a microscope with high accuracy. Thismicroscope is inexpensive in comparison to other methods, but that doesnot mean that it is the most efficient or fastest method.9ExpertCytometry.com
MODERN FLOW CYTOMETRYchapter 1 – CONTROLLING A FLOW CYTOMETRY EXPERIMENTFigure 2: Hemocytometer Cell CountingThe key to using a hemocytometer is training. Since you will be visuallyinspecting the cells within a boundary, the rules of what cells to count andwhat to exclude on those boundaries becomes critical. If you are countingmore than one sample, proper cleaning of the hemocytometer is a secondcritical step. Failure to completely remove the cleaning solution can causecell lysis and lower than expected cell numbers.The bias that an investigator brings to the hemocytometer and the slow speedfor counting cells is the reason many users are moving toward automatedcounting methods. These can be divided into three major categories: imagebased, impedance-based, and cytometry-based. Image-based methods suchas the one implemented in the Cellometer, the T20, and the Countess usea system that takes a picture of a defined area using a proprietary slide andidentifies the cells based on the relative size. These systems can also count“dead” cells using Trypan Blue, which is similar to what can be done withthe hemocytometer. All of these systems are relatively fast at counting thecells and accurate within certain size ranges.10ExpertCytometry.com
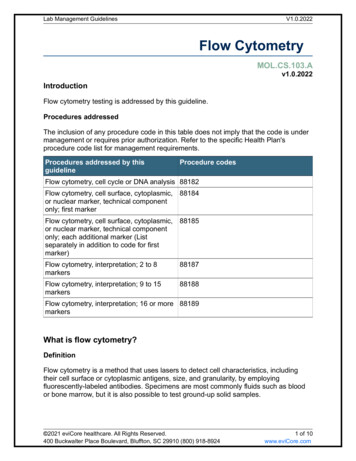
MODERN FLOW CYTOMETRYchapter 1 – CONTROLLING A FLOW CYTOMETRY EXPERIMENTFigure 3: Countess Automated Cell CounterWallace Coulter discovered and patented the impedance principle formeasuring cells in solution. This technique is still used in a clinical setting incell counters today. It is also a very accurate way to measure the number andsize of cells. Impedance measurements, as commercialized in the Coultercounter, the Scepter, and the Casy counter are also very accurate and requirea diluted sample (especially the Scepter). Dead cells are measured basedon their size (smaller than normal cells). The Scepter has the advantageof being a hand-held, pipet like device, making it amenable to rapid cellcounting in a tissue hood.The use of the flow cytometer as a cell counter requires a pump-drivensystem, which provides an accurate measurement of the volume of sample.It is a simple calculation to determine the concentration of the sample.Instruments such as the Accuri and the Guava are excellent tools forcounting cells. In addition, you can use a cell impermeant dye such as PIor 7AAD to measure the dead cells. This is more accurate than using TrypanBlue and visually inspecting the “blueness” of the cells.11ExpertCytometry.com
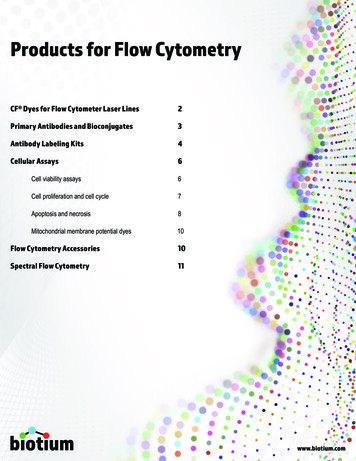
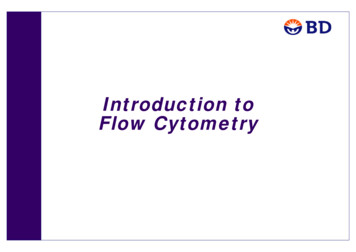
MODERN FLOW CYTOMETRYchapter 1 – CONTROLLING A FLOW CYTOMETRY EXPERIMENTFigure 4: Scepter CounterWith a displacement or pressure system that is typically available ininstruments, an extra step is required. Accurate volume measurement isnot possible with this method of cell counting. To compensate, you mustadd a counting particle to the sample. A very accurate pipet is requiredto dispense the counting particle into the sample. Once the sample is runon the flow cytometer, you can then measure the number of countingparticles and the ratio of collected particles to total particles to determinethe original count in the sample. This method is suitable for high throughputapplications that are typically integrated into the sample at the end, ratherthan a simple counting method at the beginning of an assay.Figure 5: Example of Cell Concentrations Comparison.Reprinted with permission from Accuri Cytometers (Accuri Cytometers, 2010).[1]12ExpertCytometry.com
MODERN FLOW CYTOMETRYchapter 1 – CONTROLLING A FLOW CYTOMETRY EXPERIMENTThe bottom line of cell counting is that the method you use is unimportant.You should, however, use a method that is consistent and reproducible.COMPENSATIONOne of the most important controls in proper flow cytometry is compensation.Compensation is the process used to correct spillover, the overlap of afluorochrome into a second channel caused by the physics of fluorescence.Compensation is a mathematical value that makes sure that contributionsfrom the fluorochromes that are not being displayed are not affecting thedistribution of the data being displayed.Manual compensation is the process of adjusting compensation based onthe visual appearance of the data. Make sure you remove any manuallycompensated data from your lab notebook. Manual compensation results inovercompensated data, which yields incorrect conclusions. The best practiceis to use automatic compensation algorithms that are available in currentversions of flow cytometry software that are based, in part, on the work byC. Bruce Bagwell and Earl G. Adams that describes the mathematics behindmulti-parameter compensation (Bagwell & Adams, 2006).[2]Successful automatic compensation is based on the following three rules:1. The controls must be at least as bright as the samples they will be appliedto. Brighter is better, but not off scale.2. Background fluorescence should be the same between the negative andpositive population. Avoid using the universal negative for compensation.3. The compensation color must be the same as the experimental color.For example, don’t use Alexa488 to compensate for FITC.If you follow these rules and the compensation doesn’t appear accurate,resist the temptation to edit the compensation matrix to produce better dataresults. Instead, troubleshoot the problems and work to resolve them.13ExpertCytometry.com
MODERN FLOW CYTOMETRYchapter 2CREATING AN EFFECTIVE FLOWCYTOMETRY ANTIBODY PANELDesigning a flow cytometry panel that is accurate and effective is similarto solving a puzzle. In the eyes of the flow cytometrist, the puzzleis trying to optimize the ability to make a sensitive measurementto answer the biological question the researcher has set out to answer. Itis very common for the process to take a month or longer. This is mainlybecause panel design requires a delicate balance of biology and physics.Understanding the biology of the system and the physics of flow cytometryare critical to success. Despite antibody panel design and flow cytometryexperimental design in general being a complicated process, there are waysyou can simplify the process.ANTIBODY RANKINGYou should start the antibody panel design process by ranking yourantibodies based on cellular expression level and importance in answeringthe biological hypothesis. For example, CD3 is a highly expressed antigenon T-cells and is important in making primary gating decisions, whileCD86 is a dimly expressed (or emergent) marker on cells undergoingactivation and may be critical to answer the biological hypothesis.14ExpertCytometry.com
MODERN FLOW CYTOMETRYchapter 2 – CREATING AN EFFECTIVE FLOW CYTOMETRY ANTIBODY PANELKnowing the approximate antigen density will help you rank them inproper order. You can use common categories such as high density,intermediate density, low density, an unknown density. For some commonantigens, these values are known. Downloading an antigen density chartfrom the Internet can help.FLUOROCHROME BRIGHTNESSFluorescence brightness can be measured and different fluorochromescompared to each other. Fluorescence brightness has two very importantcharacteristics: laser power and detector efficiency. For each instrument,fluorescence brightness can be different, and should be part of thedevelopment process of any panel. New fluorochromes are shaking upmany brightness charts. The addition of new brilliant violet dyes, forexample, are spectacularly bright compared to traditional fluorochromes.Use a chart that ranks fluorochromes from brightest to most dim. Basedon the brightness of fluorochromes and the expression density of theantigen on the cells, you want to pair highly expressed antigens such asCD3 with dimmer fluorochromes. You should then pair lower expressionantigens with brighter fluorochromes.INSTRUMENT CONFIGURATIONYou must understand the configuration of the instrument that is beingused in the experiment. This is a significant factor in designing an accurateand effective antibody panel. This means learning the instrument’sexcitation light sources and its sensitivity and quality control specifications.Instrument excitation light sources refers to the lasers that are available andwhether they are co-linear or parallel. The laser sources and the pathwaysdetermine the fluorochrome choices that can be used. Especially withco-linear lasers, some fluorochrome choices may have to be eliminated.Regarding the instrument’s sensitivity and quality control specifications,pay particular attention to where the most sensitive measurements can bemade on the system. Everything doesn’t boil down to just fluorescence15ExpertCytometry.com
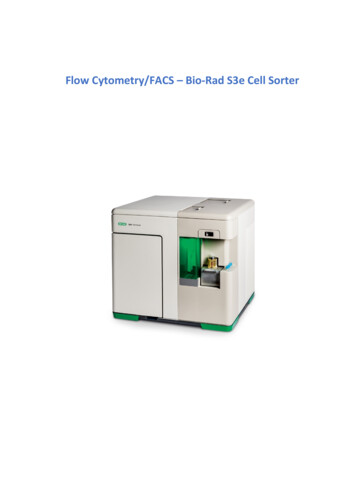
MODERN FLOW CYTOMETRYchapter 2 – CREATING AN EFFECTIVE FLOW CYTOMETRY ANTIBODY PANELintensity. Sometimes, it is better to use a less bright fluorochrome if thechannel does not receive a lot of error. Figure 8 is an example Excelanalysis of the spillover of fluorochromes into different detectors on a4-laser instrument (405, 488, 532, 633). Adding the values across resultsin the error that that a given detector receives from the fluorochromesin the panel. Adding the values down the columns results in the amountof error a given fluorochrome contributes to the panel in question.Figure 6: Example of Fluorochrome Spillover(Courtesy of University of Rochester’s Flow Cytometry Resource)Using the above analysis (Nguyen, 2013)[3], you could make an informeddetermination of where the best fluorochrome choices are to makesensitive measurements.This stage of panel design is where everything is pulled together. Startby paring the high antigen expression with dimmer fluorochromes.Those targets of low or unknown antigen expression should bepaired with brighter fluorochromes. An additional consideration is tominimize the spread of error, especially in channels where sensitivemeasurements are made. Methods for determining the spread of errorinto different detectors has been published in several publications(Perfetto, Chattopadhyay, & Roederer, 2004).[4]The data would look something like this:16ExpertCytometry.com
MODERN FLOW CYTOMETRYchapter 2 – CREATING AN EFFECTIVE FLOW CYTOMETRY ANTIBODY PANELIn Figure 9, the sum across thedetectors reveals the amount oferror that each detector receives.Summing down the fluorochromesreveals the amount of error thateachfluorochromecontributesto the total panel. This type ofchart can help identify where it isbest to make the most sensitivemeasurements in the context ofwhere the greatest spillover is,which reduces the sensitivity.Figure 7: Example of Paring Antigen Expressionwith Fluorochromes (Courtesy of University ofRochester’s Flow Cytometry Resource)PANEL BUILDING SOFTWAREAs stated in the introduction to this book, advancements in technology havebeen a significant contributor to modern flow cytometry. Using a panelbuilding program to design your antibody panel can save you valuable time.A critical step in the design process is finding all the antigen-fluorochromepairs that are available. While it is possible to search through catalogues anduse popular search engines such as Google, using one of the many softwareapplications that are available can help you in the selection process. Threeof the most popular applications are listed below (in alphabetical order):hhChromocyte – a web-based system panel building system and aresource website (Home Page: chromocyte, n.d.).[5]hhFluorish – a resource with a free downloadable panel building tool(Home Page: Fluorish, n.d.).[6]17ExpertCytometry.com
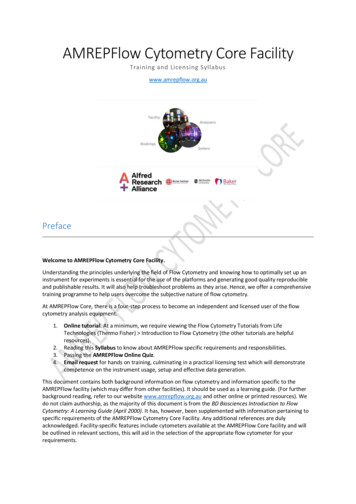
MODERN FLOW CYTOMETRYchapter 2 – CREATING AN EFFECTIVE FLOW CYTOMETRY ANTIBODY PANELhhFluoroFinder – a new resource with a web-based interface for panelbuilding (Home Page: FluoroFinder, n.d.).[7]STAIN INDEXKnowing how to optimize the reagents in your experiment is crucial. This isa multi-step process, first of which is titration of the antibodies. This process,discussed in more detail in the next section, ensures that that the optimalantibody concentration is used. If there are too much antibodies, sensitivity isreduced by increasing background (SI is decreased). Use too few antibodiesand sensitivity is also reduced by decreasing the positive signal.Figure 8: Results in Changes in Antibody ConcentrationThe second step is optimizing the voltage on the instrument for eachfluorochrome. Staining the cells with optimal antibody concentration, thenrun a voltage series to determine if increasing the voltage will improve theStaining Index (SI).Figure 9: Changing Voltage to improve S/N18ExpertCytometry.com
MODERN FLOW CYTOMETRYchapter 2 – CREATING AN EFFECTIVE FLOW CYTOMETRY ANTIBODY PANELIn the panel on the left, increasing the voltage doesn’t change the stainingindex significantly. In the right panel, increasing the voltage shows animprovement to the staining index. Pairing highly expressed antigens (like CD3)with dimmer fluorochromes, and the antigens of interest with the brightestfluorochromes, is a key part of panel design with few tools to help.With early generation instruments, pairing the antigens of interest withthe brightest fluorochromes was relatively easy to determine sincefluorochrome choice was limited. With the advent of instruments capableof measuring more than 4 fluorochromes, there is a need to characterizethe relative brightness of different fluorochromes under actual experimentalconditions, rather than as free fluors.Figure 10: Formula for Stain IndexThis equation, shown in Figure 12, compares the differences between themeans of the positive and negative and corrects this value by dividing bytwo times the spread (as measured by the standard deviation) of the negativepopulation (Bigos, 2007)[8] (Maecker H. T., 2004)[9]. This measurement, calledthe Staining Index (or SI), allows for the comparison of the relative brightness offluorochromes. As shown in Figure 13, if different fluorochromes are attachedto the same antigen, cells can be stained and the SI compared. Failing toconsider SI values is a significant mistake that can negatively impact yourflow cytometry experiments.19ExpertCytometry.com
MODERN FLOW CYTOMETRYchapter 2 – CREATING AN EFFECTIVE FLOW CYTOMETRY ANTIBODY PANELFigure 11: Stain Index CalculationsThe above calculations reveal that PE APC FITC PerCP, which providesthe researcher with critical information necessary to design the polychromaticantibody panel (Maecker & Trotter, 2006)[10].In early flow cytometry, there were some limitations to SI. The most notablelimitation was the fact that the data was corrected by the standard deviationof the noise. With so many fluorochromes on digital instruments, at leastpart of the negative signal is background noise that can be attributed in partto the electronic noise in the flow cytometer. A modification of the SI waspulsed in 2009 (Telford, Hawley, Subach, Verkhusha, & Hawley, 2012) . The[11]equation for this correction is shown in Figure 14.Figure 12: Stain Index Correction Equation20ExpertCytometry.com
MODERN FLOW CYTOMETRYchapter 2 – CREATING AN EFFECTIVE FLOW CYTOMETRY ANTIBODY PANELIn this equation, the difference between the medians of the positive andnegative populations and divides that by the right hand of the negativedistribution, as reflected by the 84% of the negative minus the medianof the negative. This Separation Index (or SI) provides a similar metric tothe Bigos/Maecker Staining Indexas shown in Figure 4.Whether you use staining orseparation,SIisacriticalparameter and the experimentis straightforward, and can beperformedusinganyhighly-expressed antigen that is availableFigure 13: Stain Index Matrixin many fluorochromes.TITRATIONAfter you’ve added all the critical elements to the antibody panel, youshould optimize it. Proper antibody titration is critical to ensure thatthe panel works as you expect. Titration is the process of identifyingthe best concentration to use an antibody for a given assay. While thevendor will provide a specific concentration to use, this may not beappropriate for your assay.Performing titration is a simple process: fix cell concentration, time ofincubation, volume of reaction, and temperature. Figure 16 illustrates howtitration works. The graph displays an antibody from Leinco Technologiesthat was used to stain 1 106 cells for 20 minutes on ice. To identify thebest concentration to use, the modified Staining Index was calculated(Telford, Hawley, Subach, Verkhusha, & Hawley, 2012)[11]and plottedagainst the concentration, as shown in Figure 16.21ExpertCytometry.com
MODERN FLOW CYTOMETRYchapter 2 – CREATING AN EFFECTIVE FLOW CYTOMETRY ANTIBODY PANELAs is shown again in Figure 16,as concentration increases above0.5 μg/ml, SI decreases. This isdue in part to the increase in theba
and guidelines for performing modern flow cytometry that should render experiments that are more successful. In modern flow cytometry, the way you start an experiment remains the same. You must define the hypothesis or biological question that you want to answer. This initial step helps to confirm that flow cytometry is the correct