Transcription
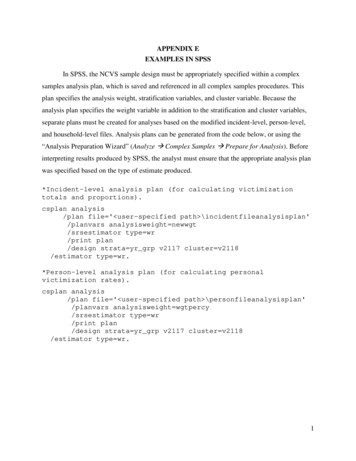
APPENDIX EEXAMPLES IN SPSSIn SPSS, the NCVS sample design must be appropriately specified within a complexsamples analysis plan, which is saved and referenced in all complex samples procedures. Thisplan specifies the analysis weight, stratification variables, and cluster variable. Because theanalysis plan specifies the weight variable in addition to the stratification and cluster variables,separate plans must be created for analyses based on the modified incident-level, person-level,and household-level files. Analysis plans can be generated from the code below, or using the“Analysis Preparation Wizard” (Analyze Complex Samples Prepare for Analysis). Beforeinterpreting results produced by SPSS, the analyst must ensure that the appropriate analysis planwas specified based on the type of estimate produced.*Incident-level analysis plan (for calculating victimizationtotals and proportions).csplan analysis/plan file ' user-specified path \incidentfileanalysisplan'/planvars analysisweight newwgt/srsestimator type wr/print plan/design strata yr grp v2117 cluster v2118/estimator type wr.*Person-level analysis plan (for calculating personalvictimization rates).csplan analysis/plan file ' user-specified path \personfileanalysisplan'/planvars analysisweight wgtpercy/srsestimator type wr/print plan/design strata yr grp v2117 cluster v2118/estimator type wr.1
*Household-level analysis plan (for calculating propertyvictimization rates).csplan analysis/plan file ' user-specified path \hhfileanalysisplan'/planvars analysisweight wgthhcy/srsestimator type wr/print plan/design strata yr grp v2117 cluster v2118/estimator type wr.Because SPSS does not support the specification of formulas within the analysisprocedures, for the calculation of victimization rates analysts must first create a new variableequal to the product of the victimization count and the adjustment factor (ADJINC WT),multiplied by 1,000 (as outlined in the examples below).The subpop statement is used to limit the analysis to the appropriate set of cases. Whileall combinations of variables included in the subpop statement will be included in the results,only the results meeting all subpopulation conditions are relevant. For this reason, prior to eachanalysis a “subpop” variable is created based on all exclusions (e.g. victimizations occurringoutside of the US and outside the year(s) of interest). Including this single recoded variable onthe subpop statement simplifies examination of the results.Examples 1 and 2 demonstrate how to estimate the total number of victimizations.Examples 3 and 4 demonstrate how to calculate the proportion of victimizations with givencharacteristics. Examples 5 and 6 demonstrate the calculation of personal and propertyvictimization rates for victimization characteristics included on the modified person andhousehold files, while Example 7 demonstrates the calculation of victimization rates forvictimization characteristics not on the modified files. Examples are included for both singleand pooled-year estimates. Finally, Example 8 demonstrates how to identify low qualityestimates and implement the rounding recommended as discussed in Section 4 of the user’sguide.2
E.1Victimization TotalsSPSS’s csdescriptives and cstabulate procedures are used to estimate the total number ofvictimizations from the modified incident-level file. Both procedures can be found under thecomplex samples menu (Analyze Complex Samples Descriptives and Analyze ComplexSamples Frequencies, respectively). If the analysis does not include domains (i.e. subsets ofthe population based on characteristics of the victimization or victim), csdescriptives is used andthe crime of interest is specified in the summary statement. If the analysis includes domains,cstabulate is used, and both the crime type of interest as well as the domain variable(s) arespecified on the tables statement. Examples 1A-1C demonstrate the calculation of victimizationtotals for single years, and Examples 2A-2C demonstrate pooled year estimates.Example 1:Number of victimizations, single yearExamples 1A and 1B below are estimates of personal crimes, while Example 1C is anestimate of property crimes. Examples 1A and 1C provide overall crime estimates (and thereforeuse the csdescriptives procedure), while Example 1B provides estimated totals for person-levelcharacteristics of interest (and therefore uses the cstabulate procedure).Example 1A - Total number of violent victimizations, 2011Year(s): 2011Crime Type: violent victimizations (vcrime)Domain(s): n/aWeight: newwgtSubpopulation: within the United States (exclude outUS 0); non-dummy records (dummy 0);2011 (year 2011)Code:compute subpop 0. *a.if (exclude outus 0) & (dummy 0) & (year 2011) subpop 1.execute.csdescriptives/plan file ' user-specified path \incidentfileanalysisplan' *b./summary variables vcrime *c./subpop table subpop display layered *d./sum *e./statistics se/missing scope analysis classmissing exclude.3
Code Comment(s):a)b)c)d)e)Derive subpop variable based on all exclusionsSpecify analysis planOutcome of interestLimit analysis to records of interestSpecify which estimates to produceOutput:Complex Samples: Descriptives[AdjIncident]NOTE: Output is provided overall and by subpopulation. Only the outputunder “Subpopulation Descriptives” with a “SUBPOP” value of 1 is relevant(highlighted row).Subpopulation DescriptivesUnivariate StatisticsSUBPOPEstimateStandard ime5812522.79357912.358474
Example 1B - Total number of violent victimizations by sex, age category, and race/ethnicity,2011Year(s): 2011Crime Type: violent victimizations (vcrime)Domain(s): sex (sex), age category (agecat), and race/ethnicity (race eth)Weight: newwgtSubpopulation: within the United States (exclude outUS 0); non-dummy records (dummy 0);2011 (year 2011)Code:compute subpop 0.if (exclude outus 0) & (dummy 0) & (year 2011) subpop 1.execute.cstabulate/plan file ' user-specified path \incidentfileanalysisplan'/tables variables sex agecat race eth by vcrime *a./subpop table subpop display layered/cells popsize/statistics se/missing scope table classmissing exclude.Code Comment(s):a) Domain variables (victim characteristics) by outcome of interestOutput:Complex Samples: Tables[AdjIncident]NOTE: Output is provided overall and by subpopulation. Only the outputunder “Subpopulation Tables” with a “SUBPOP” value of 1 is relevant(highlighted row). Totals are provided for all levels of vcrime. In thisexample, we are only interested in violent crime totals so only the vcrime 1column is relevant (highlighted column).5
Subpopulation Tablessex * vcrimeSUBPOPsexvcrime.001.001.002Population SizePopulation SizeTotalPopulation Size1Population Size2TotalPopulation SizePopulation SizeEstimateStandard ErrorEstimateStandard ErrorEstimateStandard ErrorEstimateStandard ErrorEstimateStandard ErrorEstimateStandard 78410.0436
agecat * vcrimeSUBPOPagecatvcrime.001Population Size2Population Size3Population Size4.005Population Size6Population Size7Population Size8Population SizeTotalPopulation Size1Population Size2Population Size3Population Size41.00Population SizePopulation Size5Population Size6Population Size7Population Size8Population SizeTotalPopulation SizeEstimateStandard ErrorEstimateStandard ErrorEstimateStandard ErrorEstimateStandard ErrorEstimateStandard 3837.594Standard .8612017311.416942230.084Standard 131429762.185617719.5772047481.762EstimateStandard ErrorEstimateStandard ErrorEstimateStandard ErrorEstimateEstimateStandard ErrorEstimateStandard ErrorEstimateStandard ErrorEstimateStandard ErrorEstimateStandard ErrorEstimateStandard ErrorEstimateStandard ErrorEstimateStandard 2.79023041440.766550787.547357912.358778410.0437
race eth * vcrimeSUBPOPrace ethvcrime.001Population Size2Population Size3Population Size.0045Population SizePopulation SizeTotalPopulation Size1Population Size2Population Size3Population Size4Population Size5Population SizeTotalPopulation 1092444.169Standard rd ErrorEstimateStandard ErrorEstimateStandard ErrorEstimateStandard 594Standard 729.1312017311.41614525327.257Standard ErrorEstimateStandard 5144.854895434.0443530578.898Standard .547357912.358778410.043EstimateStandard ErrorEstimateStandard ErrorEstimateStandard Error8
Example 1C - Total number of property victimizations, 2011Year(s): 2011Crime Type: property victimizations (pcrime)Domain(s): n/aWeight: newwgtSubpopulation: within the United States (exclude outUS 0); non-dummy records (dummy 0);2011 (year 2011)Code:compute subpop 0.if (exclude outus 0) & (dummy 0) & (year 2011) subpop 1.execute.csdescriptives/plan file ' user-specified path \incidentfileanalysisplan'/summary variables pcrime/subpop table subpop display layered/sum/statistics se/missing scope analysis classmissing exclude.Output:Complex Samples: Descriptives[AdjIncident]NOTE: Output is provided overall and by subpopulation. Only the outputunder “Subpopulation Descriptives” with a “SUBPOP” value of 1 is relevant(highlighted row).Subpopulation DescriptivesUnivariate StatisticsSUBPOPEstimateStandard rime17063147.83543578.638389
Example 2: Number of crimes, aggregated yearsExamples 2A and 2B are estimates of personal crimes, while Example 2C is an estimateof a property crime. Examples 2A and 2C provide overall crime estimates and Example 2Bprovides estimated totals for a victimization-level characteristic of interest. The code providedcalculates the estimated number of victimization across the pooled years. To calculate theaverage number of victimizations per year, estimated totals and standard errors must be dividedby the number of pooled years, as shown in the following examples.Example 2A - Total and average number of aggravated assaults, 2009-2011Year(s): 2009-2011Crime Type: aggravated assaults (aast)Domain(s): n/aWeight: newwgtSubpopulation: within the United States (exclude outUS 0); non-dummy records (dummy 0);2009-2011 ((2009 year) and (year 2011))Code:compute subpop 0.if (exclude outus 0) & (dummy 0) & (2009 year) & (year 2011)subpop 1. *a.csdescriptives/plan file ' user-specified path \incidentfileanalysisplan'/summary variables aast/subpop table subpop display layered/sum/statistics se/missing scope analysis classmissing exclude.Code Comment(s):a) Subpopn statement includes the range of years to be analyzedOutput:Complex Samples: Descriptives[AdjIncident]NOTE: Output is provided overall and by subpopulation. Only the outputunder “Subpopulation Descriptives” with a “SUBPOP” value of 1 is relevant(highlighted row).10
Subpopulation DescriptivesUnivariate StatisticsSUBPOPEstimateStandard 40415.60160814.14604NOTE: The estimate above represents the total number of aggravated assaults from 20092011. To obtain the average number of aggravated assaults, both the estimate and the standarderror must be divided by the number of pooled years (3), as follows:𝑎𝑎𝑎𝑎𝑎𝑎 𝑛𝑛𝑛𝑛𝑛𝑛𝑛𝑛𝑛𝑛𝑛𝑛 𝑜𝑜𝑜𝑜 ��𝑎𝑎𝑎𝑎𝑎𝑎𝑎 ��𝑎𝑎𝑎 𝑡𝑡𝑡𝑡𝑡𝑡𝑡𝑡𝑡𝑡 𝑛𝑛𝑛𝑛𝑛𝑛𝑛𝑛𝑛𝑛𝑛𝑛 𝑜𝑜𝑜𝑜 ��𝑎𝑎𝑎𝑎𝑎𝑎𝑎 𝑛 𝑜𝑜𝑜𝑜 𝑝𝑝𝑝𝑝𝑝𝑝𝑝𝑝𝑝𝑝𝑝𝑝 3 980138.53𝑆𝑆𝑆𝑆(𝑎𝑎𝑎𝑎𝑎𝑎 𝑛𝑛𝑛𝑛𝑛𝑛𝑛𝑛𝑛𝑛𝑛𝑛 𝑜𝑜𝑜𝑜 ��𝑎𝑎𝑎𝑎𝑎𝑎𝑎 ��𝑎𝑎𝑎) ���𝑡 𝑛𝑛𝑛𝑛𝑛𝑛𝑛𝑛𝑛𝑛𝑛𝑛 𝑜𝑜𝑜𝑜 ��𝑎𝑎𝑎𝑎𝑎𝑎𝑎 �𝑒 𝑜𝑜𝑜𝑜 𝑝𝑝𝑝𝑝𝑝𝑝𝑝𝑝𝑝𝑝𝑝𝑝 𝑦𝑦𝑦𝑦𝑦𝑦𝑦𝑦𝑦𝑦160814.153 53604.7211
Example 2B - Total and average number of aggravated assaults involving firearm, 2009–2011Year(s): 2009-2011Crime Type: aggravated assaults (aast)Domain(s): weapon category (weapcat)Weight: newwgtSubpopulation: within the United States (exclude outUS 0); non-dummy records (dummy 0);2009-2011 ((2009 year) and (year 2011))Code:compute subpop 0.if (exclude outus 0) & (dummy 0) & (2009 year) & (year 2011)subpop 1.cstabulate/plan file ' user-specified path \incidentfileanalysisplan'/tables variables weapcat by aast *a./subpop table subpop display layered/cells popsize/statistics se/missing scope table classmissing exclude.Code Comment(s):a) Cstabulate is used because analysis incudes a person-levelcharacteristic of interest. Both the crime type and domainvariable are specified on the tables statement.Output:Complex Samples: Tables[AdjIncident]NOTE: Output is provided for all levels of aast and weapcat. Level 1 ofweapcat is associated with firearms, so the estimate under subpop 1,aast 1, and weapcat 1 is the estimated total (highlighted).12
Subpopulation Tablesweapcat * AASTSUBPOPweapcatAAST.00.001.000Population Size1Population Size2Population Size3Population Size4Population Size5Population SizeTotalPopulation Size0Population Size1Population Size2Population Size3Population Size45TotalPopulation SizePopulation SizePopulation .126Standard 8243047.013601553.505844600.518Standard ErrorEstimateStandard 06901.084769812.228Standard ndard 1.931576155.18412145988.833Standard 8Standard ErrorEstimateStandard ErrorStandard d 39927.2971015915.757Standard 259.43132462.9851228722.417Standard ErrorEstimateStandard ErrorEstimateStandard OTE: The estimate above represents the total number of aggravated assaults involving afirearm from 2009-2011. To obtain the average number of aggravated assaults involving afirearm, both the estimate and the standard error must be divided by the number of pooled years(3), as follows:13
𝑎𝑎𝑎𝑎𝑎𝑎 𝑛𝑛𝑛𝑛𝑛𝑛𝑛𝑛𝑛𝑛𝑛𝑛 𝑜𝑜𝑜𝑜 ��𝑎𝑎𝑎𝑎𝑎𝑎𝑎 ��𝑎𝑎𝑎 𝑤𝑤 ��𝑓 778706.293 259568.76𝑆𝑆𝑆𝑆(𝑎𝑎𝑎𝑎𝑎𝑎 𝑛𝑛𝑛𝑛𝑛𝑛𝑛𝑛𝑛𝑛𝑛𝑛 𝑜𝑜𝑜𝑜 ��𝑎𝑎𝑎𝑎𝑎𝑎𝑎 ��𝑎𝑎𝑎 𝑤𝑤 ��𝑓) 𝑡𝑡𝑡𝑡𝑡𝑡𝑡𝑡𝑡𝑡 𝑛𝑛𝑛𝑛𝑛𝑛𝑛𝑛𝑛𝑛𝑛𝑛 𝑜𝑜𝑜𝑜 ��𝑎𝑎𝑎𝑎𝑎𝑎𝑎 ��𝑎 𝑤𝑤 𝑛 𝑜𝑜𝑜𝑜 𝑝𝑝𝑝𝑝𝑝𝑝𝑝𝑝𝑝𝑝𝑝𝑝 ��𝑠(𝑡𝑡𝑡𝑡𝑡𝑡𝑡𝑡𝑡𝑡 𝑛𝑛𝑛𝑛𝑛𝑛𝑛𝑛𝑛𝑛𝑛𝑛 𝑜𝑜𝑜𝑜 ��𝑎𝑎𝑎𝑎𝑎𝑎𝑎 ��𝑎 𝑤𝑤 ��𝑛𝑛𝑛 𝑜𝑜𝑜𝑜 𝑝𝑝𝑝𝑝𝑝𝑝𝑝𝑝𝑝𝑝𝑝𝑝 𝑦𝑦𝑦𝑦𝑦𝑦𝑦𝑦𝑦𝑦 27184.0514
Example 2C - Total and average number of household burglaries, 2009-2011Year(s): 2009-2011Crime Type: household burglary (hburg)Domain(s): n/aWeight: newwgtSubpopulation: Within the United States (exclude outUS 0); non-dummy records (dummy 0);2009-2011 ((2009 year) and (year 2011))Code:compute subpop 0.if (exclude outus 0) & (dummy 0) & (2009 year) & (year 2011)subpop 1.csdescriptives/plan file ' user-specified path \incidentfileanalysisplan'/summary variables hburg/subpop table subpop display layered/sum/statistics se/missing scope analysis classmissing exclude.Output:Complex Samples: Descriptives[AdjIncident]NOTE: Output is provided overall and by subpopulation. Only the outputunder “Subpopulation Descriptives” with a “SUBPOP” value of 1 is relevant(highlighted row).Subpopulation DescriptivesUnivariate StatisticsSUBPOPEstimateStandard 10201317.31336711.45333NOTE: The estimate above represents the total number of household burglaries from2009-2011. To obtain the average number of household burglaries, both the estimate and thestandard error must be divided by the number of pooled years (3), as follows:15
𝑎𝑎𝑎𝑎𝑎𝑎 𝑛𝑛𝑛𝑛𝑛𝑛𝑛𝑛𝑛𝑛𝑛𝑛 𝑜𝑜𝑜𝑜 𝑜𝑜𝑜 ��𝑏𝑏𝑏𝑏𝑏𝑏𝑏 𝑡𝑡𝑡𝑡𝑡𝑡𝑡𝑡𝑡𝑡 𝑛𝑛𝑛𝑛𝑛𝑛𝑛𝑛𝑛𝑛𝑛𝑛 𝑜𝑜𝑜𝑜 𝑜𝑜𝑜 𝑛𝑛𝑛𝑛𝑛𝑛𝑛 𝑜𝑜𝑜𝑜 𝑝𝑝𝑝𝑝𝑝𝑝𝑝𝑝𝑝𝑝𝑝𝑝 13 � 𝑛𝑛𝑛𝑛𝑛𝑛𝑛𝑛𝑛𝑛𝑛𝑛 𝑜𝑜𝑜𝑜 𝑜𝑜𝑜 ��𝑏𝑏𝑏𝑏𝑏𝑏𝑏) ���𝑡 𝑛𝑛𝑛𝑛𝑛𝑛𝑛𝑛𝑛𝑛𝑛𝑛 𝑜𝑜𝑜𝑜 𝑜𝑜𝑜 �𝑛𝑛𝑛𝑛𝑛𝑛𝑛 𝑜𝑜𝑜𝑜 𝑝𝑝𝑝𝑝𝑝𝑝𝑝𝑝𝑝𝑝𝑝𝑝 𝑦𝑦𝑦𝑦𝑦𝑦𝑦𝑦𝑦𝑦336711.453 112237.1516
E.2Victimization ProportionsSPSS’s cstabulate procedure is used to estimate the percent distribution of victimizationsin a specific domain across covariates from the modified incident-level file. This procedure canbe found under the complex samples menu (Analyze Complex Samples Frequencies). If theanalysis is limited to a specific domain (i.e. a subset of the population based on characteristics ofthe victimization or victim) then it is specified on the subpop statement. Covariates of interest arespecified on the tables statement.Example 3: Percent distribution of victims across characteristics, single yearExample 3A is an estimate of personal crimes, while Example 3B is an estimate ofproperty crimes. In Example 3A, both the analysis domain and covariates are specified based onperson- and incident-level characteristics. In Example 3B, the analysis domain is specified basedon an incident-level characteristic, while the covariates are household-level characteristics.Example 3A - Distribution of female violent crime victims by age category, race/ethnicity, andvictim-offender relationship, 2011Year(s): 2011Domain(s): female (sex 2); violent victimizations (vcrime 1)Covariate(s): age category (agecat); race/ethnicity (race eth); victim-offender relationship(direl)Weight: newwgtSubpopulation: within the United States (exclude outUS 0); non-dummy records (dummy 0);2011 (year 2011); female (sex 2); violent victimizations (vcrime 1)Code:compute subpop 0.if (exclude outus 0) & (dummy 0) & (year 2011) & (sex 2) & (vcrime 1)subpop 1. *a.cstabulate/plan file ' user-specified path \incidentfileanalysisplan' *b./tables variables agecat race eth direl *c./subpop table subpop display layered/cells tablepct/statistics se cumulative/missing scope table classmissing exclude.Code Comment(s):a) Limits analysis to records of interestb) Specifies sample designc) Covariates of interest17
Output:Complex Samples: Tables[AdjIncident]NOTE: Output is provided overall and by subpopulation. Only the outputunder “Subpopulation Tables” with a “SUBPOP” value of 1 is relevant(highlighted rows).Subpopulation TablesagecatSUBPOP.00% of TotalEstimate% of 00.0%100.0%0.0%100.0%Total11.00Standard Error1Total4.5%18
race ethSUBPOP.00% of TotalEstimate% of 1.00Standard ErrorTotaldirelSUBPOP.00% of 0.0%100.0%0.0%100.0%Total1% of TotalCumulative161.00Standard ErrorTotal19
Example 3B - Distribution of property crime victims by household income, MSA status, andregion, 2011Year(s): 2011Domain(s): property victimizations (pcrime 1)Covariate(s): household income (hincome); MSA status (msa); region (region)Weight: newwgtSubpopulation: within the United States (exclude outUS 0); non-dummy records (dummy 0);2011 (year 2011); property victimizations (pcrime 1)Code:compute subpop 0.if (exclude outus 0) & (dummy 0) & (year 2011) & (pcrime 1) subpop 1.cstabulate/plan file ' user-specified path \incidentfileanalysisplan'/tables variables hincome msa region/subpop table subpop display layered/cells tablepct/statistics se cumulative/missing scope table classmissing exclude.Output:Complex Samples: Tables[AdjIncident]NOTE: Output is provided overall and by subpopulation. Only the outputunder “Subpopulation Tables” with a “SUBPOP” value of 1 is relevant(highlighted rows).20
Subpopulation TableshincomeSUBPOP.00% of TotalEstimate% of 1%1.1%100.0%100.0%0.0%100.0%Total11.00Standard Error1TotalHOUSEHOLD LOCALESUBPOP.00% of TotalEstimate% of ndard Error1Total21
RegionSUBPOP.00% of 0.0%0.0%100.0%Total1% of TotalCumulative141.00Standard ErrorTotal22
Example 4: Percent distribution of victims across characteristics, aggregated yearsExample 4A is an estimate of personal crimes, while Example 4B is an estimate ofproperty crimes. Both examples specify multiple covariates based on incident-levelcharacteristics.Example 4A - Percent of violent victimizations reported and not reported to police by type ofcrime, 2009-2011Year(s): 2009-2011Domain(s): violent victimizations (vcrime 1)Covariate(s): report status (notify); type of crime (newoff)Weight: newwgtSubpopulation: within the United States (exclude outUS 0); non-dummy records (dummy 0);2009-2011 ((2009 year) and (year 2011)); violent victimizations (vcrime 1)Code:compute subpop 0.if (exclude outus 0) & (dummy 0) & (2009 year) &(year 2011)& (vcrime 1) subpop 1.cstabulate/plan file ' user-specified path \incidentfileanalysisplan'/tables variables newoff by notify *a./subpop table subpop display layered/cells rowpct/statistics se/missing scope table classmissing exclude.Code Comment(s):a) The goal is to obtain the distribution of victimizations byreport status for each type of violent crime. Therefore, newoffby notify is specified on the tables statement and row percentsand standard errors (ROWPCT and SE) are requested. If the percentdistribution of crimes among those reported or not reported topolice were desired, column percents and standard errors (COLPCTand SE)would be requested.Output:Complex Samples: Tables[AdjIncident]NOTE: Output is provided overall and by subpopulation. Only the outputunder “Subpopulation Tables” with a “SUBPOP” value of 1 is relevant(highlighted row).23
Subpopulation Tablesnewoff * notifySUBPOPnewoffnotifyEstimate1% within newoffStandard ErrorEstimate2% within newoffStandard Error.003% within newoff4% within newoff56% within newoff% within newoff7% within newoff8% within newoffTotal% within newoff1% within newoffEstimateStandard ErrorEstimateStandard ErrorEstimateStandard ErrorEstimateStandard Error1.003% within newoff4Total% within newoff% within ndard ate61.6%37.7%0.8%100.0%Standard .6%2.7%0.9%0.0%44.1%54.4%1.5%100.0%Standard ErrorEstimateStandard ErrorStandard Error% within newoff258.9%83.1%EstimateEstimate2141.1%Standard ErrorEstimateStandard ErrorEstimateStandard .5%0.4%0.0%24
Example 4B - Percent of property victimizations reported and not reported to police by type ofcrime, 2009-2011Year(s): 2009-2011Domain(s): property victimizations (pcrime 1)Covariate(s): report status (notify); type of crime (newoff)Weight: newwgtSubpopulation: within the United States (exclude outUS 0); non-dummy records (dummy 0);2009-2011 ((2009 year) and (year 2011)); property victimizations (pcrime 1)Code:compute subpop 0.if (exclude outus 0) & (dummy 0) & (2009 year) & (year 2011)&(pcrime 1) subpop 1.cstabulate/plan file ' user-specified path \incidentfileanalysisplan'/tables variables newoff by notify/subpop table subpop display layered/cells rowpct/statistics se/missing scope table classmissing exclude.Output:Complex Samples: Tables[AdjIncident]NOTE: Output is provided overall and by subpopulation. Only the outputunder “Subpopulation Tables” with a “SUBPOP” value of 1 is relevant(highlighted row).25
Subpopulation Tablesnewoff * notifySUBPOPnewoffnotifyEstimate1% within newoffStandard Error.002% within newoff3% within newoff4% within newoff5% within newoff67% within newoff% within newoff8% within newoffTotal% within newoff6% within newoff7% within newoff8% within newoffTotal% within newoff1.00EstimateStandard ErrorEstimateStandard ErrorEstimateStandard ErrorEstimateStandard ErrorEstimateStandard ErrorEstimateStandard e42.5%56.3%1.2%100.0%Standard stimateStandard ErrorStandard ErrorEstimateStandard ErrorEstimateStandard ErrorEstimateStandard .1%0.7%100.0%0.5%0.5%0.1%0.0%26
E.3Victimization RatesVictimization rates are calculated from the modified person-level file (for personalcrimes) or the modified household-level file (for property crimes) using SPSS’s csdescriptivesprocedure. This procedure can be found under the complex samples menu (Analyze ComplexSamples Descriptives). Because csdescriptives does not allow the user to specify a formula forthe variable of interest, the analyst must first create a new variable equal to the product of thevictimization count for the victimization type of interest and the victimization adjustment factor(ADJINC WT), multiplied by 1,000. This new variable is used as the analysis variable incsdescriptives’summary statement, as demonstrated in the examples below.To calculate victimization rates for person- or household-level characteristics, thesecharacteristics are included on the subpop statement (in addition to the derived “subpop” variablethat limits the analysis to records of interest). However, if victimization rates are desired basedon incident-level characteristics, separate variables are defined for each level of the incidentcharacteristic of interest and are included on the summary statement. Exclusions based on theincident characteristics must be made when calculating victimization summaries, as outlined inSection 3.2. For example, the modified person- and household-level files exclude victimizationsoccurring outside of the United States. Because there are no dummy records on the modifiedperson and household files, no exclusions are needed to remove dummy records from theanalysis.The modified person and household files contain the victimization counts needed tocalculate victimization rates for the most common victimization characteristics analyzed usingNCVS data. Examples 5A-5C demonstrate the calculation of personal and propertyvictimizations rates that can be calculated directly from the modified person and household levelfiles provided for a single year and Examples 6A-6B demonstrate these calculations for pooledye
E.1 Victimization Totals SPSS's csdescriptives and cstabulate procedures are used to estimate the total number of victimizations from the modified incident-level file. Both procedures can be found under the complex samples menu (Analyze Complex Samples Descriptives and Analyze Complex Samples Frequencies, respectively).If the analysis does not include domains (i.e. subsets of