Transcription
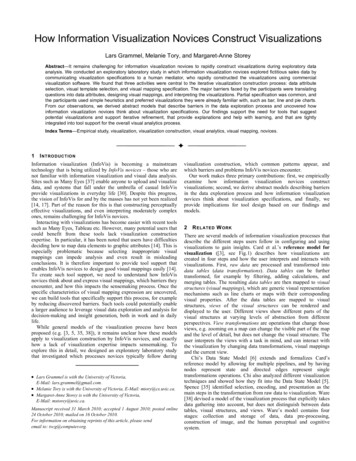
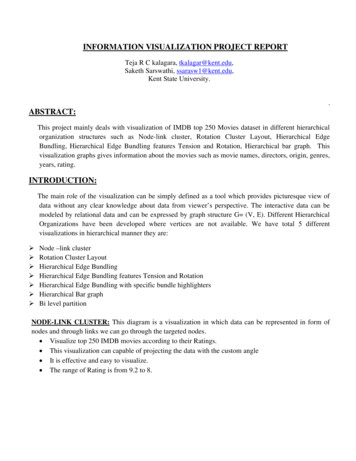
INFORMATION VISUALIZATION PROJECT REPORTTeja R C kalagara, tkalagar@kent.edu,Saketh Sarswathi, ssarasw1@kent.edu,Kent State University.ABSTRACT:This project mainly deals with visualization of IMDB top 250 Movies dataset in different hierarchicalorganization structures such as Node-link cluster, Rotation Cluster Layout, Hierarchical EdgeBundling, Hierarchical Edge Bundling features Tension and Rotation, Hierarchical bar graph. Thisvisualization graphs gives information about the movies such as movie names, directors, origin, genres,years, rating.INTRODUCTION:The main role of the visualization can be simply defined as a tool which provides picturesque view ofdata without any clear knowledge about data from viewer’s perspective. The interactive data can bemodeled by relational data and can be expressed by graph structure G (V, E). Different HierarchicalOrganizations have been developed where vertices are not available. We have total 5 differentvisualizations in hierarchical manner they are: Node –link clusterRotation Cluster LayoutHierarchical Edge BundlingHierarchical Edge Bundling features Tension and RotationHierarchical Edge Bundling with specific bundle highlightersHierarchical Bar graphBi level partitionNODE-LINK CLUSTER: This diagram is a visualization in which data can be represented in form ofnodes and through links we can go through the targeted nodes. Visualize top 250 IMDB movies according to their Ratings. This visualization can capable of projecting the data with the custom angle It is effective and easy to visualize. The range of Rating is from 9.2 to 8.
Due to many cross links the human eye is not capable of capturing the data which results to visualclutter.To overcome visual clutter in node-link the experts make a move with a new concept named EdgeBundling.ROTATING CLUSTER LAYOUT: This visualization projects the complete view of total 250 movies in groups divided according to itsrating. This visualization features rotating cluster layout according to our convenience.
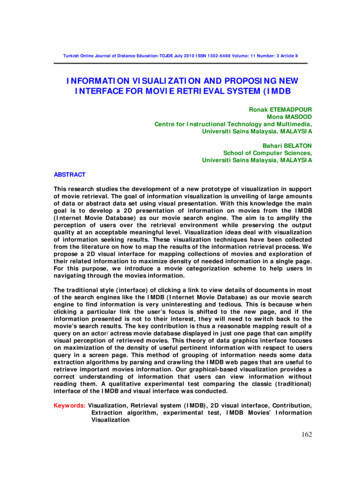
HIERARCHICAL EDGE BUNDLING:This is a technique where edges are bundled together in order to clearly express the graph structure thatuncovers strongly connected set of vertices. This addresses the issue of clutter reduction by bundling edges that point to, originate from,neighboring spatial region. Hierarchical Edge Bundling is a popular and flexible technique for achieving conjunction withexisting techniques of tree visualizations. They facilitate integration for the user preferred tree visualizations. They reduce visual clutter while dealing with large number of edges which are adjacent.Visualization:
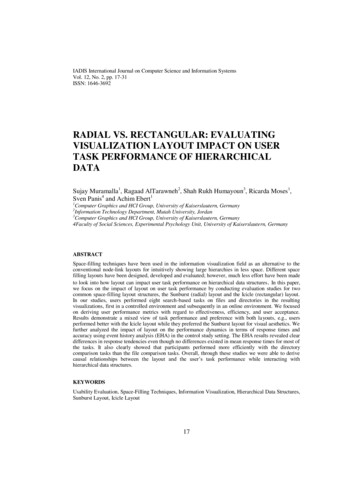
The above hierarchical edge bundling graph envision the top 100 movies of IMDB with completedetails such as Title, Director, Genre, Year of release, Origin.Source is indicated by green and target is indicated by red.If a user can hover the mouse pointer on any node to visualize or highlight the dependencies of thenode with red color.Complete conception of movies can be understood with ease.HIERARCHICAL EDGE BUNDLING FEATURE TENSION AND ROTATION: Hierarchical Edge bundling provides capability to control the strength of bundling (tension) in anintuitive and continuous manner.Low bundle strength facilitates low level, node-node information about connectivity.In contrast high bundle strength provides high level, implicit projection of adjacent edges betweensource nodes which results explicit adjacency edges between their child nodes.
In the above picture first three layouts displays the tension features, next three explains rotationwith maintaining more tension levels and final three explains the dependency visualization ofsource and targets.
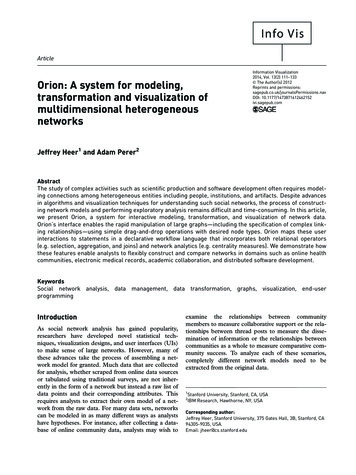
Visualization: It is similar to hierarchical edge bundling but it features cluster rotation and tension handling(bundling strength). If a user can hover the mouse pointer on any node to visualize or highlight the dependencies of thenode with red color. The nodes in red color indicate target and green indicates source nodes, the links are in contrast tonodes. In this envision user can capable of choosing multiple nodes to visualize at same time for morevivid view. Every one of us capable of tolerating different level of visual clutter, we are not so sure about it soour team come up with a concept which can handle the tension (bundle strength).The crosslinking’s of data in the graph can be easily visualized.HIERARCHICAL EDGE BUNDLING WITH SPECIFIC BUNDLE HIGHLIGHTERS: This is an effective graph where user scale of selection is taken to the next level to maintain usercomfort. As previous graph the user can select multiple nodes, it will be fine if targeted data which is limited. Let’s imagine the user wishes to visualize 100 nodes it will too hard to user to select. So user needs a tool to enhance his selection with comfort. This graph introduces a tool to select aspecific bundle to visualize.
Visualization: This visualization projects same view as previous regarding to data. It features the selection of particular bundle to visualize; user can take advantage of this feature for easyunderstanding of graph. Green indicates source and red indicate target in form of links.HIERARCHICAL BAR GRAPH: This bar visualizes hierarchical data about top 250 movies of IMDB with referred to their rating.
The bars in color blue indicate rating group.When we select a blue bar the visualization allow us to explore the complete details of movies in thatparticular rating groupBI-LEVEL PARTITION: It is similar to a tree map in a circular layout the root node is at the centre with levels of circumference
Visualization: This visualization displays similar kind of visualization as previous (hierarchical bars). Each sector of a color indicates a group of movies according to their popularity (rating) When we click on a particular sector it generates a new circular layout and all the movies in thatparticular group as sectors.Conclusion:We have tried some types of visualizations, but we selected hierarchical edge bundling because it can beused in conjunction with existing tree visualization techniques. Bundle based visualization can reducevisual clutter by binding the links in to a bundle with some strength. Provides a bar gain between highlevels, low levels adjacency relations view. Reducing the visual clutter in visualization can deliver adescent view with appropriate vividness which can be considered as ultimate goal of visualization.
References:http://www.win.tue.nl/ dholten/papers/bundles Shapes#line uthttp://ieeexplore.ieee.org/stamp/stamp.jsp?tp &arnumber 6676539http://graphics.csie.ntu.edu.tw/ edgebundles report.pdf?sequence 4
Hierarchical Edge Bundling features Tension and Rotation Hierarchical Edge Bundling with specific bundle highlighters Hierarchical Bar graph Bi level partition NODE-LINK CLUSTER: This diagram is a visualization in which data can be represented in form of nodes and through links we can go through the targeted nodes.