Transcription
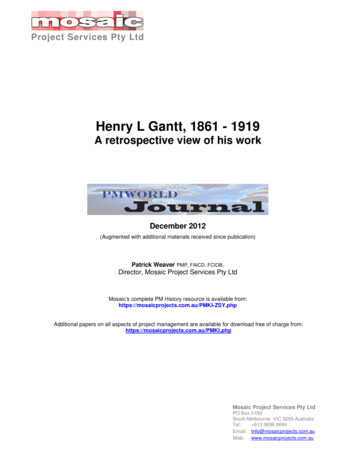
Project Services Pty LtdHenry L Gantt, 1861 - 1919A retrospective view of his workDecember 2012(Augmented with additional materials received since publication)Patrick Weaver PMP, FAICD, FCIOB,Director, Mosaic Project Services Pty LtdMosaic’s complete PM History resource is available itional papers on all aspects of project management are available for download free of charge from:https://mosaicprojects.com.au/PMKI.phpMosaic Project Services Pty LtdPO Box 5150South Melbourne VIC 3205 AustraliaTel: 613 9696 8684Email: Info@mosaicprojects.com.auWeb: www.mosaicprojects.com.au
Henry L Gantt,A retrospective view of his workHenry Laurence Gantt, A.B., M.E. was an American mechanical engineer and managementconsultant who is best known for developing the Gantt chart in the 1910s. However, thecharts Henry Gantt developed and used are nothing like the charts that are erroneouslyreferred to as ‘Gantt Charts’ by modern project managers.It is a tragedy that Gantt’s real contributions to the advancement of management science areobscured by two glaring misconceptions that continue to be perpetuated by sloppyscholarship with various authors repeating earlier incorrect assertions without ever botheringto check the original source materials. This article is intended to set the record straight andrecognise Gantt for his real achievements!Henry Gantt was a very important management scientist; his contribution to productionengineering is rightly recognised by the American Society of Mechanical Engineers (ASME)by awarding an annual medal in his honour. The Henry Laurence Gantt Medal, wasestablished in 1929 and elevated to a Society award in 1999, it is given for distinguishedachievement in management and for service to the community.Hopefully by the time you have finished this paper, you will agree the following mythsshould be ‘busted’ once and for all:Misconception #1 Henry Gantt developed ‘Bar Charts’ – Fact, bar charts were developed100 years before Gantt, his charts were sophisticated production control tools, not simplerepresentations of activities over time.Misconception #2 Henry Gantt contributed to the development of ‘project management’– this is a complete fallacy, Gantt’s work was in machine shops and factories focused onbatch production and factory throughput. Many of his ideas can be adapted to modern projectmanagement but Gantt sought to eliminate ‘one-off’ jobs that could not be batched andmanaged efficiently.Source Materials:Thanks to the digitisation of historically significant books, the three original books relating toGantt’s work are now in the public domain: Work Wages & Profits (Henry L. Gantt, 1916) Organizing for Work (Henry L. Gantt, 1919) The Gantt Chart a working tool of management (Wallace Clark, 1923)For convenience of readers, all three books can be downloaded p#Process1Bar Charts and Gantt Charts:Throughout his career, Henry Gantt used a wide range of charts; in fact it would be true tosay that one of Gantt’s core skills was developing charts to display relatively complex data inways that allowed quick and effective comprehension by managers. However none of thesecharts were simple forward projections of activities against time (ie, the conventional ‘barchart’ used on modern project management), and the term ‘Gantt Chart’ was first used in theWallace Clark book, where he describes the use of Gantt’s charts to measure productivity.2 of 18www.mosaicprojects.com.au
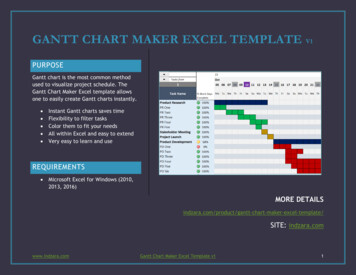
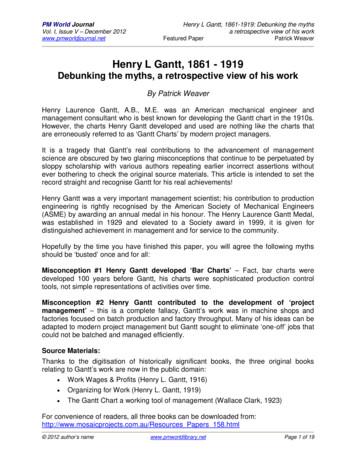
Henry L Gantt,A retrospective view of his workThe origin of the Bar Chart.The concept of ‘scheduling’ is not new; the pyramids are over 3000 years old; Sun Tzu wroteabout scheduling and strategy 2500 years ago from a military perspective; transcontinentalrailways have been being built for some 200 years, etc1. None of these activities could havebeen accomplished without some form of schedule; ie, the understanding of activities andsequencing. However, whilst the managers, priests and military leaders controlling theorganisations responsible for accomplishing these ‘works’ must have an appreciation of‘scheduling’ (or at least the successful ones would have) there is little evidence of formalprocesses until the 18th Century2.Modern bar charts can trace their origins to 1765. The originator of the concept appears to beJoseph Priestley (England, 1733-1804); his ‘Chart of Biography’ plotted some 2000 famouslifetimes on a time scaled chart. Priestley is quoted as saying “ a longer or a shorter spaceof time may be most commodiously and advantageously represented by a longer or a shorterline.”Figure 1 – Joseph Priestley: Chart of Biography1For more examples see: https://mosaicprojects.com.au/PDF Papers/P158 Henry Gantt PPT.pdf2These examples may not be the earliest use of the concepts of bar charts. Daniel Defoe published:An essay upon projects in 1697 which discusses projects from the year 1680 onwards (butrecognises there were earlier projects). The Bridgewater Canal was opened in 1761 (followed by100s of miles of others in a period of around 60 years) until the railways took over from 1825onwards. These projects and later ones such as the Crystal Palace (1850) had to have beeneffectively managed as well as designed and fabricated – there were time and cost constraints onthe builders/engineers and 1000s of workers deployed.Similarly, the origins of using diagrams in preference to words to describe ideas was the subject ofmuch scientific debate at the end of the 17th Century (Robert Hook published Micrographia, in 1665that used diagrams to describe specimens viewed through an early microscope, he was greatlyconcerned about the possibility of misinterpretation). Advances in printing allowed Joseph Priestley(England, 1733-1804) to publish his ‘Chart of Biography’ in 1765, and as described in the main text,out of this heritage, William Playfair developed ‘bar charts’ in his ‘Commercial and Political Atlas’ of1786.The principles underlying the development of graphs and bar charts is traced in The Origins of BarCharting, which covers the centuries prior to 1760. However, whilst the concepts needed to createPriestley’s charts can be traced back to Ancient Greece, there is no evidence of ‘bar charts’ prior to1765: http://www.mosaicprojects.com.au/PDF Papers/P182 The origins of bar charting.pdf3 of 18www.mosaicprojects.com.au
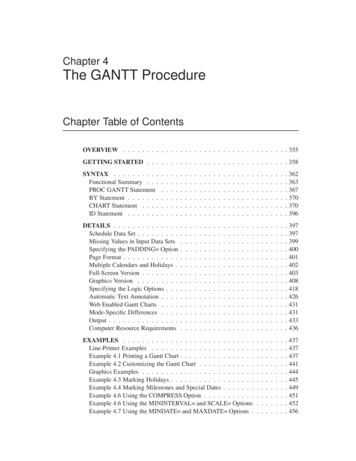
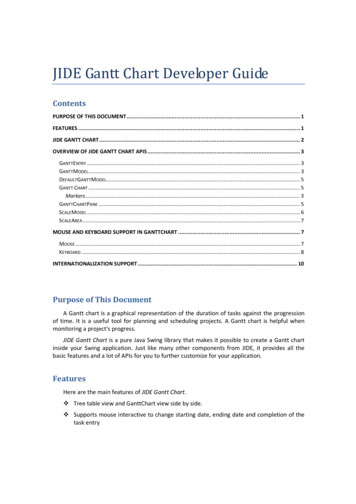
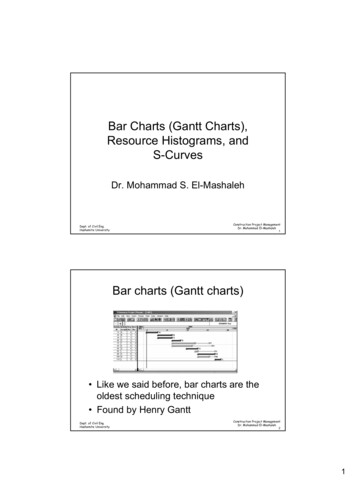
Henry L Gantt,A retrospective view of his workPriestley’s ideas were picked up by William Playfair (1759-1823) in his ‘Commercial andPolitical Atlas’ of 17863. Playfair is credited with developing a range of statistical chartsincluding the line graph, bar graph (histogram), and pie charts. His Atlas contains 43 timeseries plots and one histogram.Figure 2 – One of Playfair’s Charts from the 1801 edition of his AtlasFollowing on from Playfair; another European, Karol Adamiecki - a Polish economist,engineer and management researcher, developed the Harmonogram (or Harmonygraph) in18964. Adamiecki’s Harmonygraph has a date scale on the vertical axis (left hand side) andlists Activities across the top.Figure 3 – Adamiecki’s HarmonygraphEach activity was represented by a scaled paper strip, and the current schedule and durationof the activities were depicted by the position and length of the strips. In the header above thestrips, the name and the duration of the activity and the list of preceding activities were3Playfair, W. (1801). The Commercial and Political Atlas and Statistical Breviary. Reprinted 2005,Cambridge University Press, New York, NY.4Morris P.W.G. (1994) ‘The Management of Projects’ Thomas Telford Ltd, London. p7.4 of 18www.mosaicprojects.com.au
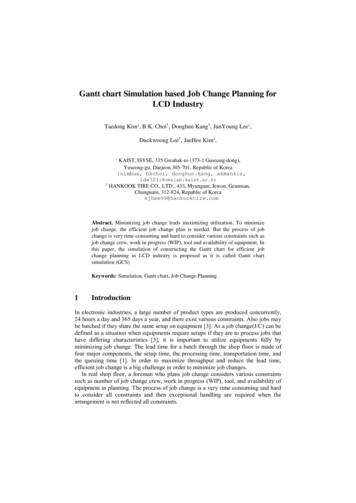
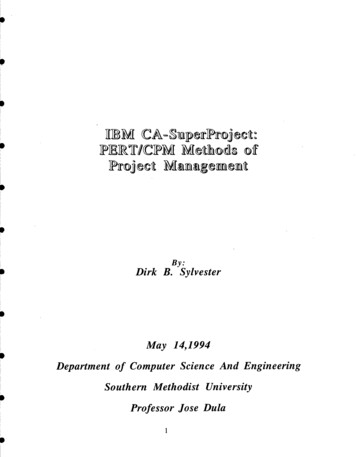
Henry L Gantt,A retrospective view of his workshown. The strips representing the preceding activities were always to the left of the strip ofthe successor. The tabulation each activities predecessors and successors in theHarmonygraph (‘from’ and ‘to’) makes it a distinct predecessor to the CPM and PERTsystems developed some 60 years later.By 1912, the modern bar chart seems to have been fully developed and in use at least inGermany. A project to construct a small mountain railway in Bavaria was the subject of alengthy report in the October 1915 edition of Armierter Beton5. The railway was of interestfor the innovative use of reinforced concrete in a major bridge, not the schedule, but inpassing the use of a bar chart and histogram were briefly discussed6:A very accurate graphical building program was set up for the execution of the work,of which Fig.33 is a part. For that, each week is assumed to be five full days of realwork, and thus all interruptions, by unfavourable weather, etc., were incorporated. Bycompiling the need for each of the individual services in the construction program to asecond table (Fig. 32) the total demand at Baustoften was seen and overallperformance was, with a view of the uncertain and irregular supply, achieved bytimely provision being made for each appropriate supplies. The construction programwas generally respected, and well laid non-structural (performance) measures aboutthat as well as the construction program, mainly by Dipl.-Ing. J. Mulller has beendesigned, excellently preserved, and, despite fairly significant investment costs, hasproved very economical.Figure 4 (Fig. 33 from the report): a Bar Chart developed for a bridge constructed in 1912.5For more on the origins of the Schürch bar chart and a set of supporting resource histograms see:The original published article (German Language):https://mosaicprojects.com.au/PDF Papers/P042 Barchart Origins.pdfA translation of the reference to the program contained in the article:https://mosaicprojects.com.au/PDF Papers/P042 Barchart Origins Comment.pdf6Note, the translation is mine, using Google Translate, there may be errors.5 of 18www.mosaicprojects.com.au
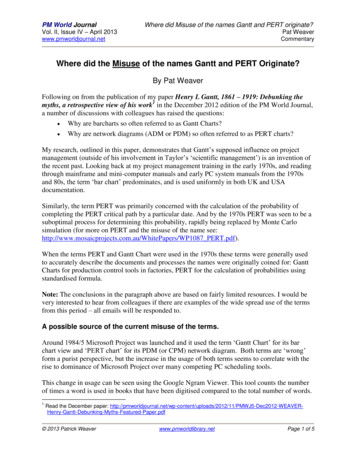
Henry L Gantt,A retrospective view of his workBased on the use of language in the Armierter Beton article it would appear the use of thistype of bar chart was routine7, the only differentiation on this project was the effort put intothe programming of the work.Figure 5 (Fig. 33 from the report): Part of the resource histograms from the same project.Given the extent of use in Europe, I would suggest it is nearly impossible for an educatedengineer such a Gantt to be unaware of this type of chart and its long history. He was awareof important German thinkers including Bismarck and Von Moltke and when discussing thebenefits of using of his own charts, Gantt commented: Many shops have very nice schedulingsystems; they plan their work beautifully - at least, it looks very pretty on paper; but theyhave no means of finding out if those schedules are lived up to or not8. We will never knowexactly what type of chart Gantt was referencing in his disparaging remarks, butunderstanding what his charts could achieve would suggest he was talking about simple barcharts similar to the one above!Gantt’s Charts.Henry Gantt developed and used a range of charts over the years to help visualise andunderstand data9. Whilst some superficially look similar to Figure 4 above, the way they were7The same project is discussed in a book by Schürch published in 1916: This copy of the chart isfrom p35 of the book.8From: Work, Wages and Profit, p130 The task idea9We do not know when Gantt developed his first charts (or the source of his inspiration). Gantt firstdescribed a version of his charts in an article published alongside Frederick W. Taylor’s ShopManagement paper published in ASME Transactions 24, 1903; in which he states they date from1890 onwards. The two papers were to be considered jointly as an integrated production planningand control system. Gantt charts were developed contemporaneously with Taylor’s system, and.Although Gantt described his daily balance as ‘‘graphical’’ it should be considered a ‘‘tabular’’approach since no graph was used. In their initial incarnation Gantt charts were a production6 of 18www.mosaicprojects.com.au
Henry L Gantt,A retrospective view of his workdeveloped and the information being communicated is quite different. The primary purposeof a traditional bar chart is to show which activities are planned to be accomplished and theirtiming in the future (sequencing can only be inferred), whereas Gantt’s charts tended to beretrospective and diagnostic. One of his earliest publications was: "A Graphical DailyBalance in Manufacture", published in 1903. These papers were consolidated into his firstbook, ‘Work Wages and Profits’, published in 1916.Figure 6 A Machine Record Chart from Work Wages and Profits (1916).The first set of charts used by Gantt and discussed in ‘Work Wages and Profits’ wereprimarily record keeping cards (Fig. 6) and bonus charts (Fig. 7). The key element with bothof these charts is information is filled in after the work is completed for a day. The purpose isto identify areas of actual production that need improvement (not to predict future activities).planning tool used to plan and manage batch production. (Source: European Journal of OperationalResearch 149 (2003) 430–437: Gantt charts: A centenary appreciation, James M. Wilson).7 of 18www.mosaicprojects.com.au
Henry L Gantt,A retrospective view of his workFigure 7A ‘Bonus Chart’ information on performance (bonus earned or not) is filled in at the end of each day.The situation is slightly different in the third chart type discussed in this book. Thehorizontal red lines on the ‘Production Sheet’ (Fig. 8) show when work on each specific partis planned to start and finish, the number of parts produced are entered after each day’s workto record the actual progress of the worker.Figure 8 A ‘Production Chart’ the information on actual production is filled in at the end of each day.8 of 18www.mosaicprojects.com.au
Henry L Gantt,A retrospective view of his work‘Work Wages and Profits’ also includes a number of graphs to demonstrate the effectivenessof Gantt’s methods and examples of job cards, time cards and other factory records.Gantt’s second book, ‘Organising for Work’ published in the year of his death is aninteresting read. Henry Gantt knew his working days were nearing an end and he was free tosay exactly what he thought! Here are a few of his grumpier comments10: The most casual investigation into the reasons why so many of the [WW1] munitionmanufacturers have not made good, reveals the fact that their failure is due to lackof managerial ability rather than to any other cause. Our most serious trouble is incompetency in high places. As long as that remainsuncorrected, no amount of efficiency in the workmen will avail very much. Our industries are suffering from lack of competent managers,—which is anotherway of saying that many of those who control our industries hold their positions, notthrough their ability to accomplish results, but for some other reason.Sentiments that I hear quite often today however, I digress; as in his first book, Gantt usesa range of charts in ‘Organising for Work’ (1919) to make complex information accessible toworkers, supervisors and managers alike. As with the charts above, most of the information isentered after the day’s work is completed, and the purpose of charts such as the ‘IdlenessExpense Chart’ is to record inefficient working to allow production improvement efforts tobe focused where needed.However, in ‘Organising for work’ Gantt does introduce the chart that Wallace Clark callsthe ‘Gantt Chart’ (Henry Gantt always named charts for their purpose). In fact, the name‘Gantt Chart’ can be traced directly to the title of Clark’s book, ‘The Gantt Chart a workingtool of management’ published in 1923.Clark worked with Gantt and can be credited for ensuring much of his legacy remainsavailable today. The ‘Gantt Chart’ used by Gantt and described in detail by Clark shows, foreach item to be manufactured, the planned quantity and allocated time slot for manufacturingthe ‘batch’, plus the actual, cumulative, and daily totals all in one line (Fig. 9).Figure 9 The details of a Gantt Chart.To understand and interpret this chart: The heavy black line shows the planned work period (with the required quantity ofparts in a tabulation,10Copied from Organizing for Work, p649 of 18www.mosaicprojects.com.au
Henry L Gantt,A retrospective view of his work The numbers show the actual quantity produced each day and the cumulative totalas at the end of the day.The thin line represents the percentage of the day’s production achieved (if 100% isachieved, the thin line extends across the full day as on Wednesday),The small vertical ‘ticks’ below the thick black line show the cumulative amountachieved at the end of each day.Figure 10 A ‘Load Chart’.As in the example above, the production target can vary from day to day depending on theprecise nature of the work, learning curves, re-tooling, etc; and most of the information isentered at the end of each day. Gantt developed and used two variants of this chart, the ‘LoadChart’ (Fig. 10) and the ‘Performance Chart’ (Fig. 11).Figure 11 A ‘Performance Chart’.10 of 18www.mosaicprojects.com.au
Henry L Gantt,A retrospective view of his workClark’s book goes on to describe many variants of the basic charts outlined above anddifferent way they can be used to assist in machine shop management. Out of all of thevarious charts developed by Gantt and commented on by Clark, the only one that has anycommonality with modern bar charts is the ‘Load Chart’ which depicts work over time.Figure 12 A different type of ‘Load Chart’ showing planned work over time for each item of equipment.Clark’s book also describes how Gantt’s work assisted the American First World War (1917 1918) production and mercantile shipping efforts11 initially at the Frankford Arsenal then onAmerica's entry to the conflict at the Ordnance Department in Washington supporting thework of General William Crozier.As with his commercial work, the primary focus of all of the charts used by Gantt during theFirst World War was on charting the difference between promises and performance12. Asdemonstrated above, work planned and work performed is shown in relation to each otherand in relation to time13. It is interesting to note that after the war General William Crozierwas moved on and the charts were quietly dropped as bureaucrats preferred to focus on whatthat they had done, rather than compare this with what they could have achieved!11From the Preface: “In 1917, after a careful inspection of certain factories in which Mr. H. L. Gantthad installed his methods, General William Crozier, then Chief of Ordnance, retained Mr. Gantt toact in a consulting capacity on production, first at the Frankford Arsenal, and then, immediatelyafter the declaration of war, in the Ordnance Department at Washington.”12Dean Schneider discussing Gantt’s charts in the Ordinance Dept. ''Each production section hasproduction and progress chart systems. These seem to vary in minor details only. Even withoutrigid standardization, the charts give a picture of the progress of the whole Ordnance Programincluding lags and the causes thereof. Combined in one office and kept to date they would showthe requirements as to workers, as well as to materials, transportation, accessory machinery, andall of the other factors which make or break the program. With a plan of this sort the OrdnanceDepartment would be in a position to state at any time its immediate and probable future needs inmen, materials, transportation, and equipment.” (Organising for Work, pp 80).13The density of information on a ‘Gantt Chart’, and its function to measure production is far moreclosely aligned with the concepts embedded in Earned Value than a traditional bar chart. Whilstthe style of Gantt’s charts is different, the information shown is precisely the same as plottingEarned Value and Planned Value in a modern EV system.11 of 18www.mosaicprojects.com.au
Henry L Gantt,A retrospective view of his workClark concludes his book as follows:General Benefits of Gantt ChartsIn the previous chapters Gantt charts have been shown as:1. A simple and effective method of planning work.2. A way of presenting facts so that they can be easily understood.3. A means of eliminating idleness and waste.4. A method of getting things done on time.But Gantt charts stand for something more than that, for where they have been in usefor some time one will find:1. Machines and equipment in good condition.2. Floor space arranged for use; neither cluttered up with unnecessary things norarranged for appearance only.3. Work moving rapidly from one operation to another without confusion.4. Large reductions in inventories of raw materials, work in process, and finishedgoods, because of the shortening of manufacturing time.5. Increased production not through speeding up workmen but by removing theobstacles which prevent them from doing their best.6. Reduced costs, because of the elimination of idleness and waste as well asimprovements in processes.7. Men in subordinate positions willing to shoulder responsibility instead of "passingthe buck," because they have definite duties and clear-cut jobs.8. Courage and initiative stimulated, because men know they will get fair play.9. No favoritism or special privilege, because every man's record can be seen byothers.10. Satisfied workmen, because the delays over which they have no control are few andthey are left free to do a full day's work and therefore earn better wages.11. Poor workmen trained and developed until they make good.12. Promotions going to men who know their jobs and, therefore, an organizationbeing built up of men who "know what to do and how to do it."13. Men interested in their work, not only because of the wages but because they havean opportunity to increase their knowledge and improve their skill.Seeing such changes take place in one plant after another, watching arbitrarymanagement become democratic and finding workmen not only interested in their workbut proud of it, strengthens the conviction that the Gantt chart is the most notablecontribution to the art of management made in this generation.Sentiments with which I concur; over his life’s work Gantt developed progressively moresophisticated charts that made complex information easy to comprehend and use by workers,supervisors and managers alike. But this was is in the management domain of factory/production management, not project management and the charts are for production planningand production records, they are not ‘project management bar charts’.12 of 18www.mosaicprojects.com.au
Henry L Gantt,A retrospective view of his workHenry Gantt’s Contribution to Management (not project management):As discussed above, Henry Gantt’s focus was on increased machine-shop production, throughthe use of effective measurement and planning. The various charts he used were a means toan end: “The man who undertakes to introduce scientific management and pins his faith torules, and the use of forms and blanks, without thoroughly comprehending the principlesupon which it is based, will fail. Forms and blanks are simply the means to an end. If the endis not kept clearly in mind, the use of these forms and blanks is apt to be detrimental ratherthan beneficial.”The starting point of Gantt’s work was the ideas of scientific management introduced byFrederic Taylor (Gantt worked with Taylor in the early days)14. Scientific managementpresumes the best way to understand a complex task is to break it down into its componentparts, scientifically study and optimise each part and then synthesise the best way to completethe work as a whole, from the optimised parts. What made Gantt’s work uniquely valuablewas the way this information was used to motivate workers.Gantt’s standout contribution was his innovative approach to workforce management, todaywe would call this ‘team motivation’; overlaid with a strong sense of industrial democracy.His 'method' was focused on the efficient utilization of labour and a fair division of therewards from any improvement in productivity between the workers and the owners of thefactories.The innovations introduced by Gantt are still very much the focus of modern management;they include team motivation, change management and the effective use of controlsystems. And whilst the focus of his work was in manufacturing (with the advantage ofrepetition and standardisation) many of his ideas are of value in today’s projects.14Prior to Taylor introducing the concept of ‘scientific management’, industrial processes and themanagement of them were influenced by the pre-industrial revolution ways of working. Businesseswere small and independent: the land craftsman toiling away at his workshop bench, the workersdetermined the process and speed of production. The economic growth of the late 19th century,especially in heavy industries such as railroads and steel required a different economic model.Taylor and his associates, especially Gantt, quickly met this need for a new way of doing things.Taylor invented what became to be known as ‘Scientific management’, its guiding principles can besummarised as follows: Separate the labour process from the skills of workers (by simplifying jobs and routing tasks, thework process would be made amenable to a less skilled work force and, to that extent,management would be less dependent on skilled labour – the ideas of Adam Smith and the keyunderpinning of factory production) Measure and optimise each step of the production process – work smarter not harder. Separate conception from execution, placing the responsibility for conceptualizing the productiveprocess and planning the work tasks in the hands of management, leaving for the shop floor onlythe execution of predetermined, rigidly enforced plans Monopolize productive knowledge at the managerial level and use this monopoly over knowledgeboth to centralize decision making and to control every step of the labour process through formalrules and procedures Gantt worked with Taylor for some 30 years and shifted the concept of scientific management from‘forcing’ production to ‘motivating’ production.These concepts were the central theme of all management thinking until the advent on ‘knowledgeworkers’ in the mid 20th century made the ‘command and control’ approach of scientificmanagement obsolete. As Peter Drucker stated in 1950, managing knowledge workers requires adifferent paradigm focused on motivating and directing in a collaborative environment.13 of 18www.mosaicprojects.com.au
Henry L Gantt,A retrospective view of his workA contemporary of Gantt, Leon P Alford (1877 - 1942), an American mechanical engineer,organizational theorist, and administrator for the American Society of Mechanical Engineerssuggests in his writings that project management was one minor use for Gantt charts. Alford(1924, p. 180), comments that charts: ‘‘ may be equally valuable when applied to things lessconcrete as planning special investigations, and the undertaking of special projects.’’It seems very unlikely that Gantt used charts as we presently use them (ie, bar charts) in1917. Alford (1918), remarks: ‘‘as Gantt realized, the number of rivets driven . . . was abetter than fair index to the percentage completion of the ship.’’ Alford comments: ‘‘. . . he(Gantt) perfected the Gantt chart as a managerial tool, selected rivets driven’ as the unit bywhich to measure progress in the building of ships . . .’’ (Alford, 1934, p. 192) This approachseems consistent with the standard ‘Gantt Chart’ in Fig. 3 above, and therefore it seems thatGantt did not use his charts as modern project managers do; and, the implications of theseremarks is that Gantt may have rejected such a mode of use15.The centrepiece of Gantt’s method involved the scientific investigation and carefulstandardization of the work into tasks. Figure 13 shows a task card with set processes andtimes to manufacture a heavy metal ‘pin’. Once a task had been ‘set’ by an expert16, theexpert was required to provide individual instruction to each worker on how to accomplishthe task, and once they had learnt to perform the task in the set time and to the requiredquality, a bonus was paid in addition to their daily wage.15Another contemporary, discussing operation scheduling for ship building Kimball (1925, p. 149–150) suggests that ‘‘a similar master schedule can be made for each and every large elemententering into constructing a ship .’’ and goes on in the next section of his book to say: ‘‘it is notuncommon to chart all important events for all work on the master schedule . . . The Gantt chart isperhaps the most effective form of such graphical schedules’’ (Kimball, 1925, p. 152). However,none of these actually show a Gantt chart for a project and it is unclear if the author is referring tocharts developed by Gantt, or to simple bar charts.Alford, L.P., 1918. An industrial achievement of the war. Industrial Management 55 (2), 97–100.Alford, L.P., 1924. Management’s Handbook. The Ronald Press Co., New York.Alford, L.P., 1934. Henry Laurence Gantt: Leader in Industry. The American Society of Mechanical Engineers,New York.Kimball, D.S., 1925. Principles of Industrial Organization. McGraw-Hill Book Company, Inc., New York.16‘Setting a task’ involved an experienced and skilled workman determining the best way toaccomplish the work and the optimum time needed for each step in the process.14 of 18www.mosaicprojects.com.au
Henry L Gantt,A retrospective view of his workFigure 13 A timed job card – the worker was taught how to achieve the ‘set times’ to earn his bonus.Gantt recognised incentives are a far more powerful motivator then penalties. He describedhis approach as “a system of education for the workforce, with a bonus for those wholearned!” It proved highly effective generating sustained productivity improvements well inexcess of 100%.Gantt’s system also interconnected the reward paid to
Henry Laurence Gantt, A.B., M.E. was an American mechanical engineer and management consultant who is best known for developing the Gantt chart in the 1910s. However, the charts Henry Gantt developed and used are nothing like the charts that are erroneously referred to as 'Gantt Charts' by modern project managers.