Transcription
JIDE Gantt Chart Developer GuideContentsPURPOSE OF THIS DOCUMENT . 1FEATURES . 1JIDE GANTT CHART . 2OVERVIEW OF JIDE GANTT CHART APIS . 3GANTTENTRY . 3GANTTMODEL . 3DEFAULTGANTTMODEL. 5GANTT CHART . 5Markers . 5GANTTCHARTPANE . 5SCALEMODEL . 6SCALEAREA . 7MOUSE AND KEYBOARD SUPPORT IN GANTTCHART . 7MOUSE . 7KEYBOARD . 8INTERNATIONALIZATION SUPPORT . 10Purpose of This DocumentA Gantt chart is a graphical representation of the duration of tasks against the progressionof time. It is a useful tool for planning and scheduling projects. A Gantt chart is helpful whenmonitoring a project's progress.JIDE Gantt Chart is a pure Java Swing library that makes it possible to create a Gantt chartinside your Swing application. Just like many other components from JIDE, it provides all thebasic features and a lot of APIs for you to further customize for your application.FeaturesHere are the main features of JIDE Gantt Chart.v Tree table view and GanttChart view side by side.v Supports mouse interactive to change starting date, ending date and completion of thetask entry
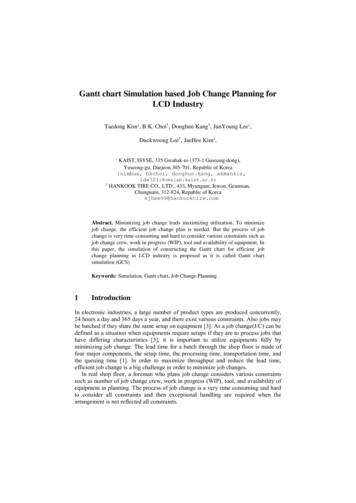
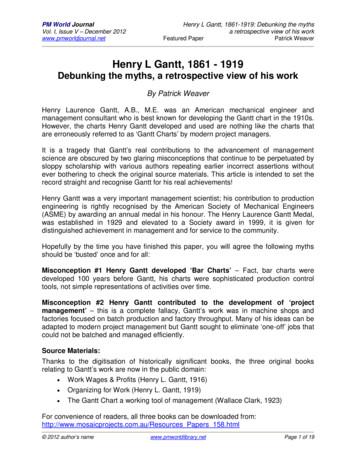
COPYR IGHT 2002-2011 J IDE SOFTWARE . ALL R IGHTS RESERVEDv GanttEntryRenderer support. User can write one’s own renderer to render the Ganttentry and entry group on the GanttChart.v GanttLabelRenderer support. User can write one’s own renderer to render the label forthe Gantt entry on the GanttChart.v Keyboard navigation supported.v Entry group supported.v Multiple levels of periods on the scale area.v Period format support on the scale area.v Zoom in and zoom out.v Entry relationship supported.v Support both numeric and date as the periodv Context menu supported.JIDE Gantt ChartHere is what a Gantt chart looks like under Window L&F under Office 2007 style.Figure 1 JIDE Gantt ChartOn the left hand side, there is TreeTable from JIDE Grids.2
COPYR IGHT 2002-2011 J IDE SOFTWARE . ALL R IGHTS RESERVEDOverview of JIDE Gantt Chart APIsGanttEntryGanttEntry is an interface representing an entry in a Gantt chart. It has a name, a range (i.e.the starting date and the ending date) and a completion percentage. GanttEntry only has gettersfor those properties. GanttEntry extends ExpandableRow which means it can be used inside aTreeTableModel, a model defined in the JIDE Grids product.MutableGanttEntry interface extends GanttEntry and adds setters for those properties.DefaultGanttEntry implements the MutableGanttEntry and provides the getters/setters forall the properties.Please note, there is no separate class for the Gantt entry group. If a GanttEntry haschildren, it automatically becomes an entry group and will be rendered as a group in the UI. If aDefaultGanttEntry is rendered as a group, it will update its range automatically to the union ofthe ranges of all its child entries.If the range has the same start and end, it will be rendered as a milestone.GanttModelGanttModel contains a list of GanttEntries. Since an entry could have children entries, itforms a tree hierarchy. Here are the three main methods on GanttModel interface./*** Gets the total entry count.** @return the total entry count.*/int getEntryCount();/*** Gets the entry at the entry index.** @param index the entry index.* @return Returns the GanttEntry at the index or null if the index is out of bounds.*/S getEntryAt(int index);/*** Gets the index of the entry.** @param entry the entry* @return the index.*/int getIndexOf(S entry);Note the generic type S is defined as extending from GanttEntry. In the other word, userscan define their own subclass of GanttEntry and use it inside GanttModel.GanttModel also defined several sub-models. They are TreeTableModel, ScaleModel andGanttEntryRelationModel./**3
COPYR IGHT 2002-2011 J IDE SOFTWARE . ALL R IGHTS RESERVED* @return The TreeTableModel to be displayed in the TreeTable of the GanttChartPane.*/ITreeTableModel S getTreeTableModel();/*** Gets the ScaleModel.** @return the ScaleModel.*/ScaleModel T getScaleModel();/*** Gets the model that defines the relationship among gantt entries.** @return the GanttEntryRelationModel.*/GanttEntryRelationModel T, S getGanttEntryRelationModel();The TreeTableModel is the same model that is used by TreeTable in JIDE Grids product. SinceTreeTableModel is a tree hierarchical data model that supports filtering and sorting, we decideto leverage it as Gantt entries are also represented in a hierarchical data model and also needfiltering and sorting. Since we will use this TreeTableModel and display it in a TreeTable in thecase of GanttChartPane, so using TreeTableModel seems like a good choice.The ScaleModel provides information needed to display different scales in the ScaleArea.The model provides functions to map an instant in the base unit to a position on a long scale.The GanttEntryRelationModel defines relationships between two entries. There are fourtypes of relationships that are defined as constants on GanttEntryRelation. In order to explainthe relation, we call the first entry the predecessor entry and the second entry the successorentry. Please note, the line that represents the relation always draws from the predecessorentry to the successor entry.·ENTRY RELATION FINISH TO START: The successor entry cannot begin until the taskthat it depends (the predecessor entry) on is complete.·ENTRY RELATION START TO START: The successor entry cannot begin until the taskthat it depends (the predecessor entry) has begun.·ENTRY RELATION FINISH TO FINISH: The successor entry cannot be completed untilthe task that it depends on (the predecessor entry) is completed.·ENTRY RELATION START TO FINISH: The successor entry cannot be completed untilthe task that it depends on (the predecessor entry) begins.4
COPYR IGHT 2002-2011 J IDE SOFTWARE . ALL R IGHTS RESERVEDIn JIDE Gantt Chart, we display the four relations of the entries but we didn’t enforce them.You would still need to implement the logic in your code.DefaultGanttModelAlthough you can implement your own GanttModel, most likely you will stay withDefaultGanttModel, which is a default implement we provided for GanttModel interface.DefaultGanttModel allows you to define the period unit type and the GanttEntry type asgeneric. In the example code below, we created a DefaultGanttModel whose period unit type isDate and the GanttEntry is DefaultGanttEntry.DefaultGanttModel Date, DefaultGanttEntry Date model new DefaultGanttModel Date,DefaultGanttEntry Date ();model.setScaleModel(new DateScaleModel());Gantt ChartOnce you have the GanttModel created, creating a GanttChart is very simple.GanttModel T, S ganttModel ;GanttChart T, S chart new GanttChart T, S ();chart.setModel(ganttModel);MarkersThe GanttChart can be customized with background painter to mark certain range orperiods, for example to mark the weekends on the chart. The IntervalMarker can be used tomark any interval or instant on the scale, while the AbstractPeriodMarker can be used to markthe periods.See the GanttChartDemo for examples of IntervalMarker and DatePeriodMarker.GanttChartPaneIn addition to GanttChart, we also create a class called GanttChartPane. This is a pane thathas both a TreeTable and a GanttChart.GanttModel T, S ganttModel ;GanttChartPane ganttChartPane new GanttChartPane Integer, GanttEntry Integer (ganttModel);5
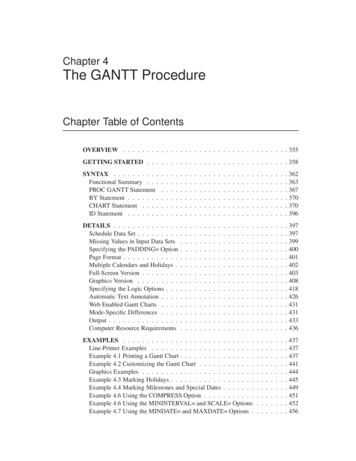
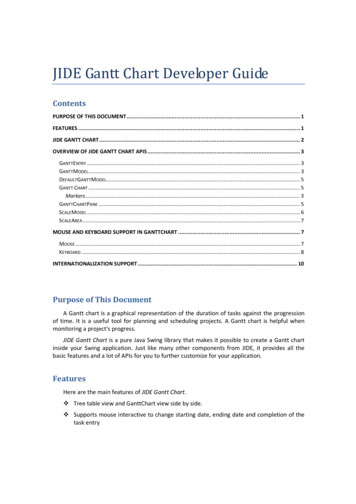
COPYR IGHT 2002-2011 J IDE SOFTWARE . ALL R IGHTS RESERVEDBy default, the TreeTable has five columns as shown above. However you can customize itby creating your TreeTableModel. See below for a screenshot from ProjectGanttChartDemowhich is one of the demos on Gantt chart.ScaleModelThe ScaleModel is an interface to provide the GanttChart with information how to translatethe GanttEntry range to positions on a long scale. It also defines the available periods and howthey map to intervals on the long scale.If you implement your own ScaleModel, it is important to follow the invariants specified inthe Javadoc of the ScaleModel – especially that period intervals always ends at the same instantwhere the next period interval begins. But typically a GanttChart deals with time for which theDateScaleModel is provided to map java.util.Date to a millisecond long scale.6
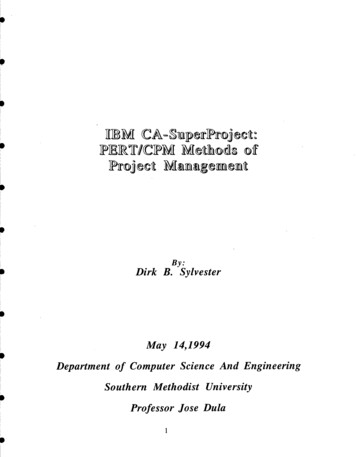
COPYR IGHT 2002-2011 J IDE SOFTWARE . ALL R IGHTS RESERVEDYou can customize the available periods of by providing the appropriate DatePeriods to theDateScaleModel constructor (always from the smallest to the largest). If the predefined periodsdo not include the period you want, you can specify your own DatePeriod as below. Note that ifyou want irregular periods, you’ll need to create or extend your own custom ScaleModel whichcorrectly implements getPeriodStart/End and calculatePeriods for that period.// A fiscal year which starts in July instead of JanuaryDatePeriod fiscalYear new DatePeriod(Calendar.MONTH, 12, Calendar.JULY);DateScaleModel scaleModel new DateScaleModel(DatePeriod.DAY OF WEEK,DatePeriod.WEEK OF YEAR,DatePeriod.MONTH,fiscalYear);// don’t forget to add a PeriodConverter for your new periodscaleArea.setPeriodConverter(fiscalYear,new DatePeriodConverter("Fiscal Year",new SimpleDateFormat("'FY' yyyy"),new SimpleDateFormat("'Fiscal Year' yyyy")));ScaleAreaThe ScaleArea is the header of the Gantt chart and can show the scale in differentgranularities. It allows the user to pick from the available periods defined in the ScaleModel andzoom the GanttChart in and out. The default setup of the ScaleArea can be customized bysetting the visible periods, the start and end instants and the preferred visible periods count andsize to control the preferred width of the GanttChart.ScaleAreaPopupMenuCustomizers can be installed on the ScaleArea to provide a contextsensitive popup menu depending on which period is clicked. By default the resize periods andthe visible periods’ popup menu customizers are installed.For each period, a PeriodConverter can be set on the ScaleArea to control the text andtooltip of that period. DateGanttChartPane configures the ScaleArea with PeriodConverters forthe default DatePeriods.By default if the GanttChart is used in a GanttChartPane, we will renderer the periodheaders using the TableHeader of the TreeTable for a consistent look and feel. If you replace thetable header of the TreeTable, special care might need to be taken so the ScaleArea renderscorrectly. See the ProjectGanttChartDemo for an example.Mouse and Keyboard Support in GanttChartMouseIn addition to mouse click, press and drag to select the rows in GanttChart, GanttChart alsosupports mouse zoom and mouse editing. If you put the mouse over the entry, there are fourpossible actions depending on where the mouse is: move, resize upper range, resize lowerrange, and change completion. The cursor will change shape to tell you which action it will takewhen the mouse is pressed and dragged.7
COPYR IGHT 2002-2011 J IDE SOFTWARE . ALL R IGHTS RESERVEDThe mouse wheel will scroll up and down the GanttChart without any modification keys.When the CTRL is pressed and hold, mouse wheel will zoom in and out the GanttChart.There is also a panning mode which you can set using GanttChart#setViewMode. Oncesetting to panning mode, mouse movement will pan the GanttChart. This is useful when theGanttChart is in view-only (not editable).KeyboardWhen GanttChart has focus, you can use keyboard to navigate the GanttChart. Here are thelist of keystrokes that GanttChart supports.KeyboardActionDOWN or KP DOWNselectNextRowshift DOWN orselectNextRowExtendSelectionshift KP DOWN orctrl shift DOWN orctrl shift KP DOWNctrl DOWN orselectNextRowChangeLeadctrl KP DOWNUP or KP UPselectPreviousRowshift UP orselectPreviousRowExtendSelectionshift KP UP orctrl shift UP orctrl shift KP UPctrl UP or ctrl KP ft HOME orselectFirstRowExtendSelectionctrl shift HOMEctrl HOMEselectFirstRowChangeLeadENDselectLastRowshift END orselectLastRowExtendSelection8
COPYR IGHT 2002-2011 J IDE SOFTWARE . ALL R IGHTS RESERVEDctrl shift ENDctrl ENDselectLastRowChangeLeadPAGE UPscrollUpshift PAGE UP orscrollUpExtendSelectionctrl shift PAGE UPctrl PAGE UPscrollUpChangeLeadPAGE DOWNscrollDownshift PAGE DOWN orscrollDownExtendSelectionctrl shift PAGE DOWNctrl PAGE ft hift ENTERselectPreviousRowCellctrl A orselectAllctrl SLASHctrl BACK SLASHclearSelectionSPACEaddToSelectionctrl SPACEtoggleAndAnchorshift SPACEextendToctrl shift SPACEmoveSelectionToctrl EQUALSzoomInPeriodsctrl MINUSzoomOutPeriods9
COPYR IGHT 2002-2011 J IDE SOFTWARE . ALL R IGHTS RESERVEDInternationalization SupportAll Strings used in JIDE Gantt Chart are contained in one properties file calledgantt.properties under com/jidesoft/gantt and scale.properties under com/jidesoft/scale. Someusers contributed localized version of this file and we put those files inside jide-properties.jar. Ifyou want to support languages other than those we provided, just extract this properties file,translated to the language you want, add the correct postfix and then jar it back into jideproperties jar. You are welcome to send the translated properties file back to us if you want toshare it.10
A Gantt chart is a graphical representation of the duration of tasks against the progression of time. It is a useful tool for planning and scheduling projects. A Gantt chart is helpful when monitoring a project's progress. JIDE Gantt Chart is a pure Java Swing library that makes it possible to create a Gantt chart inside your Swing application.