Transcription
Bar Charts (Gantt Charts),Resource Histograms, andS-CurvesDr. Mohammad S. El-MashalehDept. of Civil Eng.Hashemite UniversityConstruction Project ManagementDr. Mohammad El-Mashaleh1Bar charts (Gantt charts) Like we said before, bar charts are theoldest scheduling technique Found by Henry GanttDept. of Civil Eng.Hashemite UniversityConstruction Project ManagementDr. Mohammad El-Mashaleh21
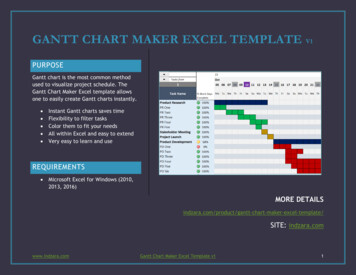
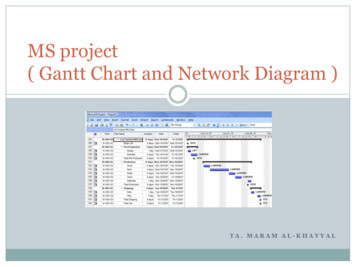
Consists of horizontal bars and a timescale Each bar represents an activity, with thebar length represents its durationDept. of Civil Eng.Hashemite University Construction Project ManagementDr. Mohammad El-Mashaleh3In addition to the activity bars and the time scale,most bar charts contain data in columnsInformation may include: durations, resources, costs,other (customized)Note that activities in this bar chart example areordered in their ESDept. of Civil Eng.Hashemite UniversityConstruction Project ManagementDr. Mohammad El-Mashaleh42
Advantages of bar charts Easily constructed for small or simple projects Reviewers of the bar chart do not need anyspecial knowledge to understand: The status of the project What is expected to be accomplished in thenext few time periods When the project is expected to endDept. of Civil Eng.Hashemite UniversityConstruction Project ManagementDr. Mohammad El-Mashaleh5 Disadvantages: Do not typically show logic (logic is notobvious) For example, determine the dependency ofF&EDept. of Civil Eng.Hashemite UniversityConstruction Project ManagementDr. Mohammad El-Mashaleh63
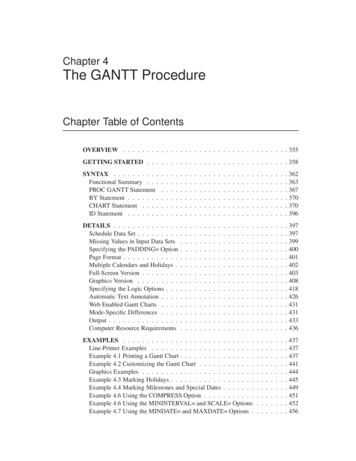
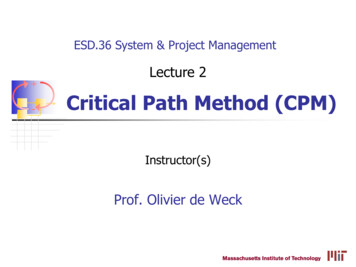
Example 1Dept. of Civil Eng.Hashemite UniversityConstruction Project ManagementDr. Mohammad El-Mashaleh7Histograms and s-curves Histograms are period representation ofresource needs or use S-curves (cumulative curves) show the sameinformation on an accumulated basis Resources that are usually shown inhistograms and s-curves include: number oflabor, labor hours, dollarsDept. of Civil Eng.Hashemite UniversityConstruction Project ManagementDr. Mohammad El-Mashaleh84
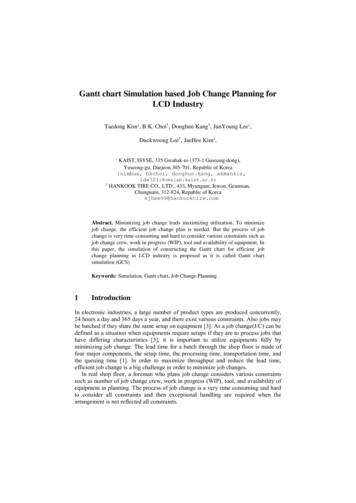
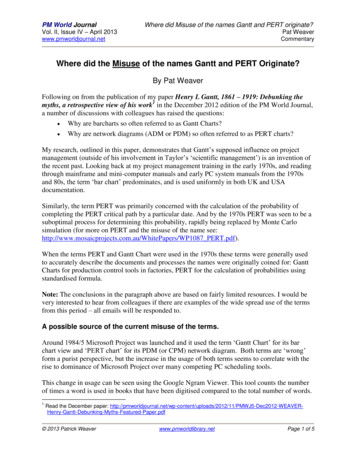
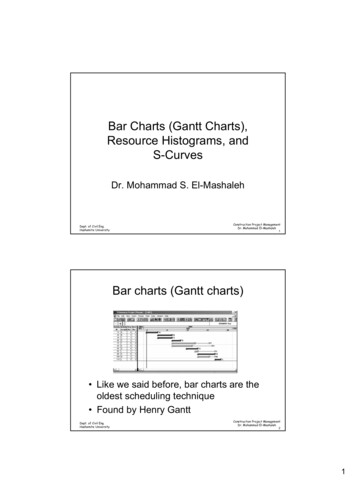
Bar chart and histogramAlthough resourcesneed not beallocated uniformlythroughout theduration of anactivity, thedemonstration hereis based on uniformdistributions ofresourcesDept. of Civil Eng.Hashemite UniversityConstruction Project ManagementDr. Mohammad El-Mashaleh9S-CurveDept. of Civil Eng.Hashemite UniversityConstruction Project ManagementDr. Mohammad El-Mashaleh105
Histogram use The histogram helps us to identify periods whenresources are being used “ineffectively” For example, based on the above histogram, we canidentify periods of “low-resource” use and periods of“high-resource” useDept. of Civil Eng.Hashemite UniversityConstruction Project ManagementDr. Mohammad El-Mashaleh11 The next step for us is to use “resource allocation” or“resource leveling” techniques to improve our resourcehistogram One common technique is called the Minimum MomentAlgorithm ApproachDept. of Civil Eng.Hashemite UniversityConstruction Project ManagementDr. Mohammad El-Mashaleh126
S-curve use Used to predict number or size ofresources over the life of the project Also used to compare planned(budgeted) resources with actual onesDept. of Civil Eng.Hashemite UniversityConstruction Project ManagementDr. Mohammad El-Mashaleh13 Plotting both s-curves is used to control,make comparisons, and prepare betterforecasts in the futureDept. of Civil Eng.Hashemite UniversityConstruction Project ManagementDr. Mohammad El-Mashaleh147
Examples 2 & 3Dept. of Civil Eng.Hashemite UniversityConstruction Project ManagementDr. Mohammad El-Mashaleh158
Bar Charts (Gantt Charts), Resource Histograms, and S-Curves Dr. Mohammad S. El-Mashaleh Dept. of Civil Eng. Hashemite University Construction Project Management Dr. Mohammad El-Mashaleh 2 Bar charts (Gantt charts) Like we said before, bar charts are the oldest scheduling technique Found by Henry Gantt