Transcription
MS project( Gantt Chart and Network Diagram )TA. MARAM AL-KHAYYAL
Outline Project Scope Management: Create a new project file. Developing a Work Breakdown Structure (WBS). Saving project files Project Time Management: Entering Task Durations. Establishing Task Dependencies. Gantt Charts. Network Diagrams. Critical Path Analysis.
Create a new project file Open the Project Information dialog box:Click project on the menu bar, and then click Project Informationto display the project information dialog box.
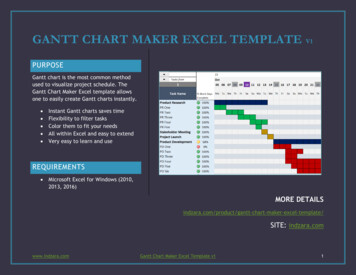
Developing a Work Breakdown StructureOrder1234567891011121314151617181920Task NameInitiatingKickoff meetingDevelop project charterCharter signedPlanningDevelop project plansReview project plansProject plans m implementedControllingReport performanceControl changesClosingPrepare final project reportPresent final projectProject completed
Creating a Summary Tasks
Numbering Tasks
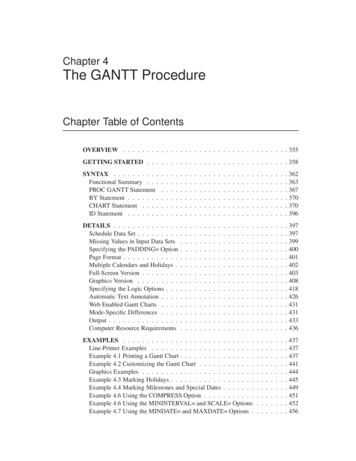
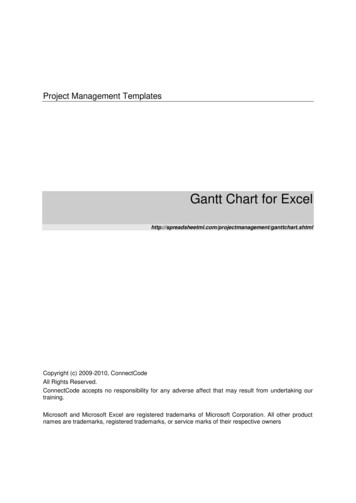
Entering Task Durations When you enter a task, Project 2007 automaticallyassigns to it a default duration of one day, followed bya question mark.
Entering Task DurationsOrderTask Name1Initiating234Kickoff meetingDevelop project charterCharter signedPlanning2h10d03w4m9Develop project plansReview project plansProject plans ignImplementationSystem implementedControllingReport performanceControl changesClosingPrepare final project reportPresent final projectProject completed1m2m1m05678Durations05m5m2w1w0
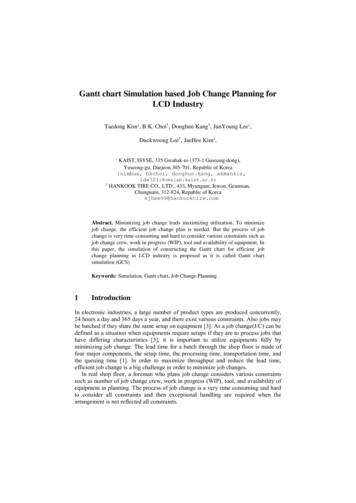
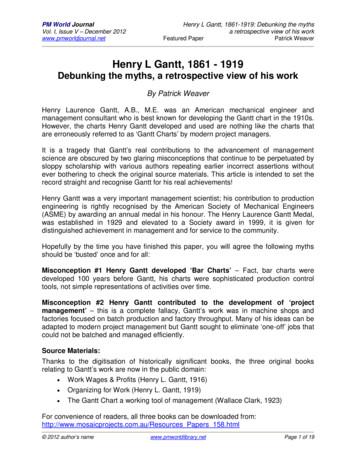
Establishing Task Dependencies MS Project is used to adjust schedules automaticallyand to do critical path analysis, so we must determinethe dependencies or relationships among tasks.
Establishing Task DependenciesOrderTask Name1Initiating234Kickoff meetingDevelop project charterCharter signedPlanning5Predecessors23459Develop project plansReview project plansProject plans ignImplementationSystem implementedControllingReport performanceControl changesClosingPrepare final project reportPresent final projectProject completed81011126785131819
Gantt Charts A Gantt chart is a standard format for displayingproject schedule information that lists project task andtheir corresponding start and finish dates in acalendar format. It shows each task as a horizontal bar with thelength and position corresponding to the timescale atthe top of the Gantt Chart. It is the default view to the right of the Entry table.
Gantt Charts To adjust the timescale, Click the Zoom out button orthe Zoom In button.
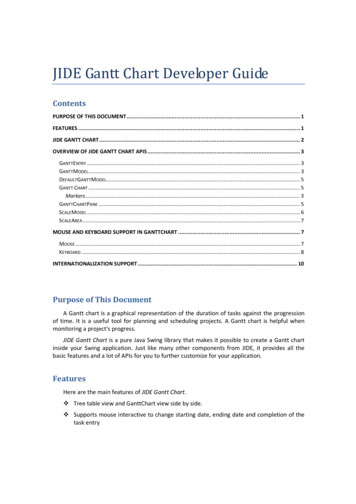
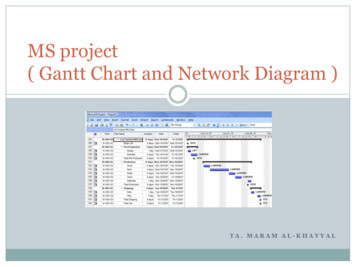
Network Diagrams Network diagram is the schematic display of thelogical relationships or sequencing of project activities. Present each task as a box with linking lines betweentasks to show sequencing. How to represent Network diagram? View the network diagram. Click View on the Menu bar and thenselect Network Diagram from the view menu.
Network Diagrams
Critical Path After entering task dependencies, we can find thecritical path for the Project Tracking Database project. What is the Critical Path? It represents the shortest possible time to complete theproject. How to represent the Critical Path? Open the Gantt Chart Wizard. Click Format on the Menu barand then select Gantt Chart Wizard.Select the Critical Path option. Click the Critical Path radio button.The critical path is represented in Red.
Gantt Charts A Gantt chart is a standard format for displaying project schedule information that lists project task and their corresponding start and finish dates in a calendar format. It shows each task as a horizontal bar with the length and position corresponding to the timescale at the top of the Gantt Chart.