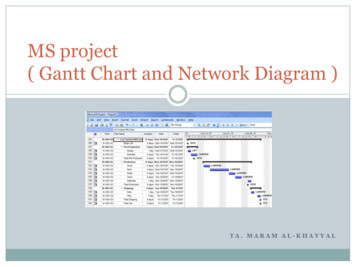
Transcription
Gantt chart Simulation based Job Change Planning forLCD IndustryTaedong Kim1, B.K. Choi1, Donghun Kang1, JunYoung Lee1,Duckwoong Lee1, JaeHee Kim2,1KAIST, ISYSE, 335 Gwahak-ro (373-1 Guseong-dong),Yuseong-gu, Daejeon 305-701, Republic of Korea{nimbus, bkchoi, donghun.kang, akmankis,ldw721}@vmslab.kaist.ac.kr2HANKOOK TIRE CO., LTD., 433, Myungam, Jewon, Geumsan,Chungnam, 312-824, Republic of Koreakjhee99@hankooktire.comAbstract. Minimizing job change leads maximizing utilization. To minimizejob change, the efficient job change plan is needed. But the process of jobchange is very time-consuming and hard to consider various constraints such asjob change crew, work in progress (WIP), tool and availability of equipment. Inthis paper, the simulation of constructing the Gantt chart for efficient jobchange planning in LCD industry is proposed as it is called Gantt chartsimulation (GCS)Keywords: Simulation, Gantt chart, Job Change Planning1IntroductionIn electronic industries, a large number of product types are produced concurrently,24 hours a day and 365 days a year, and there exist various constraints. Also jobs maybe batched if they share the same setup on equipment [3]. As a job change(J/C) can bedefined as a situation when equipments require setups if they are to process jobs thathave differing characteristics [3], it is important to utilize equipments fully byminimizing job change. The lead time for a batch through the shop floor is made offour major components, the setup time, the processing time, transportation time, andthe queuing time [1]. In order to maximize throughput and reduce the lead time,efficient job change is a big challenge in order to minimize job changes.In real shop floor, a foreman who plans job change considers various constraintssuch as number of job change crew, work in progress (WIP), tool, and availability ofequipment in planning. The process of job change is a very time consuming and hardto consider all constraints and then exceptional handling are required when thearrangement is not reflected all constraints.
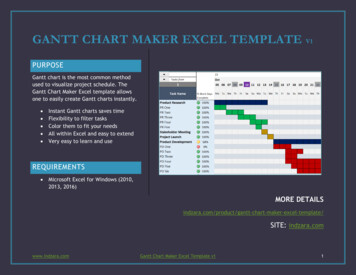
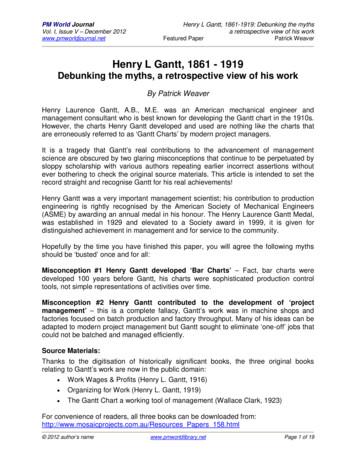
Gantt chart is a graphical representation of the tasks and resources needed tocomplete a job or project. It may show ranges of possible start and end dates and therelationships between tasks [4]. Most people use a Gantt chart in planning and theGantt chart is very useful and flexible to evaluate and edit the plan. In this paper, thesimulation of constructing the Gantt chart for efficient equipment arrangement inprocess industries is proposed as it is called Gantt chart simulation (GCS) A Ganttblock that is a basic model of Gantt chart simulation is defined with its operations andthen the framework of Gantt chart simulation and its detailed algorithms aredescribed. Also given in this paper is an illustrative application example that isimplemented the GCS as a daily planning system in a tire industry. As the proposedframework is quite general in that the Gantt chart is very flexible, it might be suitablefor process industries such as FAB.Basic models of Gantt chart simulation and its operations are given in the nextsection, and the framework of GCS with detailed algorithm is presented in Section 3.An application example is given in the Section 4 and conclusion and discussion isprovided in the final section.2Concept of Gantt chart SimulationThe basic concept of GCS is the simulation of constructing the Gantt chart using basicblocks. To simulate the Gantt chart, it is necessary to define a simulation model whichrepresents basic elements of the Gantt chart and constraints that are needed toconstruct the Gantt chart. The operations of the simulation model are also defined.2.1Basic model of Gantt chart SimulationBasic element of Gantt chart and the constraints such as equipment availability, crewavailability and WIP availability are defined.FLFU(First lot (First lotJS(J/C Start)LU(Last lot Unloading)Loading) Unloading)JCFLPRLPJ/C End[1] Gantt blockStep b(previous step ofstep c)AvailabilityEquipment1 1(t0,1)(t1,0)(t2,1)time[2] Equipment availability ProfileAvailabilityCrew Group1WIP level(loading quantityof step b)WIP Profile ofBatch1, step c2(t0,1)Availabilitytimetime[3] Crew group availability ProfileStep c first lot arrival timeStep c last lot arrival time[4] WIP availability Profile
Gantt chart Simulation based Job Change Planning for LCD Industry3Fig. 1. Basic model of GCS2.1.1 Gantt block (G) Gantt block is a basic element which constructs the Ganttchart. The Gantt block has time information and arrangement information.whereJSG: J/C Start time of GFLG: First lot Loading time of GFUG: First lot Unloading time of GLUG: Last lot Unloading time of GlQG: loading Quantity of GlFG: loading Flow rate of GlBG: loading Batch of GlSG: loading Step of GlEG: loading Equipment of GLot is a basic unit of transfer and loading flow rate is a production quantity perhour in the Gantt block. The loading flow rate is defined as.In the Gantt block, some activities such as JC (Job Change), FLP (First LotProcessing) and RLP (Remaining Lot Processing) can be defined. The Gantt blockdoes not contain idle time. That is, the Gantt block does not represent starving ofequipment. Starving condition is represented by several Gantt block2.1.2 Equipment availability Profile (EP) Equipment availability Profile (EP)shows availability information of the equipment with time. EP consists ofEquipment-Segments (ES) which have same equipment id.whereEES: Equipment id of ESEGES: Equipment Group of ESTES: Time of ESAES: Availability level of ESThe ES is created when the equipment loads or unloads a block. It containsequipment id, equipment Group, loading or unloading time of the block and
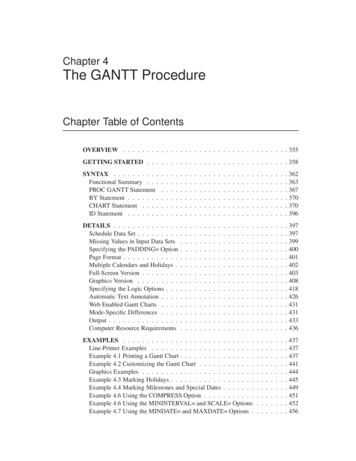
availability level of equipment with the time. Availability level has 0 when T isloading time, 1 when T is unloading time.2.1.3 Crew availability Profile (CP) Crew availability Profile (CP) showsavailability information of J/C crew with time. CP consists of Crew-Segments(CS) which have same crew group.whereCGCS: Crew Group of CSTCS: Time of CSACS: Availability level of CSThe CS is created when the J/C starts or ends. It contains crew group information,start or end time of J/C, availability level of crew with the time.2.1.4 WIP availability Profile (WP) WP shows accumulated quantity with timewhich arrives from previous step to this step. WP consists of WIP-Segments(WS) which have same batch id and step idwherelBWS: loading Batch of WSlSWS: loading Step of WSFWS: Flow rate of WSTWS: Time of WSAWS: Availability level of WSThe WS is created when the lot from previous step starts to arrive in this step andwhen the lot ends arrival. Therepresents accumulated quantity with the time. Therepresents arrival rate from previous step and it is same with flow rate ofprevious step.2.2Basic Concept of Gantt chart simulationGantt chart simulation concept is constructing Gantt chart of EQP using IncomingWIP Profile. First, the WIP Profile is initialized, according to the profile, ConsumingProfile is constructed. Creation of Consuming Profile means constructing Gantt chart.
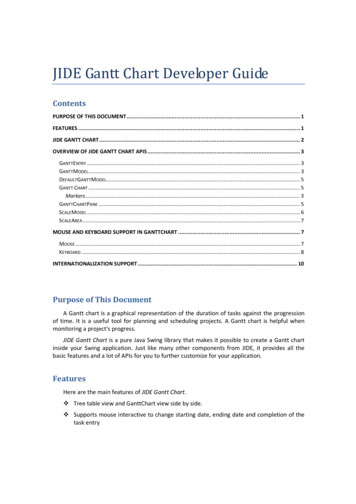
Gantt chart Simulation based Job Change Planning for LCD Industry5WIPlevelIncoming / Consuming ProfileIncoming Profile (IP)Consuming Profile (CP)시간(t)Remaining Lot ProcessingGantt ChartRemaining Lot ProcessingFig. 2. Concept of Gantt chart simulation3Application: LCD VI Job Change PlanningIn this section, application of GCS to LCD Industry is introduced. VI (VisualInspection) process in LC FAB is target process. VI process has some constraints andcount of the equipment is more than 10. VI Job Change Plan is created by foreman atevery shift. It takes 30minutes to 1 hour.TFTCFLCModuleLine
Fig. 3. LC-FAB LayoutTable 1. GCS InformationCategoryInputInformationRelease PlanWIPEQP Loading StateReferenceBOP (Bill Of Process) of DevicesEQP Standard InformationConstraintsJ/C Crew InformationEQP Loadable Relation3.1DescriptionRelease plan of PI process which is firstprocess in LC FABWIP State of processesLoading device informationof equipmentsSequence of processesSetup time, tact time, flow timeof equipmentsJob Change Crew which executes JobChangeLoadable information between device andequipmentBasic Operation in VI job change planningBasic operation of VI Job Change Planning is following3.1.1 Allocation If WIP is accumulated more than specific values, available EQP isadditional assigned.WIP leveln 3Incoming Profile (IP)Consuming Profile (CP)n 2: Allocation Pointn : Count of EQPTime (t)Fig. 4. Allocation3.1.2 Release If count of loading EQP is more then 2, equipment is released atspecific point before consuming all WIPWIP leveln 1n 2Incoming Profile (IP)Consuming Profile (CP)α 2: Release Pointn : Count of EQPTime (t)
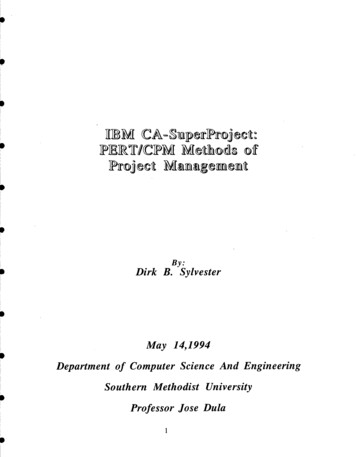
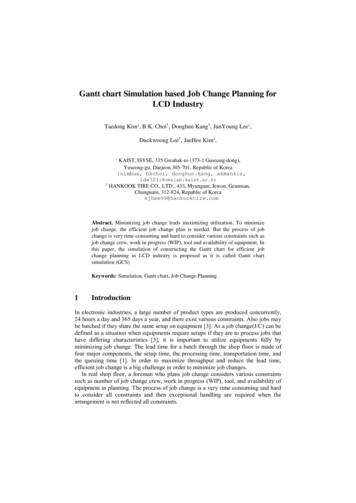
Gantt chart Simulation based Job Change Planning for LCD Industry7Fig. 5. Release3.1.3 End If single loading EQP exist, equipment is released at specific point whichis consuming all WIPWIP leveln 1Incoming Profile (IP)Consuming Profile (CP): End Pointn : Count of EQPTime (t)Fig. 6. End3.2Algorithm of VI Job Change PlanningVI job change planning algorithm is following. First loading equipment count ischecked and then check allocation, release, keeping case. Diamond box is decisionnode and box node is action node. Action is loading / unloading activity such asallocation, release, end, initial allocation, keeping.(Count of EQP alAllocationAllocation(Count of EQP 1)AllocationConfirmAllocationConfirmNone(Machine Count 1)ConfirmRelease(End)EndConfirmNone(Machine Count 2)(Machine Count 1)KeepingConfirmKeepingNone(Machine Count 2)ReleaseEndReleaseConfirmNoneEOS?ConfirmEndFig. 7. Algorithm4Application: LCD VI Job Change PlanningThe GCS is applied to LCD VI job change planning. The plan is planned by aforeman at every shift. Figure x show two Gantt charts which are simulation result
and actual result. The two Gantt charts are similar and shift moving quantity is almostsame. Figure x shows the result.EQP rate of operation / Net WIP ProfileDevice Incoming WIP ProfileDevice Net WIP ProfileShift MovingFig. 8. KPI Viewer5ConclusionsFor efficient job change planning in LCD industries, basic model and operations ofGCS are introduced. Recently, the project with a LCD and tire company which isrelated to equipment arrangement using GCS is in progress. And it is showed thatillustrative application example that is implemented in LCD industry. As GCS hasflexible and general data structure, it might be suitable for other industry such as tireindustry. But GCS needs to reflect other constraints such as tool capacity, finite WIPcapacity.Job change plan from GCS can be used at shop floor directly. It can be also usedas input of short-term scheduling system. Out research team propose 3-layerarchitecture of simulation-based FAB operation management. GCS is middle part ofthat 3-layer architecture. In that case, short-term scheduling system has guidelinewhich provides job change plan of bottleneck equipment.6References1. Alfred Bauer, A. Bauer “Shop floor control systems: from design to implementation”, 19942. B.K.Choi, D.H. Kim, H. Hwang "Gantt Chart Based MES for Die and Mold Manufacturing"Proc. of IFIP WG 5.7 Conf. on Managing Concurrent Manufacturing, Seattle, USA, p105114, 19953. Chris n. Potts, Mikhail Y.Kovalyov “Scheduling with batching: A review” European Journalof Operational Research 120, p228-249, 20004. Gantt chart Information, http://en.wiktionary.org/wiki/Gantt chart
Gantt chart is very useful and flexible to evaluate and edit the plan. In this paper, the simulation of constructing the Gantt chart for efficient equipment arrangement in process industries is proposed as it is called Gantt chart simulation (GCS) A Gantt block that is a basic model of Gantt chart simulation is defined with its operations and .