Transcription
MEASURING RACIAL EQUITYIN THE FOOD SYSTEM:ESTABLISHED ANDSUGGESTED METRICSMAY 2019
MEASURING RACIAL EQUITY IN THE FOOD SYSTEM:ESTABLISHED AND SUGGESTED METRICSTABLE OF CONTENTSINTRODUCTION4FOOD ACCESS7Food Security and Hunger . 7Food at Schools and Early Childhood Education Sites. 9Community Food Environment.11Food Education .16FOOD AND FARM BUSINESS17Ownership of Land and Means of Production .17Business Support .19FOOD CHAIN LABOR22Income and Benefits .22Upward Mobility and Career Opportunities .25Labor Protections .28FOOD MOVEMENTMSU CENTER FOR REGIONAL FOOD SYSTEMS // MEASURING RACIAL EQUITY IN THE FOOD SYSTEM: ESTABLISHED AND SUGGESTED METRICS302
MEASURING RACIAL EQUITY IN THE FOOD SYSTEM:ESTABLISHED AND SUGGESTED METRICSAuthorsAcknowledgementsSarah Rodman-Alvarez, PhD, MPHSocial Impact Consultantsarahrodmanalvarez.comThank you to the following people forproviding valuable insight and suggestionson the racial equity metrics list:Kathryn Colasanti, MSSpecialistCenter for Regional Food Systems (CRFS),Michigan State UniversityPatrice Brown, Detroit Eastern MarketSuggested CitationWinona Bynum, Detroit Food Policy CouncilElsadig Elsheikh, The Haas Institutefor a Fair and Inclusive Society atUniversity of California, BerkeleyClare Fox, Los Angeles Food Policy CouncilRodman-Alvarez, S. & Colasanti, K. (2019)Measuring Racial Equity in the Food System:Established and Suggested Metrics. EastLansing, MI. Michigan State University Centerfor Regional Food Systems. Retrieved -racial-equity-in-the-food-systemBreanna Hawkins, Los AngelesFood Policy CouncilFor more information, please contactKathryn Colasanti at colokat@msu.edu.Colleen McKinney, Center forGood Food PurchasingZoe Hollomon, Community EconomicDevelopment ConsultantMohammad Yusri Jamaluddin, MichiganState University ExtensionJanee Moore, Michigan State Departmentof Health and Human ServicesTeofilo Reyes, RestaurantOpportunities Center UnitedThank you also to the members ofthe Michigan Good Food SharedMeasurement Advisory Committee forreviewing an earlier draft of this report.The authors would like to thankAndrea Weiss of CRFS for communicationsguidance and Blohm Creative Partnersfor copyediting and design.Support for this work comes fromthe W.K. Kellogg Foundation.Joann Lo, Food Chain Workers AlliancePhoto CreditsKhalid Ibrahim: Cover center and right,page 17, page 22, and page 30Steve Koss: Cover left, page 6, and page 7MSU CENTER FOR REGIONAL FOOD SYSTEMS // MEASURING RACIAL EQUITY IN THE FOOD SYSTEM: ESTABLISHED AND SUGGESTED METRICS3
MEASURING RACIAL EQUITY IN THE FOOD SYSTEM:ESTABLISHED AND SUGGESTED METRICSIntroductionThe U.S. food system has created andbeen shaped by racial injustices since itsinception. The ways in which racial injusticeis made manifest through our food systemare sometimes quite clear and other timesmurky at best. Data is a powerful tool thatcan either illuminate or obstruct the realityof injustice. Disaggregating data by racecan shed light on systemic oppression.This report identifies metrics related to racialequity in the food system that are either inuse by organizations currently or have beenrecommended, whether in a publication orthrough an interview. By documenting thecurrent landscape in this area, this reportprovides a foundation for the Michigan GoodFood Charter Shared Measurement AdvisoryCommittee to consider and select a set ofmetrics that can be used at state (Michigan)and local levels to track progress towards anequitable food system.1 The metrics in thisreport can also provide a foundation for otherinterested organizations to track progress.To identify metrics presented in thisspreadsheet, over 100 sources were scannedfrom reports and peer-reviewed literaturetouching on race or ethnicity and the foodsystem. Duplicate metrics found in multiplesources were included only once. Personalcommunication (either interviews or emails)with about a dozen food system expertsadded several additional suggested metricsand insight on the structure of the list.Project ScopeTo create a set of metrics that are bothmeaningful and useful, this project focused ondata with explicit ties to food and agriculturein the United States. All of the metrics includedwere chosen in part based on the ability tocompare data by race and ethnicity (whereavailable). This report intentionally does notuse categories that have been used as aproxy for race (e.g. “urban” for populationsof color, or socioeconomic status).There are many systemic factors, includingmyriad racialized policies in the U.S., whichhave contributed to racial inequities in thefood system. The influences of these policiesshow up in the food system and are centralto a comprehensive understanding of racialequity issues in food and agriculture. Forinstance, in areas hard hit by such policies asredlining and lack of neighborhood investment,we often see a shortage of grocery stores.Likewise, patterns in farmland ownershiphave roots in slavery and lack of subsequentreparations. However, the metrics included inthis project focus on the problems specific tofood and agriculture that are often the result ofupstream policies, rather than on those policiesthemselves. For example, we include metricsaround food access but not on redlining, andon land ownership but not on reparations.This focus is simply to keep the scope of thisproject practical, without discounting the deeproots of why things are the way that they are.There are several food system metrics weintentionally chose to exclude from this report: Specific dietary behaviors. Due to themyriad and subjective nature of dietarybehaviors and of defining “healthy” food, aswell as the complex ways that inequity anddisadvantage impact hunger and diet,2 thisproject focused on inequities in access tofood rather than measures of food behavior.Oftentimes, recommendations for a “healthy”diet have been racially tone deaf (e.g., theMSU CENTER FOR REGIONAL FOOD SYSTEMS // MEASURING RACIAL EQUITY IN THE FOOD SYSTEM: ESTABLISHED AND SUGGESTED METRICS4
federal government’s recommendationto consume at least 3 cups a day ofmilk while 75% of African-Americans arelactose intolerant).3 In addition, a collectivefocus on behavior rather than access cantoo easily veer into victim-blaming. Weight, including “overweight” and“obesity” rates. While body mass index(BMI) has been the commonly accepted wayto categorize people’s weights, it has beenscientifically debunked as a good metric formeasuring health and may even be raciallybiased.4 Furthermore, a focus on body sizehas the effect of privileging individuals whoconform to societal ideals for appearancewhile shaming others, thus perpetuatinginequities based on physical appearance. Health outcomes of dietary behavior(e.g., diabetes, cardiovascular disease,stroke). These metrics are not included inthis report simply because other sourceshave extensively covered this topic,including racial disparities in outcomes.5How to Use this ReportThemesThe metrics have been divided into fourthemes. While several metrics are relevantto multiple themes and sub-themes,each metric is only included once. Food access, which focuses on individuals’barriers to consuming the food they deemhealthy or want, because of economicresources, knowledge, or the environmentaround them. Subcategories of food accessinclude food security/hunger, food at schoolsand early childhood education sites, thecommunity food environment, and foodeducation. Food and farm business, which includesfactors influencing people’s ability tosuccessfully own and operate food- andfarm-based businesses. Subcategories ofthis theme include ownership of land ormeans of production and business support. Food chain labor, which includes metricsto measure racial equity among food chainworkers. Subcategories of food labor includeincome and benefits, upward mobility andcareer opportunities, and labor protections. Food movement, which is meant to measureequity in who is leading and benefiting fromthe food movement itself. Metrics touch ontopics such as leadership and financials.Key Terms Food chain workers“Food chain workers” include anylaborers involved in physically movingfood throughout the food system, fromfarm to fork. Food chain workers includethose who “plant, harvest, process, pack,transport, prepare, serve, and sell food.”6 Food movement organizations“Food movement organizations” broadlyinclude any organization whose focus isexplicitly to change or improve the foodsystem. While mission-driven businessescould be considered part of the foodmovement, this report focuses onnonprofits and other organizationsoutside the food supply chain.Data TypesThis report classifies the metrics accordingto four different types of data. SecondaryMetrics are classified as secondary datawhen there is a government entity orother organization collecting informationon an ongoing basis and making thatinformation publicly available. Little orno additional analysis is needed. Analysis based on secondary dataMetrics are classified as analysis based onsecondary data when existing information,sometimes from multiple sources, isused to conduct an original analysis. PrimaryMetrics are classified as primary datawhen new information must be collected,such as through a survey. For most of theprimary data metrics, an organization hasalready developed a tool or methodologyto collect information for a specific placeor group. For information on a broadergeography or changes over time, newdata collection would be needed. SuggestedSuggested metrics are based on ideasshared by food system experts for thepurposes of this project. These metrics areconcepts that have not been fully definedor, to our knowledge, previously measured.MSU CENTER FOR REGIONAL FOOD SYSTEMS // MEASURING RACIAL EQUITY IN THE FOOD SYSTEM: ESTABLISHED AND SUGGESTED METRICS5
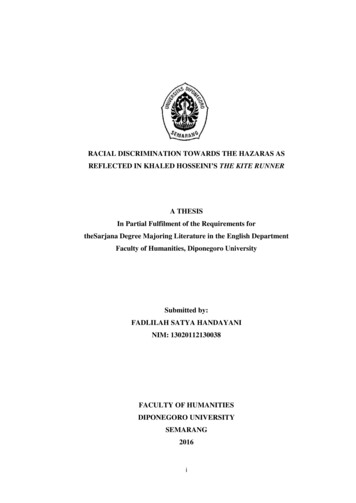
NOTES OF CAUTIONRacism is realbut race is asocial construct.There are no inherentor biological differencesbetween races. Race is asocial construct—it haschanged over time andwill continue to change.Because our societytreats people of differentraces differently, lots ofoutcomes vary by race.When we see differencesbetween races, we areseeing the result of currentand historical injustices.People are morethan their race.While metrics broken downby race can provide apicture of inequities in thefood system, categories ofrace obscure differenceswithin races. These metricsshould not be used totreat entire races of peoplehomogenously. All of themetrics presented hereshould be consideredin conjunction withintersectional analyses ofinequities based also onfactors such as immigrationstatus, primary language,class, culture, and gender.Isolated datapoints are notthe whole story.Metrics data should besituated within people’sactual lived experiencesthrough qualitative dataor other modes thatshow the ways in whichthe issue is experiencedin people’s lives.MSU CENTER FOR REGIONAL FOOD SYSTEMS // MEASURING RACIAL EQUITY IN THE FOOD SYSTEM: ESTABLISHED AND SUGGESTED METRICSResearch canbe a distraction.The extent and impact ofracism is well-documented;it does not need to beproven further. Gatheringdata on these or othermetrics should be usedto inform action or holdourselves accountable foraction, but not as a stallingtactic for taking action.6
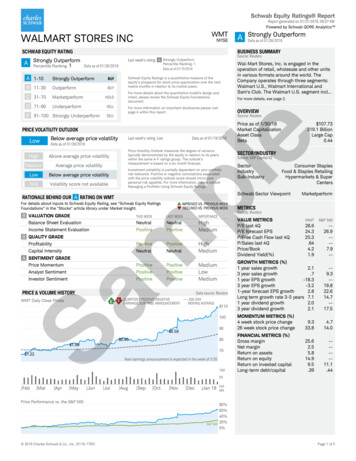
FOOD ACCESSMetric123Metric Purpose/DescriptionFood Security and HungerExampleScale(granularity)Unit ofAnalysisDataTypeData Source orMethodologyIndividual(Motherswithchildrenaged 19to 35months)SecondarydataThe CDC has includedquestions on breastfeedingin their annual NationalImmunization Survey(NIS) since 2001.8HouseholdSecondarydataHousehold Food Securityin the United Statesannual report, producedby U.S. Department ofAgriculture EconomicResearch Service.10HouseholdSecondarydataHousehold Food Securityin the United Statesannual report, producedby U.S. Department ofAgriculture EconomicResearch Service.126-monthbreastfeedingrate, by raceMeasures differentialaccess for infantsof different races tobreastfeeding (“first foodsystem”). Also suggestsdifferential supportinfrastructure for mothersof different races.“White and Latino/a infants, at 44.7%and 46% respectively, are more likelyto be breastfeeding at 6 monthsthan Black infants, who breastfeedat 6 months at a rate of 27.5%.”7NationalPercentage ofhouseholds withchildren that are foodinsecure, by raceMeasures inequity in foodaccess for households withchildren.Among households with children, 13.1%of black, non-Hispanic households hadfood-insecure children compared to10.7% of Hispanic households and 5.6%of white, non-Hispanic households.9NationalRate of foodinsecurity, by raceMeasures differentialfood access by race.Rates of food insecurity were higherthan the national average of 11.8% forhouseholds headed by black nonHispanics (21.8%) and Hispanics (18%).11National(Available bystate for 3-yearestimates)(Available bystate but not bystate and race)(Available bystate but not bystate and race)MSU CENTER FOR REGIONAL FOOD SYSTEMS // MEASURING RACIAL EQUITY IN THE FOOD SYSTEM: ESTABLISHED AND SUGGESTED METRICS7
FOOD ACCESSMetric4Metric Purpose/DescriptionFood Security and Hunger, cont.ExampleScale(granularity)Unit ofAnalysisDataTypeData Source orMethodologyCountySecondarydataAnnual Map the MealGap report, producedby Feeding America.14HouseholdSecondarydataUSDA Characteristics ofSupplemental NutritionAssistance ProgramHouseholds16 andAmerican Fact Finder17Percentage ofmajority AfricanAmerican countiesthat are also highfood-insecurityrate countiesMeasures differentialfood access by raceat the county level.While majority African-Americancounties form only 3% (N 105)of the 3,142 counties in the U.S.,92% (N 97) of them are highfood-insecurity rate counties.”13NationalHouseholdsparticipating in SNAP,by race/ethnicity,relative to the portionof all households inthe state, by raceIndication of disparitiesin level of need forfood assistance.In Michigan, 13.2% of householdshave a household member who isblack but in 32.5% of householdsreceiving SNAP benefits, thehead of household is black.15National6Proportion of foodsystem workersthat are foodinsecure, by raceMeasures inequityin food security forrestaurant workers.“A significantly greater proportionof non-white restaurant workerrespondents were food insecurecompared to white respondents.In particular, Latino respondentswere food insecure at twice the ratecompared to those of other races.18286 surveys werecollected in NewYork City and theSan FranciscoBay Area.7Percentage of SNAPusers who willlose food benefitsfollowing SNAP workrequirements, by raceMay measure opportunitiesof SNAP users to find/retain employment inorder to comply withMichigan’s new SNAPwork requirements.In Washtenaw County, MI, theunemployment rate for the wholecounty triggered work requirements.20However, employment rates andopportunities were quite disparatein different parts of the county (i.e.,the white, wealthy part had a lowunemployment rate but the poorer,mostly POC resident part of the countyhad a higher unemployment rate,which would not have independentlytriggered the work requirements).5(Could developcounty levelanalysis byoverlayingFeeding Americadata on foodinsecurity ratesby county withCensus Bureaudata on racialdemographics.)(Availableby state)(requirescombiningtwo datasets)RestaurantworkersPrimarydataSNAP userSuggestedMSU CENTER FOR REGIONAL FOOD SYSTEMS // MEASURING RACIAL EQUITY IN THE FOOD SYSTEM: ESTABLISHED AND SUGGESTED METRICSSurvey of restaurantworkers from 2011-2014based on oversampling ofunion workers in New YorkCity and a demographicsample in the SanFrancisco Bay Area.198
FOOD ACCESSMetricMetric Purpose/DescriptionRate of eligibility fornational free andreduced-price lunchprograms, by raceMeasures equity ineconomic need fornutritional assistanceamong schoolchildren.9Density ofconvenience stores,restaurants and snackstores within a shortdistance (400-800m) from the mainentrance of publicsecondary schoolsby racial compositionof the school10Percentage ofschools participatingin National SchoolLunch Programoffering fresh fruitand vegetables,by predominantrace of students8Food at Schools and Early Childhood Education SitesScale(granularity)Unit ofAnalysisDataTypeData Source orMethodology“Overall, 48 percent of public school4th-graders were eligible for freeor reduced-price lunches in 2009.White 4th-graders had the lowestpercentage of eligible students (29percent). The percentages of Black(74 percent), Hispanic (77 percent),and American Indian/Alaska Native(68 percent) 4th-graders whowere eligible were higher than thepercentages of White 4th-graders andAsian/Pacific Islander (34 percent)4th-graders who were taNational Center forEducation Statistics:Status and Trends in theEducation of Racial andEthnic Minorities.22Measures availability ofsnacks, sodas, and fastfood in the immediatevicinity of a school, whichcould negate schoolfood policies, especiallyamong students whocan leave campus.23“Hispanic youth are particularlylikely to attend schools that aresurrounded by convenience stores,restaurants, snack stores, or offlicenses. This effect is independentand in addition to poverty.”24NationalSchoolAnalysisbased onsecondarydataCreates buffer radius fromschool and calculates storedensity within that areabased on business locationdata from InfoUSA.25School location anddemographic data fromDepartment of Education’sCommon Core of Data.26Measures equitable accessto fresh produce in theschool environment forschoolchildren qualifyingfor nutrition assistance.“Majority-black or majority-Latino[public elementary] schoolswere significantly less likelyto offer fresh fruit than werepredominantly white schools.”27Bridging theGap surveyedschools annuallyfrom the2006-7 schoolyear throughthe 2012-13school year.SchoolPrimarydataSurvey tools are availablefrom Bridging the Gap.28Example(Availableby type ofschool locale— suburban,town, or rural.)MSU CENTER FOR REGIONAL FOOD SYSTEMS // MEASURING RACIAL EQUITY IN THE FOOD SYSTEM: ESTABLISHED AND SUGGESTED METRICS9
FOOD ACCESSMetricMetric Purpose/Description11Percentage ofEarly Childcare andEducation (ECE)sites participatingin National SchoolLunch Programoffering fresh fruitand vegetables, bypredominant race ofchildren enrolledMeasures equitableaccess to fresh producein the ECE environmentfor children qualifyingfor nutrition assistance.12Percentage of schoolsand Early Childcareand Education (ECE)sites who haveadequate cafeteriaequipment andstaffing for freshproduce preparation,by predominant raceof student bodyMay measure differentialinvestment in schoolsand differential abilityto provide fresh, healthymeals to students byrace of students.13Participation ofEarly Childcare andEducation (ECE)sites in the Child andAdult Care FoodProgram (CACFP),by predominant raceof enrolled childrenMeasures access to federalgovernment oversightto ensure nutritiousmeals and snacks forchildren at preschooland daycare sites.Food at Schools and Early Childhood Education Sites, cont.Example“Nine of ten schools do not have thenecessary kitchen and processingfacilities, training, and personnelto handle healthy and raw foods.The reason so many schools lackthe necessary infrastructure canbe traced to federal policy "29Scale(granularity)Unit ofAnalysisDataTypeECE siteSuggestedSchool orECE siteSuggestedECE siteSuggestedMSU CENTER FOR REGIONAL FOOD SYSTEMS // MEASURING RACIAL EQUITY IN THE FOOD SYSTEM: ESTABLISHED AND SUGGESTED METRICSData Source orMethodology10
FOOD ACCESSCommunity Food EnvironmentMetricMetric Purpose/DescriptionPercentage of peoplewho dine out thatreport having beendiscriminated againstin a restaurant in theprior month, by raceMeasures discriminationin the restaurant industrytoward patrons. Showsunequal treatmentof restaurant patronsbased on race.Share of census tractpopulation beyond 1mile (urban areas) or10 miles (rural areas)from supermarket,by race comparedwith total tractpopulation by raceMeasures foodaccess by race.16Retail foodenvironmentindex (RFEI),37 bypercentage ofresidents of colorin neighborhoodMeasures differentialaccess to food outlets.“ on average, there are 2.5 times morefast food restaurants and conveniencestores per health reporting areacompared to grocery stores.”38Analysis wasconducted forKing d onsecondarydataData for foodestablishments basedon North AmericanIndustry ClassificationSystem (NAICS) codeswas purchased fromSalesgenie39 and thencleaned, analyzed,and mapped.17Number of chainsupermarkets per zipcode, by predominantrace of zip codeMeasures food accessequity (assumessupermarkets providehealthy food access).“Predominantly black zip codeshave about half the number ofchain supermarkets compared topredominantly white zip codes,and predominantly Latino areashave only a third as many.”40Data wasanalyzed for asample of 28,050zip codes,representing atotal populationof 280,675,874persons.Zip codeAnalysisbased onsecondarydataPowell et al.41 obtaineddata on food store outletsfrom Dun & Bradstreetand data on demographicsof zip codes from theU.S. Census Bureau.1415Scale(granularity)Unit ofAnalysisDataTypeData Source orMethodology“A 1997 Gallup poll found that20 percent of African Americanrespondents reported that theyhad been discriminated against in arestaurant in the prior month. A 2001nationally representative sampleassessing the pervasiveness of “diningwhile black” revealed virtually nochange over the 1997 Proprietary data fromGallup Analytics.31“Food desert tracts have a greaterconcentration of all minorities,including Hispanics. In urban fooddeserts, this difference was nearly70 percent in 1990, approximately60 percent in 2000, and 53 percentin 2005-2009.”34NationalExampleThe Gallup Poll SocialSeries has included dataon minority rights andrelations since 2001.32,33(Available bycensus tract)CensustractAnalysisbased onsecondarydataThe USDA EconomicResearch Service FoodAccess Research AtlasData Download 2015includes variableson share of tractpopulation by race.35Overall demographicinformation for censustracks is availablefrom the AmericanCommunity Survey.36MSU CENTER FOR REGIONAL FOOD SYSTEMS // MEASURING RACIAL EQUITY IN THE FOOD SYSTEM: ESTABLISHED AND SUGGESTED METRICS11
FOOD ACCESSMetric18Metric Purpose/DescriptionCommunity Food Environment, cont.ExampleScale(granularity)Unit ofAnalysisDataTypeData Source orMethodologyBlockgroupAnalysisbased onsecondarydataCompares distancesfrom block groups tosupermarkets. Food outletdata from Nielson. Blockgroup data from AmericanCommunity Survey.44Racial/ethnic disparityratio to show thepercentage of peopleof color residing inlow supermarketaccess (LSA) areascompared to peopleof color in the stateor major metropolitanarea overall“The Racial/EthnicDisparity Ratios identifyhow unevenly LSAareas are distributedacross communitieswith differing racial/ethnic compositions.”42“Rhode Island’s Racial/Ethnic DisparityRatio of 2.3 indicates that thepercentage of LSA residents who arepeople of color is more than two timesthe percentage of all Rhode Islandresidents who are people of color.”43National19Grocery storeaccess in affluentcensus tracts, bypredominant raceof neighborhood(Accessibilityis calculated asa function oftravel time)Measures grocerystore access by race inhigh-income areas."Among affluent neighborhoods inAtlanta, those that are predominantlywhite have better grocery store accessthan those that are predominantlyblack, indicating that race may be afactor independent of income.”45Analysis wasconducted for564 censustracts in the10 counties ofmetropolitanAtlanta.CensustractAnalysisbased onsecondarydataAuthors useddemographic and incomedata from the U.S.Bureau of the Census2002 and unpublisheddata on employmentprovided by the AtlantaRegional Commission.4620Perceived quality ofproduce and meatsoffered by differentbranches of the samesupermarket, bypredominant race ofbranch neighborhoodMeasures equity in accessto quality, healthy foods.“Supermarkets serving AfricanAmerican communities in Pittsburgh,Pennsylvania, are perceived byresidents to offer produce andmeats of poorer quality thanbranches of the same supermarketsserving white neighborhoods.”47Data wasanalyzed foran easternneighborhoodof Pittsburgh.SupermarketbranchAnalysisbased onsecondarydata andprimarydataMixed-methodapproach using GIS,focus groups, and asurvey of residents.4821Percentage ofpeople who live in acensus tract with asupermarket, by raceMeasures food access(assumes supermarketsprovide healthyfood access).“Another multistate study found thateight percent of African Americanslive in a tract with a supermarketcompared to 31 percent of whites.”49Data wasanalyzed for 208census tractsin Maryland,North Carolina,Mississippi,and Minnesotato producea nationalestimate.CensustractPrimarydataFood stores and foodservice places wereobtained from local healthdepartments and statedepartments of agricultureand then geocoded. Theinfluence of food storeson dietary behavior wasestimated using datafrom the AtherosclerosisRisk in Communities(ARIC) study.50(state and majormetropolitanarea)MSU CENTER FOR REGIONAL FOOD SYSTEMS // MEASURING RACIAL EQUITY IN THE FOOD SYSTEM: ESTABLISHED AND SUGGESTED METRICS12
FOOD ACCESSMetricMetric Purpose/Description22Number ofsupermarketsper census tract,by predominantrace of tractMeasures differentialaccess to supermarkets(assumes supermarketsprovide healthyfood access).23Median distanceto a large grocerystore by residencyin a tribal area2425Community Food Environment, cont.Scale(granularity)Unit ofAnalysisDataTypeData Source orMethodology“Predominantly White and wealthierareas were found to have moresupermarkets than were predominantlyminority and poorer areas afterwe accounted for population andgeographic size. In contrast, smallgrocery stores were more commonin predominantly minority areasand in poorer areas. In general,poorer areas and non-White areasalso tended to have fewer fruit andvegetable markets, bakeries, specialtystores, and natural food stores.”51Data wasanalyzed for 685census tracts inNorth Carolina,Maryland,and New Yorkto producea nationalestimate.CensustractPrimarydataInformation on foodestablishments waspurchased from InfoUSA,data on individualswas obtained from theMultiethnic Study ofAtherosclerosis, andinformation on censustracts was obtainedfrom the US Census.52Measures differentialaccess to healthy food.“ the median distance to the nearestsupermarket was 0.8 mile [sic] forall Americans, compared with 3.3miles for all tribal area individuals.”53Data wasanalyzed for545 individualtribal areas.54Tribal areaPrimarydataUsed GeographicInformation System (GIS)methods to compute thenumber and percentageof populations andpopulation subgroups in545 tribal areas by nearestdistance to food outlets.55Rate of reduction innumber of availablegrocery stores overtime, by predominantrace of neighborhoodMeasures trends inhistorical disinvestment inneighborhoods by race,and how that has shapedfood access disparities.“from 1997 to 2008 predominantlyAfrican American neighborhoodsand low-income neighborhoodshad the smallest increase infood store availability and thegreatest reduction in the numberof available grocery stores.”56Data wasanalyzed for28,050 zip codesacross the U.S.Zip codePrimarydataLinked outlet densitydata obtained fromDun & Bradstreet for28,050 zip codes toCensus 2000 data onneighborhood racial andethnic characteristics.57Number of residentsper grocery store,by predominant raceof neighborhoodMeasures differentialaccess to number ofgrocery stores (assumesgrocery stores providehealthy food access).“In Washington D.C., the District’s twolowest income neighborhoods, whichare overwhelmingly African-American,have 1 [grocery store] for every 70,000residents compared to 1 [grocerystore] for approximately every 12,000residents in two of the District’shighest income and predominantlywhite neighborhoods.”58Data wascollected forWashington D.C.Neighborhood(Ward)PrimarydataAuthors identified andsurveyed “grocery stores”(national and regionalchain and independentsupermarkets anddiscount grocers), thencalculated the ratio ofgrocery stores to to
Social Impact Consultant . sarahrodmanalvarez.com Kathryn Colasanti, MS . Specialist. Center for Regional Food Systems (CRFS), Michigan State University. Suggested Citation. Rodman-Alvarez, S. & Colasanti, K. (2019) Measuring Racial Equity in the Food System: Established and Suggested Metrics. East Lansing, MI. Michigan State University Center