Transcription
PM World JournalVol. I, Issue V – December 2012www.pmworldjournal.netHenry L Gantt, 1861-1919: Debunking the mythsa retrospective view of his workFeatured PaperPatrick WeaverHenry L Gantt, 1861 - 1919Debunking the myths, a retrospective view of his workBy Patrick WeaverHenry Laurence Gantt, A.B., M.E. was an American mechanical engineer andmanagement consultant who is best known for developing the Gantt chart in the 1910s.However, the charts Henry Gantt developed and used are nothing like the charts thatare erroneously referred to as ‘Gantt Charts’ by modern project managers.It is a tragedy that Gantt’s real contributions to the advancement of managementscience are obscured by two glaring misconceptions that continue to be perpetuated bysloppy scholarship with various authors repeating earlier incorrect assertions withoutever bothering to check the original source materials. This article is intended to set therecord straight and recognise Gantt for his real achievements!Henry Gantt was a very important management scientist; his contribution to productionengineering is rightly recognised by the American Society of Mechanical Engineers(ASME) by awarding an annual medal in his honour. The Henry Laurence Gantt Medal,was established in 1929 and elevated to a Society award in 1999, it is given fordistinguished achievement in management and for service to the community.Hopefully by the time you have finished this paper, you will agree the following mythsshould be ‘busted’ once and for all:Misconception #1 Henry Gantt developed ‘Bar Charts’ – Fact, bar charts weredeveloped 100 years before Gantt, his charts were sophisticated production controltools, not simple representations of activities over time.Misconception #2 Henry Gantt contributed to the development of ‘projectmanagement’ – this is a complete fallacy, Gantt’s work was in machine shops andfactories focused on batch production and factory throughput. Many of his ideas can beadapted to modern project management but Gantt sought to eliminate ‘one-off’ jobs thatcould not be batched and managed efficiently.Source Materials:Thanks to the digitisation of historically significant books, the three original booksrelating to Gantt’s work are now in the public domain: Work Wages & Profits (Henry L. Gantt, 1916) Organizing for Work (Henry L. Gantt, 1919) The Gantt Chart a working tool of management (Wallace Clark, 1923)For convenience of readers, all three books can be downloaded from:http://www.mosaicprojects.com.au/Resources Papers 158.html 2012 author’s namewww.pmworldlibrary.netPage 1 of 19
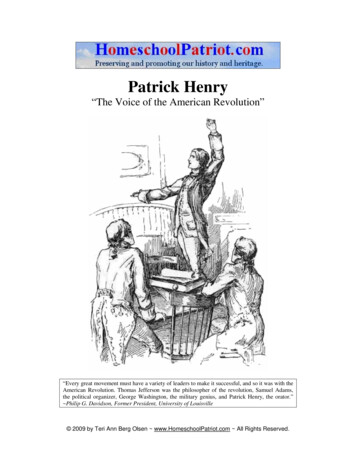
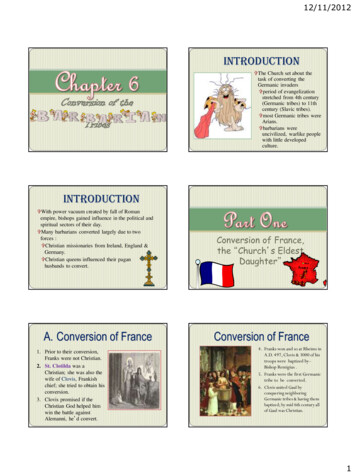
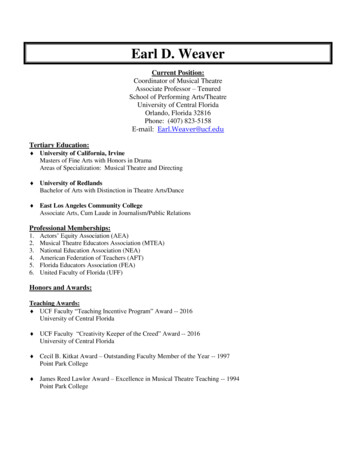
PM World JournalVol. I, Issue V – December 2012www.pmworldjournal.netHenry L Gantt, 1861-1919: Debunking the mythsa retrospective view of his workFeatured PaperPatrick WeaverBar Charts and Gantt Charts:Throughout his career, Henry Gantt used a wide range of charts; in fact it would be trueto say that one of Gantt’s core skills was developing charts to display relatively complexdata in ways that allowed quick and effective comprehension by managers. Howevernone of these charts were simple forward projections of activities against time (ie, theconventional ‘bar chart’ used on modern project management), and the term ‘GanttChart’ was first used in the Wallace Clark book, where he describes the use of Gantt’scharts to measure productivity.The origin of the Bar Chart.The concept of ‘scheduling’ is not new; the pyramids are over 3000 years old, Sun Tzuwrote about scheduling and strategy 2500 years ago from a military perspective,transcontinental railways have been being built for some 200 years, etc. None of theseactivities could have been accomplished without some form of schedule; ie, theunderstanding of activities and sequencing. However, whilst the managers, priests andmilitary leaders controlling the organisations responsible for accomplishing these ‘works’must have an appreciation of ‘scheduling’ (or at least the successful ones would have)there is little evidence of formal processes until the 18th Century.Modern bar charts can trace their origins to 1765. The originator of the concept appearsto be Joseph Priestley (England, 1733-1804); his ‘Chart of Biography’ plotted some2000 famous lifetimes on a time scaled chart. Priestley is quoted as saying “ a longeror a shorter space of time may be most commodiously and advantageously representedby a longer or a shorter line.”Figure 1 – Joseph Priestley: Chart of BiographyPriestley’s ideas were picked up by William Playfair (1759-1823) in his ‘Commercial andPolitical Atlas’ of 17861.1Playfair, W. (1801). The Commercial and Political Atlas and Statistical Breviary. Reprinted 2005, CambridgeUniversity Press, New York, NY. 2012 author’s namewww.pmworldlibrary.netPage 2 of 19
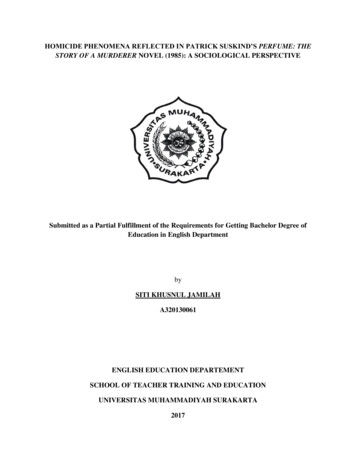
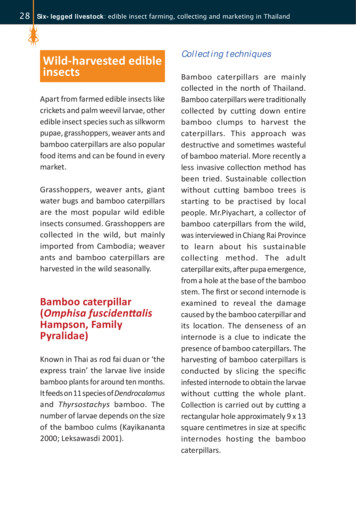
PM World JournalVol. I, Issue V – December 2012www.pmworldjournal.netHenry L Gantt, 1861-1919: Debunking the mythsa retrospective view of his workFeatured PaperPatrick WeaverFigure 2 – One of Playfair’s Charts from the 1801 edition of his AtlasPlayfair is credited with developing a range of statistical charts including the line graph,bar graph (histogram), and pie charts. His Atlas contains 43 time-series plots and onehistogram.Following on from Playfair; another European, Karol Adamiecki - a Polish economist,engineer and management researcher, developed the Harmonogram (orHarmonygraph) in 18962. Adamiecki’s Harmonygraph has a date scale on the verticalaxis (left hand side) and lists Activities across the top.Each activity was represented by a scaled paper strip, and the current schedule andduration of the activities were depicted by the position and length of the strips. In theheader above the strips, the name and the duration of the activity and the list ofpreceding activities were shown. The strips representing the preceding activities werealways to the left of the strip of the successor.The tabulation of each activities predecessors and successors in the Harmonygraph(‘from’ and ‘to’) makes it a distinct predecessor to the CPM and PERT systemsdeveloped some 60 years later.2Morris P.W.G. (1994) ‘The Management of Projects’ Thomas Telford Ltd, London. p7. 2012 author’s namewww.pmworldlibrary.netPage 3 of 19
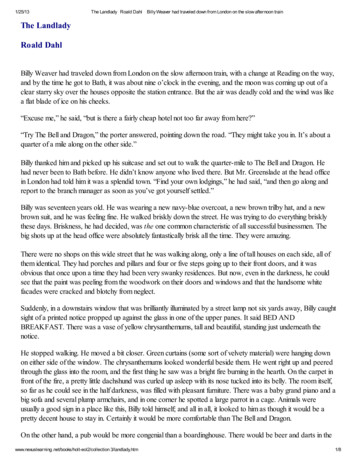
PM World JournalVol. I, Issue V – December 2012www.pmworldjournal.netHenry L Gantt, 1861-1919: Debunking the mythsa retrospective view of his workFeatured PaperPatrick WeaverFigure 3 – Adamiecki’s HarmonygraphBy 1912, the modern bar chart seems to have been fully developed and in use at leastin Germany. A project to construct a small mountain railway in Bavaria was the subjectof a lengthy report in the October 1915 edition of Armierter Beton3. The railway was ofinterest for the innovative use of reinforced concrete in a major bridge, not the schedule,but in passing the use of a bar chart and histogram were briefly discussed4:A very accurate graphical building program was set up for the execution of the work, ofwhich Fig.33 is a part. For that, each week is assumed to be five full days of real work,and thus all interruptions, by unfavourable weather, etc., were incorporated. Bycompiling the need for each of the individual services in the construction program to asecond table (Fig. 32) the total demand at Baustoften was seen and overallperformance was, with a view of the uncertain and irregular supply, achieved by timelyprovision being made for each appropriate supplies. The construction program wasgenerally respected, and well laid non-structural (performance) measures about that aswell as the construction program, mainly by Dipl.-Ing. J. Mulller has been designed,excellently preserved, and, despite fairly significant investment costs, has proved veryeconomical.3For more on the origins of the Schürch bar chart and a set of supporting resource histograms see:The original published article (German Language):http://www.mosaicprojects.com.au/PDF Papers/P042 Barchart Origins.pdfA ‘rough’ translation of the reference to the program contained in the article:http://www.mosaicprojects.com.au/PDF Papers/P042 Barchart Origins Comment.pdf4Note, the translation is mine, using Google Translate, there may be errors. 2012 author’s namewww.pmworldlibrary.netPage 4 of 19
PM World JournalVol. I, Issue V – December 2012www.pmworldjournal.netHenry L Gantt, 1861-1919: Debunking the mythsa retrospective view of his workFeatured PaperPatrick WeaverFigure 4 (Fig. 33 from the report): a Bar Chart developed for a bridge constructed in 19125.5The same project is discussed in a book by Schürch published in 1916: This copy of the chart is from p35 of thebook. 2012 author’s namewww.pmworldlibrary.netPage 5 of 19
PM World JournalVol. I, Issue V – December 2012www.pmworldjournal.netHenry L Gantt, 1861-1919: Debunking the mythsa retrospective view of his workFeatured PaperPatrick WeaverFigure 5 (Fig. 33 from the report): Part of the resource histograms from the same project.Based on the use of language in the Armierter Beton article it would appear the use ofthis type of bar chart was routine, the only differentiation on this project was the effortput into the programming of the work.Given the extent of use in Europe, I would suggest it is nearly impossible for aneducated engineer such a Gantt to be unaware of this type of chart and its long history.He was aware of important German thinkers including Bismarck and Von Moltke andwhen discussing the benefits of using of his own charts, Gantt commented: Many shopshave very nice scheduling systems; they plan their work beautifully - at least, it looksvery pretty on paper; but they have no means of finding out if those schedules are livedup to or not6. We will never know exactly what type of chart Gantt was referencing in hisdisparaging remarks, but understanding what his charts could achieve would suggesthe was talking about simple bar charts similar to the one above!Gantt’s Charts.Henry Gantt developed and used a range of charts over the years to help visualise andunderstand data. Whilst some superficially look similar to Figure 4 above, the way theywere developed and the information being communicated is quite different. The primarypurpose of a traditional bar chart is to show which activities are planned to be6From: Work, Wages and Profit, p130 The task idea 2012 author’s namewww.pmworldlibrary.netPage 6 of 19
PM World JournalVol. I, Issue V – December 2012www.pmworldjournal.netHenry L Gantt, 1861-1919: Debunking the mythsa retrospective view of his workFeatured PaperPatrick Weaveraccomplished and their timing in the future (sequencing can only be inferred), whereasGantt’s charts tended to be retrospective and diagnostic.The first set of charts used by Gantt and discussed in ‘Work Wages and Profits’ (1916)were primarily record keeping cards (Fig. 6) and bonus charts (Fig. 7). The key elementwith both of these charts is information is filled in after the work is completed for a day.The purpose is to identify areas of actual production that need improvement (not topredict future activities).Figure 6 A Machine Record Chart from Work Wages and Profits (1916). 2012 author’s namewww.pmworldlibrary.netPage 7 of 19
PM World JournalVol. I, Issue V – December 2012www.pmworldjournal.netFigure 7Henry L Gantt, 1861-1919: Debunking the mythsa retrospective view of his workFeatured PaperPatrick WeaverA ‘Bonus Chart’ information on performance (bonus earned or not) is filled in at the end ofeach day.The situation is slightly different in the third chart type discussed in this book. Thehorizontal red lines on the ‘Production Sheet’ (Fig. 8) show when work on each specificpart is planned to start and finish, the number of parts produced are entered after eachday’s work to record the actual progress of the worker. 2012 author’s namewww.pmworldlibrary.netPage 8 of 19
PM World JournalVol. I, Issue V – December 2012www.pmworldjournal.netHenry L Gantt, 1861-1919: Debunking the mythsa retrospective view of his workFeatured PaperPatrick WeaverFigure 8 A ‘Production Chart’ the information on actual production is filled in at the end of each day.‘Work Wages and Profits’ also includes a number of graphs to demonstrate theeffectiveness of Gantt’s methods and examples of job cards, time cards and otherfactory records.Gantt’s second book, ‘Organizing for Work’ published in the year of his death is aninteresting read. Henry Gantt knew his working days were nearing an end and he wasfree to say exactly what he thought! Here are a few of his grumpier comments7: The most casual investigation into the reasons why so many of the [WW1]munition manufacturers have not made good, reveals the fact that their failureis due to lack of managerial ability rather than to any other cause. Our most serious trouble is incompetency in high places. As long as thatremains uncorrected, no amount of efficiency in the workmen will avail verymuch. Our industries are suffering from lack of competent managers,—which isanother way of saying that many of those who control our industries hold theirpositions, not through their ability to accomplish results, but for some otherreason.Sentiments that I hear quite often today however, I digress; as in his first book, Ganttuses a range of charts in ‘Organizing for Work’ (1919) to make complex informationaccessible to workers, supervisors and managers alike. As with the charts above, most7Copied from Organizing for Work, p64 2012 author’s namewww.pmworldlibrary.netPage 9 of 19
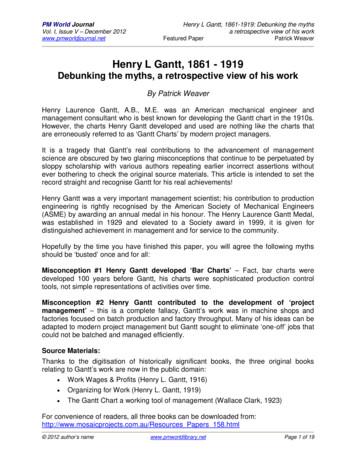
PM World JournalVol. I, Issue V – December 2012www.pmworldjournal.netHenry L Gantt, 1861-1919: Debunking the mythsa retrospective view of his workFeatured PaperPatrick Weaverof the information is entered after the day’s work is completed, and the purpose ofcharts such as the ‘Idleness Expense Chart’ is to record inefficient working to allowproduction improvement efforts to be focused where needed.However, in ‘Organizing for work’ Gantt does introduce the chart that Wallace Clarkcalls the ‘Gantt Chart’ (Henry Gantt always named charts for their purpose). In fact, thename ‘Gantt Chart’ can be traced directly to the title of Clark’s book, ‘The Gantt Chart aworking tool of management’ published in 1923.Clark worked with Gantt and can be credited for ensuring much of his legacy remainsavailable today. The ‘Gantt Chart’ used by Gantt and described in detail by Clark shows,for each item to be manufactured, the planned quantity and allocated time slot formanufacturing the ‘batch’, plus the actual, cumulative, and daily totals all in one line(Fig. 9).Figure 9 The details of a Gantt Chart.To understand and interpret this chart: The heavy black line shows the planned work period (with the required quantityof parts in a tabulation, The numbers show the actual quantity produced each day and the cumulativetotal as at the end of the day. The thin line represents the percentage of the day’s production achieved (if100% is achieved, the thin line extends across the full day as on Wednesday), The small vertical ‘ticks’ below the thick black line show the cumulative amountachieved at the end of each day.As in the example above, the production target can vary from day to day depending onthe precise nature of the work, learning curves, re-tooling, etc; and most of theinformation is entered at the end of each day. Gantt developed and used two variants ofthis chart, the ‘Load Chart’ (Fig. 10) and the ‘Performance Chart’ (Fig. 11). 2012 author’s namewww.pmworldlibrary.netPage 10 of 19
PM World JournalVol. I, Issue V – December 2012www.pmworldjournal.netHenry L Gantt, 1861-1919: Debunking the mythsa retrospective view of his workFeatured PaperPatrick WeaverFigure 10 A ‘Load Chart’.Figure 11 A ‘Performance Chart’.Clark’s book goes on to describe many variants of the basic charts outlined above anddifferent way they can be used to assist in machine shop management. 2012 author’s namewww.pmworldlibrary.netPage 11 of 19
PM World JournalVol. I, Issue V – December 2012www.pmworldjournal.netHenry L Gantt, 1861-1919: Debunking the mythsa retrospective view of his workFeatured PaperPatrick WeaverThe book also describes how Gantt’s work assisted the American First World War (1917- 1918) production and mercantile shipping efforts8 initially at the Frankford Arsenal thenon America's entry to the conflict at the Ordnance Department in Washington supportingthe work of General William Crozier.As with his commercial work, the primary focus of all of the charts used by Gantt duringthe First World War was on charting the difference between promises andperformance9. As demonstrated above, work planned and work performed is shown inrelation to each other and in relation to time10. It is interesting to note that after the warGeneral William Crozier was moved on and the charts were quietly dropped asbureaucrats preferred to focus on what that they had done, rather than compare thiswith what they could have achieved!Clark concludes his book as follows:General Benefits of Gantt ChartsIn the previous chapters Gantt charts have been shown as:1. A simple and effective method of planning work.2. A way of presenting facts so that they can be easily understood.3. A means of eliminating idleness and waste.4. A method of getting things done on time.But Gantt charts stand for something more than that, for where they have been inuse for some time one will find:1. Machines and equipment in good condition.2. Floor space arranged for use; neither cluttered up with unnecessary things norarranged for appearance only.3. Work moving rapidly from one operation to another without confusion.4. Large reductions in inventories of raw materials, work in process, and finishedgoods, because of the shortening of manufacturing time.8From the Preface: “In 1917, after a careful inspection of certain factories in which Mr. H. L. Gantt had installed hismethods, General William Crozier, then Chief of Ordnance, retained Mr. Gantt to act in a consulting capacity onproduction, first at the Frankford Arsenal, and then, immediately after the declaration of war, in the OrdnanceDepartment at Washington.”9Dean Schneider discussing Gantt’s charts in the Ordinance Dept. ''Each production section has production andprogress chart systems. These seem to vary in minor details only. Even without rigid standardization, the chartsgive a picture of the progress of the whole Ordnance Program including lags and the causes thereof. Combined inone office and kept to date they would show the requirements as to workers, as well as to materials, transportation,accessory machinery, and all of the other factors which make or break the program. With a plan of this sort theOrdnance Department would be in a position to state at any time its immediate and probable future needs in men,materials, transportation, and equipment.” (Organising for Work, pp 80).10The density of information on a ‘Gantt Chart’, and its function to measure production is far more closely alignedwith the concepts embedded in Earned Value than a traditional bar chart. Whilst the style of Gantt’s charts isdifferent, the information shown is precisely the same as plotting Earned Value and Planned Value in a modern EVsystem. 2012 author’s namewww.pmworldlibrary.netPage 12 of 19
PM World JournalVol. I, Issue V – December 2012www.pmworldjournal.netHenry L Gantt, 1861-1919: Debunking the mythsa retrospective view of his workFeatured PaperPatrick Weaver5. Increased production not through speeding up workmen but by removing theobstacles which prevent them from doing their best.6. Reduced costs, because of the elimination of idleness and waste as well asimprovements in processes.7. Men in subordinate positions willing to shoulder responsibility instead of"passing the buck," because they have definite duties and clear-cut jobs.8. Courage and initiative stimulated, because men know they will get fair play.9. No favoritism or special privilege, because every man's record can be seen byothers.10. Satisfied workmen, because the delays over which they have no control arefew and they are left free to do a full day's work and therefore earn betterwages.11. Poor workmen trained and developed until they make good.12. Promotions going to men who know their jobs and, therefore, an organizationbeing built up of men who "know what to do and how to do it."13. Men interested in their work, not only because of the wages but because theyhave an opportunity to increase their knowledge and improve their skill.Seeing such changes take place in one plant after another, watching arbitrarymanagement become democratic and finding workmen not only interested in theirwork but proud of it, strengthens the conviction that the Gantt chart is the mostnotable contribution to the art of management made in this generation.Sentiments with which I concur; over his life’s work Gantt developed progressively moresophisticated charts that made complex information easy to comprehend and use byworkers, supervisors and managers alike. But this was is in the management domain offactory/ production management, not project management and the charts are productionrecords, not bar charts.Henry Gantt’s Contribution to Management (not project management):As discussed above, Henry Gantt’s focus was on increased machine-shop production,through the use of effective measurement and planning. The various charts he usedwere a means to an end: “The man who undertakes to introduce scientific managementand pins his faith to rules, and the use of forms and blanks, without thoroughlycomprehending the principles upon which it is based, will fail. Forms and blanks aresimply the means to an end. If the end is not kept clearly in mind, the use of these formsand blanks is apt to be detrimental rather than beneficial.”The starting point of Gantt’s work was the ideas of scientific management introduced byFrederic Taylor (Gantt worked with Taylor in the early days). Scientific managementpresumes the best way to understand a complex task is to break it down into itscomponent parts, scientifically study and optimise each part and then synthesise thebest way to complete the work as a whole, from the optimised parts. What made Gantt’swork uniquely valuable was the way this information was used to motivate workers. 2012 author’s namewww.pmworldlibrary.netPage 13 of 19
PM World JournalVol. I, Issue V – December 2012www.pmworldjournal.netHenry L Gantt, 1861-1919: Debunking the mythsa retrospective view of his workFeatured PaperPatrick WeaverGantt’s standout contribution was his innovative approach to workforce management,today we would call this ‘team motivation’; overlaid with a strong sense of industrialdemocracy. His 'method' was focused on the efficient utilization of labour and a fairdivision of the rewards from any improvement in productivity between the workers andthe owners of the factories.The innovations introduced by Gantt are still very much the focus of modernmanagement; they include team motivation, change management and the effective useof control systems. And whilst the focus of his work was in manufacturing (with theadvantage of repetition and standardisation) many of his ideas and processes are ofvalue in today’s projects.The centrepiece of Gantt’s method involved the scientific investigation and carefulstandardization of the work into tasks. Figure 12 shows a task card with set processesand times to manufacture a heavy metal ‘pin’. Once a task had been ‘set’ by anexpert11, the expert was required to provide individual instruction to each worker on howto accomplish the task, and once they had learnt to perform the task in the set time andto the required quality, a bonus was paid in addition to their daily wage.Gantt recognised incentives are a far more powerful motivator then penalties. Hedescribed his approach as “a system of education for the workforce, with a bonus forthose who learned!” It proved highly effective generating sustained productivityimprovements well in excess of 100%.11‘Setting a task’ involved an experienced and skilled workman determining the best way to accomplish the work andthe optimum time needed for each step in the process. 2012 author’s namewww.pmworldlibrary.netPage 14 of 19
PM World JournalVol. I, Issue V – December 2012www.pmworldjournal.netHenry L Gantt, 1861-1919: Debunking the mythsa retrospective view of his workFeatured PaperPatrick WeaverFigure 12 A timed job card – the worker was taught how to achievethe ‘set times’ to earn his bonus.Gantt’s system also interconnected the reward paid to the supervisor with the rewardspaid to the workers. The foreman received a bonus for each worker in his team thatreceived a bonus, but the foreman’s bonus was doubled if all of the workers in his teamachieved a bonus. This encouraged the foreman to ensure his shop operated efficientlyand to work with and support the least effective members of ‘the team’ to bringeveryone up to standard.Importantly whenever a bonus was not earned, the cause was investigated and thecause of the failure removed or remedied, Gantt wanted everyone to make their bonusevery day! He knew that when this was achieved, the plant as a whole was working toits optimum productivity level and generating the maximum profits; a win-win outcomefor everyone. 2012 author’s namewww.pmworldlibrary.netPage 15 of 19
PM World JournalVol. I, Issue V – December 2012www.pmworldjournal.netHenry L Gantt, 1861-1919: Debunking the mythsa retrospective view of his workFeatured PaperPatrick WeaverGantt was also aware of the challenges of ‘change management’. When introducing hissystem to a new factory, he recognized that “in every workroom there is a fashion, ahabit of work, and every new worker follows that fashion, for it isn't respectable not to.”Consequently, “the changing of a system of management is a very serious matter andcannot be done by a superintendent in his spare time.”The effort needed to introduce Gantt’s system required a high degree of skill, took time,required on-going support, and needed planning! Gantt’s starting point was the physicallayout of the workplace. The photographs in Figures 13 and 14 are the same factorywork-space before and after Gantt’s involvement. Before introducing the bonus system,he wanted to make sure the workers could be successful!Figure 13 Before improvement.Gantt also recognised these improvements required the active involvement of a skilledand committed management. He was highly critical of ineffective management focusedon short-term profits! “No .laws. have so far been framed that restrain the "highfinancier" who, without giving anything in return, taxes the community for his own benefitto an extent that makes all other forms of acquiring without giving an adequate returnseem insignificant.” 2012 author’s namewww.pmworldlibrary.netPage 16 of 19
PM World JournalVol. I, Issue V – December 2012www.pmworldjournal.netHenry L Gantt, 1861-1919: Debunking the mythsa retrospective view of his workFeatured PaperPatrick WeaverFigure 14 After improvement.Gantt’s method focused on balancing the whole production system, he recognized thata 'system of management requires all of its parts to work in harmony if it is to beeffective, and this requires trained workers' supported by skilled supervisors andmanagers. He understood that management was ultimately responsible for the efficientutilization of labour and implementing efficient systems that minimized errors (the focusof modern systems and quality engineering).Gantt also recognised that to make the changes permanent, both parties needed tobenefit and be satisfied with the outcomes for optimum productivity to be achieved,leading to the maximum payment of bonuses and the generation of enhanced profitslong-term; this meant management needed to share the reward with the workers –industrial democracy.Henry Gantt Conclusion:Henry L. Gantt was a fascinating pioneer of modern management practice, much of hiswork still has an important place in project management as much as any other sphere ofmanagement. He focused on motivation over ‘driving’ workers: “The general policy in the pasthas been to drive, but the era of force must give way to that of knowledge, and 2012 author’s namewww.pmworldlibrary.netPage 17 of 19
PM World JournalVol. I, Issue V – December 2012www.pmworldjournal.net Henry L Gantt, 1861-1919: Debunking the mythsa retrospective view of his workFeatured PaperPatrick Weaverthe policy of the future will be to teach and to lead to the advantage of allconcerned”.He recognised the advantages of minimum inventory, clean work places andquality decades before ‘lean’ and ‘six sigma’ were thought of.He also introduced a wider social responsibility in his teachings: “The businesssystem must accept its social responsibility and devote itself primarily to service. of the community's needs”.The management aspects of Gantt’s work have only been briefly discussed in this paperalthough they are the central theme of both of his books. However, with respect to thetwo myths highlighted at the beginning of this paper I hope you agree they arethoroughly ‘busted’! This paper has clearly demonstrated that the concept of bar charts pre-dateGantt’s work by 100 years (at least).We have also shown from Gantt’s own books his focus was on factorymanagement and batch production, he had absolutely no involvement indeveloping the concepts of ‘project management’.Gantt’s contributions to the advancement of management science are of greatsignificance, we do not need to diminish them by associating him with simple timefocused bar charts, even if during the 1930s lazy American managers dropped most ofthe sophistication embedded in a true ‘Gantt Chart’ and started calling any time scaledchart a ‘Gantt Chart’ and then in the 1950s and 60s, even lazier scholars blindlyaccepted the name as being synonymous with a bar chart, without doing some basicresearch into the man, his charts or the true origins of bar charts.You don’t have to accept my views on this, all three books are sh
Henry Laurence Gantt, A.B., M.E. was an American mechanical engineer and management consultant who is best known for developing the Gantt chart in the 1910s. However, the charts Henry Gantt developed and used are nothing like the charts that are erroneously referred to as 'Gantt Charts' by modern project managers.