Transcription
UAS-NASLive Virtual ConstructiveDistributed TestEnvironmentCharacterization ReportDocument No.UAS-04.05.0001.01Release Date:September 2013
LVCCharacterization–September27,2013REVISION SHEETREVISIONBaselineAUTHORJ. MurphyDATESeptember 27, 20133LIST OF CHANGESInitial Release
LVCCharacterization–September27,2013Executive SummaryThis report documents message latencies observed over various Live, Virtual, Constructive, (LVC)*simulation environment configurations designed to emulate possible system architectures for theUnmanned Aircraft Systems (UAS) Integration in the National Airspace System (NAS) Project integratedtests. For each configuration, four scenarios with progressively increasing air traffic loads were used todetermine system throughput and bandwidth impacts on message latency.This report serves as the UAS in the NAS Fiscal Year 2013 Annual Performance Goal submission. TheFY13APG (APG 4.2.1.1: AR-13-7) is defined as: “Complete flight evaluations to assess the capabilities ofthe Live, Virtual, Constructive (LVC) distributed simulation environment.” The analyses in this reportcover the observed latencies for messages sent from a live aircraft during flight, augmented with analysesof observed latencies among virtual and constructive aircraft data sources to air traffic control (ATC)displays across the LVC system.The LVC is being developed in support of the UAS Integration in the NAS Project, which is investigatingand integrating technologies that are intended to reduce technical barriers related to the safety andoperational challenges associated with enabling routine UAS access to the NAS. To support this goal, theIntegrated Test and Evaluation (IT&E) subproject is developing a distributed LVC test environment toenable human-in-the-loop (HITL) simulation and flight test activities. The LVC test environment for theProject is comprised of ATC, constructive and virtual aircraft simulators, and UAS ground control stations(GCS) that together provide researchers with a relevant unmanned environment. To maximize the use ofavailable resources, the LVC test environment is designed to be distributed such that technologies andconcepts developed by the Project as well as its external partners can be easily integrated with thesimulation or flight environment.The data captured in this report is critical to inform building the appropriate LVC configuration in supportof the Project integrated events. Due to the distributed nature of the LVC test environment, the latencies ofmessages passed between the LVC components observed in standalone simulations must be characterizedand clearly understood to assess the effect of latency on the overall simulation. In addition, to properlysynchronize live, virtual, and constructive data, it is critical to understand the latency inherent between thevarious possible distributed components of the LVC test environment. Understanding the LVC capabilitiesand performance characteristics will allow developers to account for and mitigate known system delays anddetermine whether new research requirements will levy additional LVC development requirements.Since an LVC instantiation can be constructed in many different configurations depending on the specificrequirements of a simulation event, the tests focused on determining the latencies between key componentsof the distributed simulation environment as characterized by four primary categories:1.) Latencies to publish live aircraft state data for distribution to the rest of the LVC2.) Latencies to publish virtual aircraft state data for distribution to the rest of the LVC3.) Latencies to publish constructive aircraft state data for distribution to the rest of the LVC4.) Latencies between distributed tedpeopleoperatingsimulatedsystems.4
LVCCharacterization–September27,2013The NASA S-3B Viking aircraft, which is a candidate participating aircraft for Flight Test 4, provided livetelemetry through a 3G cellular connection.† The B747 FAA Level D flight simulator located at NASAAmes and the Ikhana Predator-B simulator located at NASA Dryden provided virtual traffic data, whileconstructive traffic was supplied by the Multi-Aircraft Control System (MACS) Simulation Managercapability housed at NASA Ames. NASA Ames provided the facilities that ran the LVC messagingcommunication hub utilizing a High Level Architecture format model. Due to the location of the assets andfacilities in the LVC, messaging latency was measured between facilities at NASA Ames, and betweenNASA Ames and facilities at NASA Dryden and NASA Glenn.The results from the data captured during the flight of the NASA S-3B proved to be significant. The time topublish the S-3B data under the best case scenario was at or near the latency requirement for data in theTerminal airspace and approached the threshold for en-route airspace even after accounting for the fact thatlive aircraft state data time stamp was truncated to the nearest second. While the transmission mechanismfor ingesting the data into the LVC network via 3G cellular technologies may have too great of an inherentlatency to be truly effective for our purposes, it is not the only transmission option. Once the Ikhana aircraftis available for testing, data will be collected using its existing Ethernet connection between the GCS andthe LVC.The B747 and Ikhana virtual simulators performed with minimal latencies observed (in the tens ofmilliseconds range) when publishing data to the LVC messaging components. In addition, data gathered tocalculate the time it takes to transmit the state message between NASA Ames and NASA facilities at Glennand Dryden indicate no issues with running those assets remotely.While the MACS Simulation Manager was able to publish constructive state updates well under therequired operational threshold, its latency was significantly greater than the virtual simulators. In addition,under the higher traffic loads, MACS dropped and duplicated a significant number of state messages. Theseresults provide two valuable insights: some delay may need to be applied to virtual simulator data sourcesin order to properly synchronize with constructive traffic and the throughput of the existing LVC systemfalls somewhere between 100 and 200 aircraft. Since the anticipated aircraft scenarios for the integratedtests include 50-60 aircraft, this indicates the LVC is ready to support the project’s integrated Human in theLoop simulation. It also increases our confidence that the flight test requirements will also be met by thedistributed LVC environment.Questions raised by these analyses will continue to be investigated as the project moves forward andexercises the LVC environment. In particular, tests should be conducted utilizing the Ikhana’s or otheraircrafts’ transmission mechanisms for sending live state data to the LVC. As stated above, the nature ofthe MACS Simulation Manager state data latency should be investigated and mitigated if possible. Thecandidate air traffic control display should be instrumented to record the time state data as actuallydisplayed; this would provide the missing latency data not covered in this report. Finally, since any changesto the LVC could impact overall latency, each instance of the LVC developed to support a simulation orflight test should be tested to determine whether the latencies are still within acceptable levels.†NASA’sIkhanaMQ- ‐9Predatoraircraftwasoriginallyslatedforflight- stestduetoaserviceupgrade.5
Page6of49TableofContentsExecutive Summary . 41Introduction . 91.11.22Test Item Description .9Overall Test Objectives .11Method and Materials . 122.1 Test Resources .122.1.1 Software Components .122.1.2 Live Resources .142.1.3 Virtual Resources .142.1.4 Constructive Resources .142.1.5 Test Facilities .142.1.6 System Time Synchronization .142.2 Test Design .152.2.1 Measures of Performance (MOP).152.2.2 Characterization Configurations.153Results . 293.1 Configuration Results .293.1.1 Configuration 1: Simulated Traffic to ATC on DSRL Network .303.1.2 Configuration 2: Simulated Traffic to ATC via HLA on DSRL Network .323.1.3 Configuration 3: Simulated Traffic to ATC via HLA between DSRL and CVSRF 333.1.4 Configuration 4: B747 Flight Simulator Data to DSRL via HLA .343.1.5 Configuration 5: Simulated Traffic to ATC via LVC Gateway between DSRL andCVSRF .353.1.6 Configuration 6: Simulated Traffic to GCS and Ikhana Simulator Data betweenDSRL and RAIF via NISN .363.1.7 Configuration 7: Simulated Traffic to GCS between DSRL and NASA Glenn UASCommunication lab via Internet.373.1.8 Configuration 8: Live Aircraft Data between S-3B Viking and LVC Gateway atNASA Glenn UAS Communication Lab .383.2 Compilation Results .393.2.1 Publishing Live Aircraft State Data to the LVC .393.2.2 Publishing Virtual Aircraft State Data to the LVC .403.2.3 Publishing Constructive Aircraft State Data to the LVC .413.2.4 Documentation of Latencies Between Tested Facilities .423.2.5 Combined Analyses .434Conclusion . 45Appendix A: Acronyms . 47References . 49CharacterizationReport
Page7of49List of Figures:Figure 1. High-level view of the system under test . 11Figure 2. Diagram of all test components - test configurations are a subset of this set. . 17Figure 3. Configuration 1: LVC system configuration used to determine internal MACS/ADRS latencies 18Figure 4. Configuration 2: LVC system configuration used to determine latency added by the use of HLA. 19Figure 5. Configuration 3: LVC system configuration used to determine latency added due to thedistribution of the LVC across different networks . 21Figure 6. Configuration 4: LVC system configuration used to determine the latency of remote facilitiessending aircraft data back to the LVC Hub . 22Figure 7. Configuration 5: LVC system configuration used to determine whether the LVC Gateway addsany additional latency beyond the use of the specific HLA Toolboxes . 24Figure 8. Configuration 6: LVC system configuration used to determine the latency when distributingacross the NASA Integrated Services Network . 25Figure 9. Configuration 7: LVC system configuration used to determine the latency when distributing aremote site via a VPN over the Internet . 27Figure 10. GRC S-3B Channel Sounding Flight Test Communications Architecture . 28Figure 11. Configuration 8: LVC system configuration used to determine the latency of receiving liveaircraft telemetry data . 29Figure 12. Observed latencies for direct MACS state data generation to display time . 31Figure 13. Observed latencies for a typical aircraft during the 200 aircraft traffic load. 32Figure 14. Observed latencies during the 400 Aircraft Scenario of the B747 state data including time to theHLA at the DSRL . 35Figure 15. Example of Discrete Buffering from Live Aircraft . 39Figure 16. State Data Publishing Latency, Ikhana vs B747 . 41Figure 17. State Data Publishing Latency for the MACS SimMgr with Standard Deviations . 42Figure 18. HLA Transit Latency, CVSRF vs Dryden vs Glenn . 43Figure 19. End-to-End Latency Comparison based on Average Latencies . 44Figure 20. End-to-End Latency Comparison based on Average Latencies plus 2 Standard Deviations . 45CharacterizationReport
Page8of49List of Tables:Table 1. Facilities used during LVC Characterization testing and the type of network connection they haveto the LVC Hub at DSRL . 14Table 2. Data collected for Configuration 1 . 18Table 3. Data collected for Configuration 2 . 19Table 4. Data collected for Configuration 3 . 21Table 5. Data collected for Configuration 4 . 22Table 6. Data collected for Configuration 5 . 24Table 7. Data collected for Configuration 6 . 25Table 8. Data collected for Configuration 7 . 27Table 9. Data collected for Configuration 8 . 29Table 10. Observed Latencies between MACS SimMgr and MACS DSR . 30Table 11. MACS publishing time to LVC (HLA) . 32Table 12. HLA Transit Times (local network) . 33Table 13. HLA Transit Times between DSRL and CVSRF . 34Table 14. B747 Latency to HLA . 34Table 15. Transit Time between HLA in DSRL and LVC Gateway in CVSRF . 36Table 16. HLA Transit Times between DSRL at NASA Ames and RAIF at NASA Dryden . 37Table 17. Ikhana State Data Publishing Time to Dryden LVC Gateway . 37Table 18. Transit time between Ames HLA and Glenn LVC Gateway. 38Table 19. S-3B State Data Publishing Latency to Glenn LVC Gateway . 38Table 20. S-3B State Data Publishing Latency to Glenn LVC Gateway (Best Case) . 40CharacterizationReport
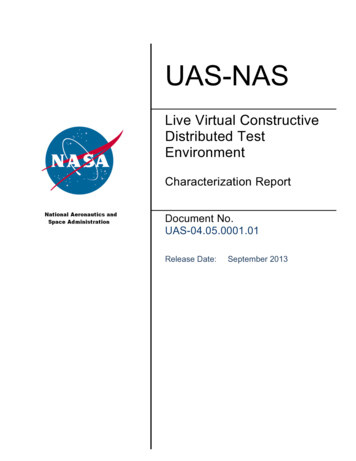
Page9of491 IntroductionThe Unmanned Aircraft Systems (UAS) Integration in the National Airspace System (NAS) Project isinvestigating and integrating technologies that are intended to reduce technical barriers related to the safetyand operational challenges associated with enabling routine UAS access to the NAS. To support this goal,the Integrated Test and Evaluation (IT&E) subproject is developing a distributed Live, Virtual,Constructive (LVC) test environment to enable human-in-the-loop (HITL) simulation and flight testactivities. LVC test environments are not a new concept; they are widely used by the Department ofDefense to provide a safe and relevant test environment.1,2 A constructive simulation generally has nointeractive human involvement in simulated conditions. Instead, scenarios unfold using rule-baseddecisions that control the interactions between simulated actors. Virtual simulations involve real actorsoperating simulated systems (i.e., human/operator interaction in the use of the model or simulation). A livetest environment involves real actors operating real systems. Categorizing a simulation as live, virtual, orconstructive is problematic since there is no clear division between these categories. Also, the degree ofhuman participation in a simulation is infinitely variable, as is the degree of equipment realism.The LVC test environment for the UAS Integration in the NAS Project is comprised of air traffic control(ATC), constructive and virtual aircraft simulators, and UAS ground control stations (GCS) that togetherprovide researchers with a relevant unmanned environment. In order to maximize the use of availableresources, the LVC test environment is designed to be distributed in such a way that technologiesdeveloped by our research and external partners can be more easily integrated into the simulation or flightenvironment. Due to the distributed nature of the LVC test environment, the latencies of messages passedbetween the LVC components observed in standalone simulations must be characterized and clearlyunderstood to assess the overall simulation. In addition, to properly synchronize live, virtual, andconstructive data, it is critical to understand the latency inherent between distributed components of theLVC test environment, henceforth referred to as the LVC.Utilizing an existing government off the shelf aircraft traffic generator and air traffic control display, adistributed LVC system was developed to test the message latencies between distributed LVC components.The system contains the core infrastructure components specifically developed to distribute and record themessages. This test version of the LVC system allows the LVC components to be distributed acrossdifferent facilities providing for the testing of message latency across various network topologies with theunderstanding that message latency may be affected by the throughput of the message traffic andbandwidth of the network.This report documents message latencies observed over eight LVC instantiations or configurationsdesigned to address different possible system architectures. For each configuration, four scenarios withprogressively increasing air traffic loads were used to determine system throughput and bandwidth impactson message latency. The analyses cover the observed latencies for messages sent from the aircraft datasources (constructive state data generators, virtual aircraft simulators, and live aircraft telemetry data) toATC displays across the LVC system. Understanding the LVC capabilities and performance characteristicswill allow developers to account for and mitigate known system delays to create a more realistic testenvironment.1.1 Test Item DescriptionThe characterization tests were designed to evaluate the throughput and data latencies for specificcommunication paths between the core LVC system components, specifically the LVC Gateway and theHigh Level Architecture (HLA) middleware. Figure 1 depicts the high level LVC system architecture. Inthis diagram, the components representing live, virtual, and constructive systems (shown as ovals) sendCharacterizationReport
Page10of49position updates of the aircraft they support and receive position updates for all other aircraft in the system.The LVC Gateways and HLA Toolboxes (shown as rectangles) distribute these data to the components thatsubscribe to the data including the Cockpit Display of Traffic Information (CDTI) displays residing at thetraffic sources and air traffic control (ATC) displays (also oval). Many factors can affect the flow of datafrom the aircraft data sources through the LVC system components, including the type and architecture ofthe network, speed of the processors running the systems, and the way the components have beenimplemented. The LVC is not a static simulation environment, but a dynamic system that provides theinfrastructure for connecting different air traffic components in order to emulate the relevant environmentrequired for a simulation. These tests were designed to provide data to measure the performance of theexisting core LVC prototype software and hardware by measuring the latencies between specific LVCcomponents across different network architectures. Since an LVC instantiation can be constructed in manydifferent configurations, the tests focus on determining the latencies between several component connectionoptions and fall into four categories:1.2.3.4.Latencies to publish live aircraft state data for distribution to the rest of the LVCLatencies to publish virtual aircraft state data for distribution to the rest of the LVCLatencies to publish constructive aircraft state data for distribution to the rest of the LVCLatencies between distributed facilities.The outcomes of these tests inform the development of future LVC instantiations for upcoming tests (flightand human in the loop simulations) and help determine whether changes to the existing LVC will benecessary to meet required performance characteristics. Eight distinct test configurations have beendesigned featuring combinations of simulated and live data across various distributed facilities; each isdescribed in detail in later sections.CharacterizationReport
Page11of49Figure 1. High-level view of the system under test1.2 Overall Test ObjectivesThe goal of the LVC is to provide a simulation infrastructure that emulates an operational air traffic controlenvironment able to mix live and simulated air traffic data. This goal provides the LVC development teamwith timing data that can be used to bound the latency results. Operationally, the maximum allowablelatency is based on a combination of the surveillance source timing and the required time for processingand display at the facility. ATC Terminal facilities have 1.0 second processing requirement, while En-routefacilities have a 1.6 second processing requirement.3 When combined with the radar sensor andcommunication timing this allows 2.2 seconds and 3.0 seconds for detection to display time to the Terminaland En route facilities, respectively.3,4 The maximum allowed generation and transmission time for ADS-Bdata is 2.5 seconds allowing for a total of 5.0 seconds for display in the cockpit.5,6In order to capture the data required to inform the latencies measurements of our four focus categories, theLVC Characterization test had two primary objectives:1.2.Determine the time differential for each aircraft state data message produced by the aircraft datasources between when the message originated and when it was received at specific points withinthe LVC network.Measure the throughput of the aircraft state data messages at specific points on the LVC system.These objectives are not mutually exclusive. The second (or throughput) objective supports the first byproviding the opportunity to measure latencies while increasing the number of aircraft in the system. TheCharacterizationReport
Page12of49anticipation is that increased aircraft messages will also increase the observed latencies, however, can athreshold where the differences in latencies are significant be determined? In addition, the LVC is builtupon components that have traditionally supported scenarios of 80 or less aircraft. By increasing the trafficload during each test configuration, the intention is to investigate whether a throughput capacity can bedetermined.The first not only provides the data to understand how long it takes to send an aircraft message to remotesystems, but more importantly can be used to understand the time it takes to send messages between twospecific components (in Figure 1, refer the LVC Gateway at each aircraft data source and the LVCGateway Toolbox at the ATC Hub). In this way partial latency contributions between intermediatecomponents can be used to build a unique LVC instantiation for a given set of requirements.These objectives, when applied together along different points and among different LVC configurations,provide a general understanding of the system in terms of its ability to transmit the appropriate data in atimely manner. Due to the anticipated need to synchronize data from live, virtual, and constructive aircraftduring testing, precise measurement of the latencies for these different air traffic inputs is critical.2 Method and Materials2.1 Test Resources2.1.1 Software ComponentsThis section provides background information on the LVC components that were used during thecharacterization tests.2.1.1.1 Multi-Aircraft Control System and the Aeronautical Data Link and RadarSimulatorThe Multi-Aircraft Control System (MACS) is a software program that can be configured to emulate eithera pseudo pilot control station‡ or an air traffic control display. The MACS Simulation Manager (SimMgr)reads in a simulation file that specifies the flight path, flight intent, and starting position for a set of aircraft.It then generates flight trajectories for these aircraft and provides the LVC with position updates. For thisseries of tests, the SimMgr was run as a constructive aircraft data source, providing simulated aircraft datawithout pilot input. On the ATC side, MACS was configured to run a Display System Replacement (DSR)or Host emulation for test monitoring and display time logging for some of the test configurations. TheAeronautical Data Link and Radar Simulator (ADRS) is a companion program to MACS. It translates,filters, and transmits messages to and from instances of both the MACS SimMgr and MACS DSR.7 MACSand ADRS were developed at NASA Ames Research Center (ARC) for the purpose of Air Traffic Controlsimulation and are treated as Government off the Shelf (GOTS) software.2.1.1.2 Cockpit Situation DisplayThe Cockpit Situation Display (CSD) is a software platform developed by NASA Ames to researchconcepts related to the display of information to a pilot.8 Many of the Human System Integration GroundControl Station research technologies have been tested via the CSD. For this test, the CSD was used for testmonitoring and to provide a destin
The LVC is being developed in support of the UAS Integration in the NAS Project, which is investigating and integrating technologies that are intended to reduce technical barriers related to the safety and operational challenges associated with enabling routine UAS access to the NAS. To support this goal, the