Transcription
Demand Forecasting, Planning, andManagementLecture to 2007 MLOG ClassSeptember 27, 2006Larry Lapide, Ph.D.Research Director, MIT-CTLLarry Lapide, 2006Page 1
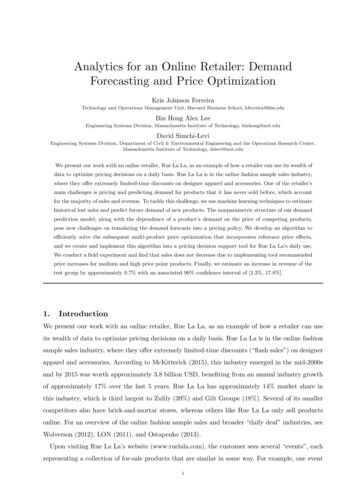
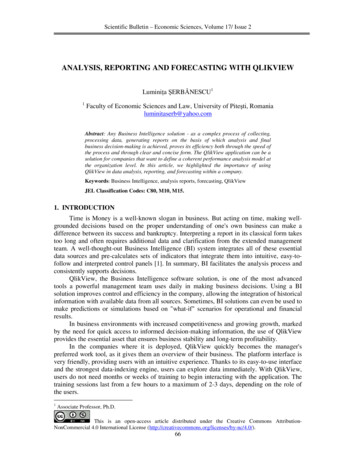
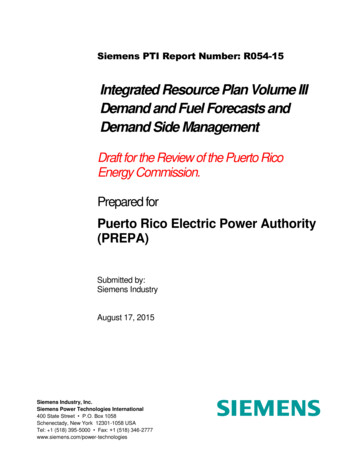
What Are Demand Forecasting, Planning, and Management?What should we do toshape and create demand?Demand PlanningWhat will demand be for agiven demand plan?Demand ForecastingHow do we prepare forand act on demand whenit comes in?Demand ManagementLarry Lapide, 2006Page 2
Agenda Industry Trends Demand forecasting– Process– Methods Demand planning (with supply in mind) Demand managementLarry Lapide, 2006Page 3
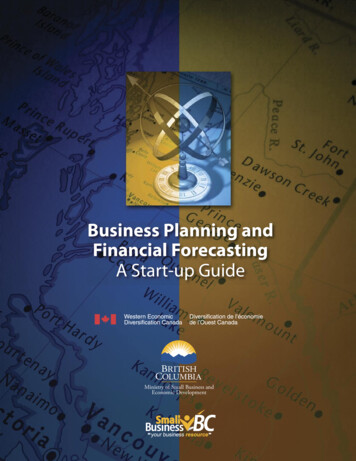
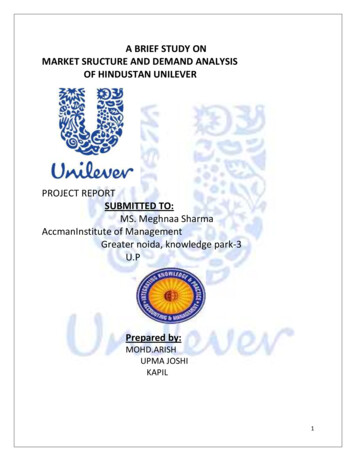
Industry Trends – Movement From Push to ersDistributors/WholesalersRetailersConsumersMake what we will sell, not sell what we make!Larry Lapide, 2006Page 4Figure by MIT OCW.
Now Moving to Demand-Driven and “Commercialized”Supply ChainsAligning supply and demand plans to helps ensure optimized ingLarry Lapide, 2006Page 5
Agenda Industry Trends Demand forecasting– Process– Methods Demand planning (with supply in mind) Demand managementLarry Lapide, 2006Page 6
A Business Needs a Forecast of What Might Happen, NotJust a Real-time ViewImage from comic strip removed due to copyright restrictions.Larry Lapide, 2006Page 7
Why Do Companies Need to Forecast?Demand forecasting supports corporate-wide planning activitiesLevel of ForecastPurposesStrategic( years)Business planningCapacity planningTactical ( quarterly)Brand plansFinancial planning/budgetingSales planningManpower planningTactical (months/weeks)Short-term capacity planningMaster planningInventory planningOperational( days/hours)Transportation planningProduction schedulingInventory deploymentLarry Lapide, 2006Page 8OperationalForecasts
Forecasting Process: Four Success Factors1. An integrated forecast organization2. “Single number” forecasting process3. Part of a Sales and Operations Planning (S&OP) process4. Performance measurementsLarry Lapide, 2006Page 9
1. Forecasting OrganizationA integrated approach is driven by a stakeholder organization that is charteredwith driving commitment and accountability to “single number” consensus-basedforecastsIntegrated nce Forecast administration driven by a stakeholder Stakeholder responsible for getting input from others Responsible for driving to a reconciled consensusforecast Less important which function is stakeholder, butusually marketing or operationsLarry Lapide, 2006Page 10Logistics/Forecasting
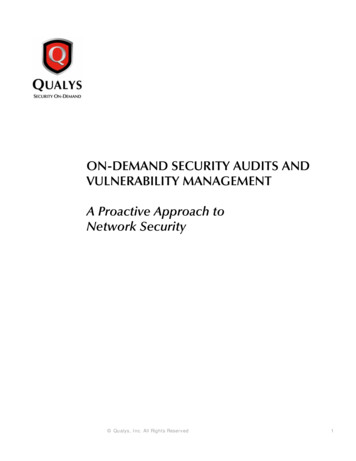
1. Forecasting Organization: Where Function ResidesWhere the Forecasting Function tion: 26%Sales: 17%Marketing: 13%Logistics: 12%Strategic Planning: 12%Forecasting Dept: 8%Others: 8%Finance: 5%*Source: C. Jain, “Benchmarking Forecasting Practices in Corporate America”, JBF, Winter 2005-06Larry Lapide, 2006Page 11
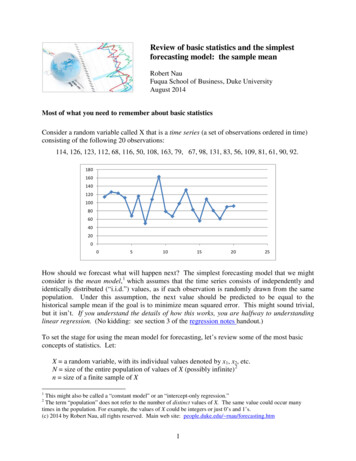
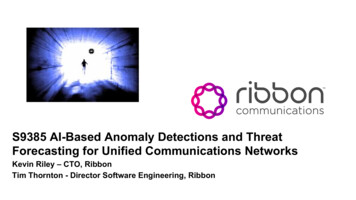
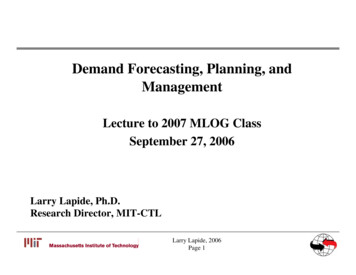
1. Forecasting Organization: Where Function ResidesSUMMARY OF PROS AND CONS OF PUTTING THE FORECASTING FUNCTION IN EACHTYPE OF DEPARTMENTDepartmentObjectivityBusiness Understanding Quantitative SkillsOrganizational SkillsStandalone ForecastingObjective, but not impactedby demandNo direct contact wihcustomersHigh LevelHigh level of disciplineMarketingObjective, but some bias fromperformance goalsVery good understanding offuture customer needsLow LevelModerate level of disciplineProduction, Operationsand LogisticsObjective and impactedby demandLittle direct contact withcustomersHigh LevelHigh level of disciplineBias from sales goals andcommissionsHighest level of contactwith customersLow LevelLess interest in runningstructured, routine processesFinanceObjective, but some bias frombudgeting and not impactedby demandNo direct contact withcustomersHigh LevelHigh level of disciplineStrategic PlanningObjective, but not impactedby demand and view is toolong-termNo direct contact wihcustomersHigh LevelHigh level of disciplineSalesFigure by MIT OCW.Larry Lapide, 2006Page 12
1. Forecasting Organization: Skills and Tasks* Skills needed– Quantitative– Computer– Oral communications– Understanding of the business– Process management Dividing up the work by– Sales channels– Product lines or brands– Geographies– Skill sets*Source: L. Lapide, “Organizing the Forecasting Department”, JBF, Summer 2003Larry Lapide, 2006Page 13
2. Single Number Forecasting Process: ManufacturerOne l Manager/CEO/CFOCompanyDivisions / RegionsProduct Lines / Channels/ Sales TerritoriesProduction Lines /Warehouses/ SKUsLarry Lapide, 2006Page 14Divisional GMs /PresidentsMarketing/SalesOperations/ Logistics
2. Single Number Forecasting Process: RetailerOne l Manager/CEO/CFOCompanyChain / ChannelsItems / CategoryDepartments / StoresLarry Lapide, 2006Page 15Divisional GMs /PresidentsMerchandisers / BuyersStore Operations
2. Single Number Forecasting Process: Forecasting &Planning HierarchiesSingle number forecasts/plans need to be translated into termsstakeholders can understandDemand-side ViewsSupply-side ViewsFinancial ViewsmComCo nypanpaymComCo nypanpayarComYepanyRegioAcco unSales Vi( ) ewnststduc esorP goriteCasandBrngetikrMa View s)itUn, (War ehousShipLoc -toationsLogisVie tics(U n wCa its,se s)esntsPlanctioudPro inesLnguritcfanu wMa Vie ts)i(UnLarry Lapide, 2006Page 16DiviBU sions/sOpeUni ratingtsBudgetar(Re Units yvenuMargin es &s )ersartQueksWeeTim nuesve(Re & s)nrgiMa
2. A Hierarchy Is Leveraged By Top-Down and Bottom-UpForecasting in Baseline ForecastingCompany (Units)WarehousesShip-To 1Ship-To 2Company ( )mComCo nyp anpayWarehousesShipLoc -Toa t ionsLogisVie tics(U n wCas its,e s)uct sdoPr gorieteCaBCategory 1dsnargtinekrMa View s)nitU( ,Larry Lapide, 2006Page 17BrandsCategory 2Category 3
2. The Hierarchy is Also Leveraged When IncorporatingMarket Intelligence Into Forecasts/PlansLogisticsManagermComCo nyp anpayWarehousesShipLoc -Toa t ionsLogisVie tics(U n wCas its,e s)tduc esorP goriteCasan drBingterkMa View s)nitU,( Larry Lapide, 2006Page 18BrandManager
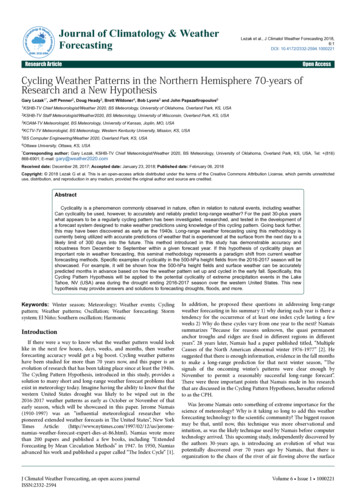
3. Part of an S&OP ProcessAn S&OP Process Is Driven by a Baseline Demand ForecastS&OP MeetingsDemandReview/Consensus onsOperationsSalesSupplySales Baseline Demand Forecast Must be estimate of trueunconstrained demandThe “Sanity” checkMust represent unbiased,unemotional viewOften generated viastatistical methodsShould include all knownimpacts on demand such- New product plans- Promotional/pricingplans- Competitive landscapeReview/MarketingFinanceConsensus MeetingFigure by MIT OCW. Unconstrained Demand Forecast Constrained Demand Forecast Supply PlansLarry Lapide, 2006Page 19 Rough Cut Supply Plans Supply Constraints
3. Part of an S&OP Process: Elements of S&OP meetings Number of meetings– One: To match supply and demand– Three: Demand, then supply, then final executive-leveladjustments Frequency and length– Monthly or weekly– 2 hours to half of a day Cross-functional– Demand forecasting organization– Supply chain– Operations ( e.g., manufacturing, logistics)– Marketing– Sales– FinanceLarry Lapide, 2006Page 20
3. Part of an S&OP Process: Success Factors1.2.3.4.5.6.7.8.Ongoing routine S&OP meetingsStructured meeting agendasPre-work to support meeting inputsAn unbiased baseline forecast to start the processCross-functional participationParticipants empowered to make decisionsAn unbiased, responsible organization to run a disciplinedprocessInternal collaborative process leading to accountability/consensusLarry Lapide, 2006Page 21
4. Performance MeasurementsDemand Forecasting Needs Process-based Performance Metrics(e.g., KPIs)– Forecast accuracy– Variance to baseline forecast– Forecast versus budget– Adherence to demand plan ( i.e., sales andmarketing plan)Larry Lapide, 2006Page 22
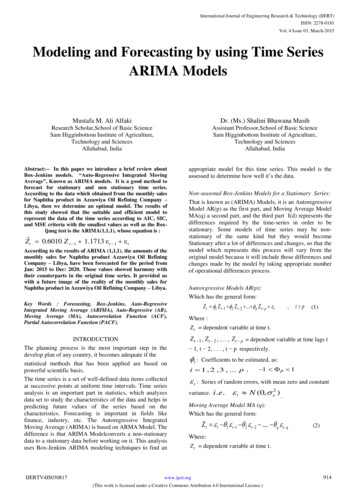
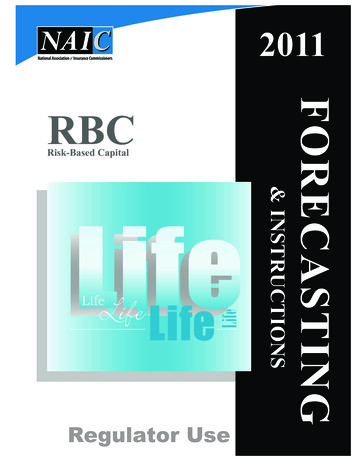
Forecasting Methods140Times Series Î?135Uses prior history toproject1201251008010080601992Life CycleÎUses the sales curve ofsimilar products orproduct lines199319941995CumulativeSalesTimeCause-Effect ÎUses cause-effectrelationships, uses forecastof cause to predict effectEffectCauseJudgmentalÎUses opinion-basedinformationLarry Lapide, 2006Page 231996
Forecasting MethodsForecasters need to understand demand variationBusiness CyclePromotional/EventUnknownTrendSeasonalPercent of Demand Variation Analysis(Components of Demand Variation )Larry Lapide, 2006Page 24
Forecasting MethodsProduct lines need to be segmented to help identify the types of forecastingmethods neededProduct SegmentCommon MethodsNew products Life cycleMature products Time series (with trend andseasonality)Promoted and event-based products Time series Event, cause-effectSlow-moving or sporadic Croston’s PoissonKits and subassemblies Parent-child relationships Planning billsCannibalized Dependent Life cycleLarry Lapide, 2006Page 25
Bottom-Up and Top-Down ForecastingAggregate GroupDemandAggregated product demand is less variable than individual demands,TimeEntity 2TimeEntity 3DemandDemandDemandEntity 1TimeTime so a forecast of the aggregate is more accurate then individualforecasts aggregatedLarry Lapide, 2006Page 26
Bottom-Up and Top-Down ForecastingAggregate GroupBOTTOM-UP FORECASTINGTo Group LevelAggregate ForecastEntity 1Entity 2Entity 3Forecast At Entity LevelTOP-DOWN FORECASTINGForecast At Group LevelAggregate GroupDisaggregate ForecastEntity 1Entity 2Entity 3Larry Lapide, 2006Page 27To Entity Level
Bottom-Up and Top-Down ForecastingDemandHowever, top-down does not always workTimeTimeEntity 2Entity 3DemandDemandEntity 1DemandAggregate GroupTimeTime so bottom-up followed by top-down and middle-out is often bestLarry Lapide, 2006Page 28
Forecasting MethodsMulti-tier Forecasting Methods Make Use of POS/ Consumption andOther Downstream InformationMulti-tiered ForecastingManufacturer Sell-inSell-ThruConsumerDistribution PipelineFigure by MIT OCW.Figure by MIT OCW.ManufacturerOrderForecast DistributionPipelineInformation(inventory, sales) Larry Lapide, 2006Page 29ConsumerDemand(POS or Point- ofConsumption )Information
Agenda Industry Trends Demand forecasting– Process– Methods Demand planning (with supply in mind) Demand managementLarry Lapide, 2006Page 30
Demand Planning (with supply in mind)The 4P’s of marketing: Product decisions - packaging and sizes Pricing decisions - list and discounts Promotional decisions - consumer and trade Place – distribution and sales channelsWhile demand plans are developed by Marketing and Sales, theyshould be made in the context of supply-side planningLarry Lapide, 2006Page 31
Demand Planning (with supply in mind)Supply-side issues to consider when demand planning Supply feasibility of demand plan “True” profitability analysis of demand plan Supply-opportunity based plans – e.g., excess inventories orplant capacity Jointly optimized supply and demand planLarry Lapide, 2006Page 32
Agenda Industry Trends Demand forecasting– Process– Methods Demand planning (with supply in mind) Demand managementLarry Lapide, 2006Page 33
Demand Management Processes Bridge Supply andDemand-Side Management To Optimize d-SideManagementDM Processes Operations Logistics Marketing Supply Chain Sales MerchandizePlanning Merchandizing CustomerServiceFigure by MIT OCW. ProcurementMatching supply and demand Long Term Medium term Short Term FinanceFigure by MIT OCW.CustomersFigure by MIT OCW.Maximize revenues and marginsMinimize costs and inventoriesMaximize sustained profitabilityLarry Lapide, 2006Page 34
Demand Management Process ScopeUpstream InformationSupply nPlanningGlobal S&OP Optimization Risk MgmtStrategicGoals andObjectives CustomerService Segments T&Cs ProgramsOrder PromisingDemand PlanningForecastingDemand-ShapingDownstream InformationLarry Lapide, 2006Page 35Orders(Momentsof truth)
Service-Related Terms and Conditions and Programs SetCustomer Expectations in the Long-RunDifferentiated Service ProgramsCustomer SegmentsHigh Tier Services Sharing of downstream data(e.g., POS) Sharing of replenishment plansand sales forecasts Co-managed inventoryprogramsTop TierMid-Tier services Special handling and packaging Reduced delivery cycles times Full-truckload discountsMid TierBasic Services Standard delivery cycle time Standard handling andpackagingLowest TierLarry Lapide, 2006Page 36
Order Promising Needs to Address Complex CustomerDemand Questions– Do I fill this customer’s order right now?– If not now, when?– Should I fill it using available or planned inventories?– Should I fill it using available or future production capacity?– Should I fill it using available or future materials?– Is this customer’s order more important than another customer’sfuture order?– Is this customer order more important than a warehouse or plantreplenishment order?– If I take the order, at what price?Larry Lapide, 2006Page 37
The Importance of Order Promising– Accurate Order Promising Insures making a promise you can keep Reduces expediting costs Increases customer satisfaction– MIT survey on Order Promising shows (% of companies) 11% do not promise at the time of an order 49% use a standard lead time list 42% check available inventory (Available-to-Order, ATP) 24% check production schedules (ATP) 14% check available production capacity, parts and materials (Capable-toOrder, CTP)Larry Lapide, 2006Page 38
Questions?Larry Lapide, 2006Page 39
Objectivity Business Understanding Quantitative Skills Organizational Skills SUMMARY OF PROS AND CONS OF PUTTING THE FORECASTING FUNCTION IN EACH TYPE OF DEPARTMENT Figure by MIT OCW. Larry Lapide, 2006 Page 13 1. Forecasting Organization: Skills and Tasks* Skills needed – Quantitative – Computer – Oral communications – Understanding of the business – Process