Transcription
Analytics for an Online Retailer: DemandForecasting and Price OptimizationKris Johnson FerreiraTechnology and Operations Management Unit, Harvard Business School, kferreira@hbs.eduBin Hong Alex LeeEngineering Systems Division, Massachusetts Institute of Technology, binhong@mit.eduDavid Simchi-LeviEngineering Systems Division, Department of Civil & Environmental Engineering and the Operations Research Center,Massachusetts Institute of Technology, dslevi@mit.eduWe present our work with an online retailer, Rue La La, as an example of how a retailer can use its wealth ofdata to optimize pricing decisions on a daily basis. Rue La La is in the online fashion sample sales industry,where they offer extremely limited-time discounts on designer apparel and accessories. One of the retailer’smain challenges is pricing and predicting demand for products that it has never sold before, which accountfor the majority of sales and revenue. To tackle this challenge, we use machine learning techniques to estimatehistorical lost sales and predict future demand of new products. The nonparametric structure of our demandprediction model, along with the dependence of a product’s demand on the price of competing products,pose new challenges on translating the demand forecasts into a pricing policy. We develop an algorithm toefficiently solve the subsequent multi-product price optimization that incorporates reference price effects,and we create and implement this algorithm into a pricing decision support tool for Rue La La’s daily use.We conduct a field experiment and find that sales does not decrease due to implementing tool recommendedprice increases for medium and high price point products. Finally, we estimate an increase in revenue of thetest group by approximately 9.7% with an associated 90% confidence interval of [2.3%, 17.8%].1.IntroductionWe present our work with an online retailer, Rue La La, as an example of how a retailer can useits wealth of data to optimize pricing decisions on a daily basis. Rue La La is in the online fashionsample sales industry, where they offer extremely limited-time discounts (“flash sales”) on designerapparel and accessories. According to McKitterick (2015), this industry emerged in the mid-2000sand by 2015 was worth approximately 3.8 billion USD, benefiting from an annual industry growthof approximately 17% over the last 5 years. Rue La La has approximately 14% market share inthis industry, which is third largest to Zulily (39%) and Gilt Groupe (18%). Several of its smallercompetitors also have brick-and-mortar stores, whereas others like Rue La La only sell productsonline. For an overview of the online fashion sample sales and broader “daily deal” industries, seeWolverson (2012), LON (2011), and Ostapenko (2013).Upon visiting Rue La La’s website (www.ruelala.com), the customer sees several “events”, eachrepresenting a collection of for-sale products that are similar in some way. For example, one event1
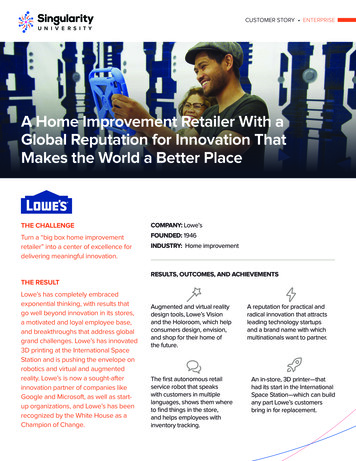
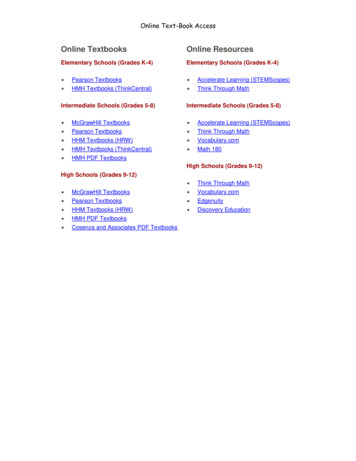
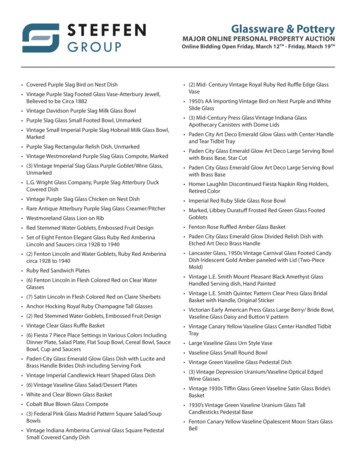
Ferreira, Lee, and Simchi-Levi: Analytics for an Online Retailer2Figure 1Example of three events shown on Rue La La’s websiteFigure 2Example of three styles shown in the men’s sweater eventmight represent a collection of products from the same designer, whereas another event mightrepresent a collection of men’s sweaters. Figure 1 shows a snapshot of three events that haveappeared on their website. At the bottom of each event, there is a countdown timer informing thecustomer of the time remaining until the event is no longer available; events typically last between1-4 days.When a customer sees an event he is interested in, he can click on the event which takes himto a new page that shows all of the products for sale in that event; each product on this page isreferred to as a “style”. For example, Figure 2 shows three styles available in a men’s sweater event(the first event shown in Figure 1). Finally, if the customer likes a particular style, he may clickon the style which takes him to a new page that displays detailed information about the style,including which sizes are available; we will refer to a size-specific product as an “item” or “SKU”.The price for each item is set at the style level, where a style is essentially an aggregation of allsizes of otherwise identical items. Currently, the price does not change throughout the duration ofthe event.Figure 3 highlights a few aspects of Rue La La’s procure-to-pay process that are critical in understanding the work presented in this paper. First, Rue La La’s merchants procure items fromdesigners who typically ship the items immediately to Rue La La’s warehouse1 . On a frequentperiodic basis, merchants identify opportunities for future events based on available styles in inventory, customer needs, etc. When the event starts, customers place orders, and Rue La La shipsitems from its warehouse to the customers. When the event ends or an item runs out of inventory,customers may no longer place an order for that item. If there is remaining inventory at the endof the event, then the merchants will plan a subsequent event where they will sell the same style2 .We will refer to styles being sold for the first time as “first exposure styles”; a majority of Rue La
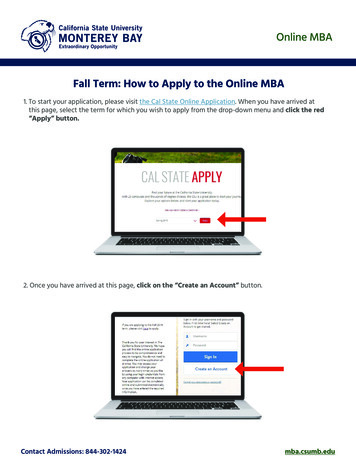
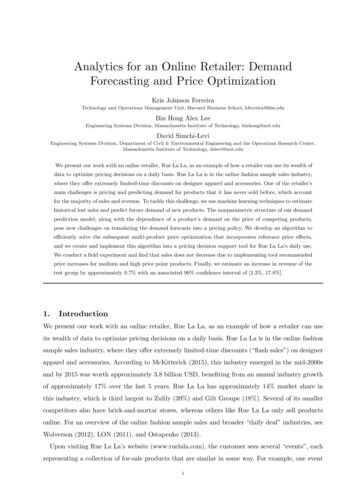
Ferreira, Lee, and Simchi-Levi: Analytics for an Online RetailerFigure 3Subset of Rue La La’s procure-to-pay processFigure 4First exposure (new product) sell-through distribution by department3La’s revenue comes from first exposure styles, and hundreds of first exposure styles are offered ona daily basis.One of Rue La La’s main challenges is pricing and predicting demand for these first exposurestyles. Figure 4 shows a histogram of the sell-through (% of inventory sold) distribution for firstexposure items in Rue La La’s top 5 departments (with respect to quantity sold). For example,51% of first exposure items in Department 1 sell out before the end of the event, and 10% sell lessthan 25% of their inventory. Department names are hidden and data disguised in order to protectconfidentiality. Since a large percentage of first exposure items sell out before the sales period isover, it may be possible to raise prices on these items while still achieving high sell-through; onthe other hand, many first exposure items sell less than half of their inventory by the end of thesales period, suggesting that the price may have been too high. These observations motivate thedevelopment of a pricing decision support tool, allowing Rue La La to take advantage of availabledata in order to maximize revenue from first exposure sales.Our approach is two-fold and begins with developing a demand prediction model for first exposure items; we then use this demand prediction data as input into a price optimization model tomaximize revenue. The two biggest challenges faced when building our demand prediction modelare estimating lost sales due to stockouts, and predicting demand for items that have no historical sales data. We use machine learning techniques to address these challenges and predict futuredemand. Regression trees - an intuitive, yet nonparametric regression model - are shown to beeffective predictors of demand in terms of both predictability and interpretability.We then formulate a price optimization model to maximize revenue from first exposure styles,using demand predictions from the regression trees as inputs. In this case, the biggest challenge weface is that each style’s demand depends on the price of competing styles, which restricts us fromsolving a price optimization problem individually for each style and leads to an exponential number
Ferreira, Lee, and Simchi-Levi: Analytics for an Online Retailer4of variables. Furthermore, the nonparametric structure of regression trees makes this problemparticularly difficult to solve. We develop a novel reformulation of the price optimization problemby exploiting a particular reference price metric, and we create and implement an efficient algorithmthat allows Rue La La to optimize prices on a daily basis for the next day’s sales. We conduct a fieldexperiment and find that sell-through does not decrease due to implementing tool recommendedprice increases for medium and high price point styles. Furthermore, we estimate an increase inrevenue of the test group by approximately 9.7% with an associated 90% confidence interval of[2.3%, 17.8%], significantly impacting their bottom line.In the remainder of this section, we provide a literature review on related research and describeRue La La’s legacy pricing process. Section 2 includes details on the demand prediction model,while Section 3 describes the price optimization model and the efficient algorithm we developed tosolve it. Details on the implementation of our pricing decision support tool as well as an analysis ofthe impact of our tool via field experiments are included in Section 4. Finally, Section 5 concludesthe paper with a summary of our results and potential areas for future work.1.1.Literature ReviewThere has been significant research conducted on price-based revenue management over the pastfew decades; see Özer and Phillips (2012) and Talluri and Van Ryzin (2005) for an excellent indepth overview of such work. The distinguishing features of our work in this field include (i) thedevelopment and implementation of a pricing decision support tool for an online retailer offering“flash sales”, including a field experiment that estimates the impact of the tool, (ii) the creationof a new model and efficient algorithm to set initial prices by solving a multi-product static priceoptimization that incorporates reference price effects, and (iii) the use of a nonparametric multiproduct demand prediction model.A group of researchers have worked on the development and implementation of pricing decision support tools for retailers. For example, Caro and Gallien (2012) implement a markdownmulti-product pricing decision support tool for fast-fashion retailer, Zara; markdown pricing iscommon in fashion retailing where retailers aim to sell all of their inventory by the end of relativelyshort product life cycles. Smith and Achabal (1998) provide another example of the developmentand implementation of a markdown pricing decision support tool. Other pricing decision supporttools focus on recommending promotion pricing strategies (e.g. see Natter et al. (2007) and Wuet al. (2014)); promotion pricing is common in consumer packaged goods to increase demand ofa particular brand. Over the last decade, several software firms have introduced revenue management software to help retailers make pricing decisions; much of the available software currentlyfocuses on promotion and markdown price optimization. Academic research on retail price-basedrevenue management also focuses on promotion and markdown dynamic price optimization. Özer
Ferreira, Lee, and Simchi-Levi: Analytics for an Online Retailer5and Phillips (2012), Talluri and Van Ryzin (2005), Elmaghraby and Keskinocak (2003), and Bitranand Caldentey (2003) provide a good overview of this literature.Rue La La’s flash sales business model is not well-suited for dynamic price optimization and isthus unable to benefit from these advances in research and software tools. There are several characteristics of the online flash sales industry that make a single-price, static model more applicable.For example, many designers require that Rue La La limit the frequency of events which sell theirbrand in order not to degrade the value of the brand. Even without such constraints placed bydesigners, flash sales businesses usually do not show the same styles too frequently in order toincrease scarcity and entice customers to visit their site on a daily basis, inducing myopic customerbehavior. Therefore, any unsold items at the end of an event are typically held for some period oftime before another event is created to sell the leftover items. To further complicate future eventplanning, purchasing decisions for new styles that would compete against today’s leftover inventory have typically not yet been made. Ostapenko (2013) provides an overview of this industry’scharacteristics.Since the popularity and competitive landscape for a particular style in the future - and thusfuture demand and revenue - is very difficult to predict, a single-price model that maximizesrevenue given the current landscape is appropriate. Relatively little research has been devoted tomulti-product single-price optimization models in the retail industry. Exceptions include work byLittle and Shapiro (1980) and Reibstein and Gatignon (1984) that highlight the importance ofconcurrently pricing competing products in order to maximize the profitability of the entire productline. Birge et al. (1998) determine optimal single-price strategies of two substitutable productsgiven capacity constraints, Maddah and Bish (2007) analyze both static pricing and inventorydecisions for multiple competing products, and Choi (2007) addresses the issue of setting initialprices of fashion items using market information from pre-season sales.In the operations management literature, aggregate demand is often modeled as a parametricfunction of price and possibly other marketing variables. See Talluri and Van Ryzin (2005) for anoverview of multi-product demand functions that are typically used in retail price optimization.One reason for the popularity of these demand functions as an input to price optimization is theirset of properties, such as linearity, concavity and increasing differences, that leads to simpler,tractable optimization problems that can provide managerial insights. In Section 2, we will betesting some of these functions as possible forecasting models using Rue La La’s data. In addition,we chose not to initially restrict ourselves to the type of demand functions that would lead tosimpler, tractable price optimization problems in hopes to achieve better demand predictions. Weshow that in fact a nonparametric demand prediction model works very well in this setting, andwe resolve the structural challenges that this introduces to the price optimization problem.
Ferreira, Lee, and Simchi-Levi: Analytics for an Online Retailer6There is also a large stream of work on individual consumer choice models which can be aggregated to estimate total demand. The most common of these are parametric, random utilitymodels which model the utility that each consumer gains when making a purchase; see Talluri andVan Ryzin (2005) for an overview of these models in operations management and Berry et al. (1995)for the basis of a popular model in industrial organization. We chose to focus on aggregate demandmodels rather than random utility models because (i) the parameter estimation requirements forthe random utility models - especially those incorporating substitution effects - are prohibitive inour situation, and (ii) each customer’s choice set is constantly changing and difficult to define.To put these issues in context, in contrast to most retailers, Rue La La’s assortment changes anaverage of twice a day when a new event begins, and the average inventory of each SKU in the assortment is less than 10 units. Although our aggregate demand model is not grounded in consumerutility theory, we believe that it is effective at predicting demand for Rue La La.1.2.Legacy Pricing ProcessFor many retailers, initial prices are typically based on some combination of the following criteria: percentage markup on cost, competitors’ pricing, and the merchants’ judgement/feel for thebest price of the product (see Subrahmanyan (2000), Levy et al. (2004), and Şen (2008)). Thesetechniques are quite simple and none require style-level demand forecasting.Rue La La typically applies a fixed percentage markup on cost for each of its styles and comparesthis to competitors’ pricing of identical styles on the day of the event; they choose whichever priceis lowest (between fixed markup and competitors’ prices) in order to guarantee that they offer thebest deal in the market to their customers. Interestingly, Rue La La usually does not find identicalproducts for sale on other competitors’ websites, and thus the fixed percentage markup is applied.This is simply because other flash sales sites are unlikely to be selling the same product on thesame day (if ever), and other retailers are unlikely to offer deep discounts of the same product atthe same time. A recent customer survey that Rue La La conducted shows that only approximately15% of their customers occasionally comparison shop on other websites.In the rest of this paper, we show that applying machine learning and optimization techniquesto these initial pricing decisions - while maintaining Rue La La’s value proposition - can have asubstantial financial impact on the company.2.Demand Prediction ModelA key requirement for our pricing decision support tool is the ability to accurately predict demand.To do so, the first decision we need to make is the level of detail in which to aggregate our forecasts.We chose to aggregate items at the style level - essentially aggregating all sizes of an otherwiseidentical product - and predicted demand for each style. The main reason for doing so is because
Ferreira, Lee, and Simchi-Levi: Analytics for an Online Retailer7the price is the same within a style regardless of the size. Also, further aggregating styles into amore general level of the product hierarchy would eliminate our ability to measure the effects ofcompeting styles’ prices and presence in the assortment on the demand of each style.One challenge we must address that arises from this decision is how to apply inventory constraints, since inventory is held for each size of the style. Let I denote the set of all styles thatRue La La sells, and given style i, let S (i) denote the set of all sizes associated with style i withs S (i) being a specific size. A unique item is thus represented by a pair (i, s) I S (i) which weabbreviate as is. The demand for a style given that there are no inventory constraints is denotedui ; the demand for a particular size is uis . In reality, Rue La La has very limited inventory of manyof their products. Inventory is held in each size of a style and is denoted by Cis ; total inventory forPstyle i is Ci s S(i) Cis . Sales for each size of a style is therefore constrained by inventory and isPdefined as dis min{Cis , uis }. Sales for the entire style is defined as di s S(i) dis .The following steps outline our demand prediction approach:1. Record sales, di , of styles sold in the past.2. Estimate demand, ui , of styles sold in the past.3. Predict demand and sales of new styles to be sold in the future, denoted ûi and dˆi , respectively.Section 2.1 outlines the available data including sales of styles sold in the past, di , and summarizesthe features, i.e. explanatory variables, that we developed from this data. Section 2.2 describeshow we estimate demand, ui , of styles sold in the past. Section 2.3 explains the development ofour regression model that predicts demand, ûi , and sales, dˆi , of future styles. Section 2.4 concludesby offering insights as to why the selected demand prediction model works well in our setting, andhighlights the implications of our model on the subsequent task of price optimization.2.1.Data for Demand Prediction ModelWe were provided with sales transactions data from the beginning of 2011 through mid-2013,where each data record represents a time-stamped sale of an item during a specific event. Thisdata includes the quantity sold of each SKU (dis ), price, event start date/time, event length, andthe initial inventory of the item. In addition, we were provided with product-related data suchas the product’s brand, size, color, MSRP (manufacturer’s suggested retail price), and hierarchyclassification. With regards to hierarchy classification, each item aggregates (across all sizes) to astyle, styles aggregate to form subclasses, subclasses aggregate to for
We present our work with an online retailer, Rue La La, as an example of how a retailer can use its wealth of data to optimize pricing decisions on a daily basis. Rue La La is in the online fashion sample sales industry, where they o er extremely limited-time discounts o