Transcription
A Leading Elliott wave ForecastingCompany (Forex, Commodities andIndices .
Day 3 (5 hours)Sunday 10.28.2012 (from 8am to 1pm est) RSIUpgrading and Downgrading RSIHow the RSI help with the EWPSTOCH-RSIHow to see cycles within the STOCH-RSIMarket Correlation
HistoryThe Elliott Wave Theory is named afterRalph Nelson Elliott. Inspired by the DowTheory and by observations foundthroughout nature, Elliott concluded thatthe movement of the stock market could bepredicted by observing and identifying arepetitive pattern of waves. In fact, Elliottbelieved that all of man's activities, not justthe stock market, were influenced by theseidentifiable series of waves.
Elliott was able to analyze markets ingreater depth, identifying the specificcharacteristics of wave patterns andmaking detailed market predictions basedon the patterns Elliott based part his workon the Dow Theory, which also definesprice movement in terms of waves, butElliott discovered the fractal nature ofmarket action. Thus he had identified.
In the 1930s, Ralph Nelson Elliott found thatthe markets exhibited certain repeatedpatterns. His primary research was with stockmarket data for the Dow Jones IndustrialAverage. This research identified patterns orwaves that recur in the markets. Very simply,in the direction of the trend, expect fivewaves. Any corrections against the trend arein three waves. Three wave corrections arelettered as "a, b, c." These patterns can beseen in long-term as well as in short-termcharts.
Ideally, smaller patterns can be identifiedwithin bigger patterns. In this sense, ElliottWaves are like a piece of broccoli, where thesmaller piece, if broken off from the biggerpiece, does, in fact, look like the big piece.This information (about smaller patterns fittinginto bigger patterns), coupled with theFibonacci relationships between the waves,offers the trader a level of anticipation and/orprediction when searching for and identifyingtrading opportunities with solid reward/riskratios.
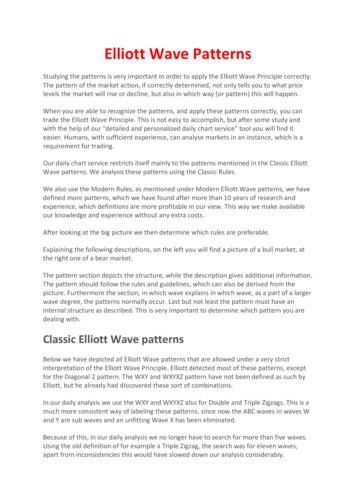
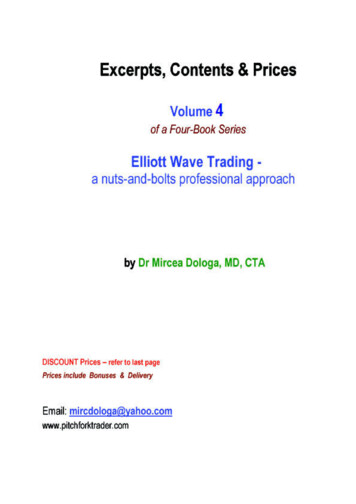
In Elliott's model, market prices alternatebetween an impulsive, or motive phase,and a corrective phase on all time scales oftrend, as the illustration shows. Impulsesare always subdivided into a set of 5 lowerdegree waves, alternating again betweenmotive and corrective character, so thatwaves 1, 3, and 5 are impulses, and waves2 and 4 are smaller retraces of waves 1and 3.
Corrective waves subdivide into 3 smallerdegree waves starting with a five-wavecounter-trend impulse, a retrace, and anotherimpulse. In a bear market the dominant trendis downward, so the pattern is reversed—fivewaves down and three up. Motive wavesalways move with the trend, while correctivewaves move against it.
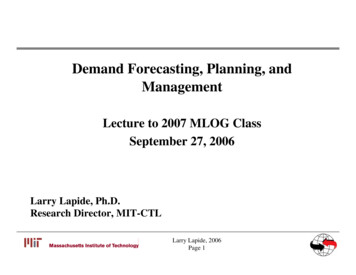
BasicsDegreesThe patterns link to form five and threewave structures which themselvesunderlie self-similar wave structures ofincreasing size or higher degree. Note thelower most of the three idealized cycles. Inthe first small five-wave sequence, waves1, 3 and 5 are motive, while waves 2 and 4are corrective.
This signals that the movement of the waveone degree higher is upward. It also signalsthe start of the first small three-wavecorrective sequence. After the initial fivewaves up and three waves down, thesequence begins again and the self-similarfractal geometry begins to unfold according tothe five and three-wave structure which itunderlies one degree higher. The completedmotive pattern includes 89 waves, followedby a completed corrective pattern of 55waves.
History
CyclesGrand supercycle: multi-centurySupercycle: multi-decade (about 40–70years)Cycle: one year to several years (or evenseveral decades under an Elliott Extension)Primary: a few months to a couple of yearsIntermediate: weeks to monthsMinor: weeksMinute: daysMinuette: hoursSubminuette: minutes
Basics Wave Degree 5s With theTrend 3s Against theTrend Supercycle (I) (II) (III) (IV)(V) (A) (B) (C) Cycle I II III IV V AB CPrimaryIntermediate(1) (2) (3) (4) (5)(a) (b) (c)Minor12345AB CMinutei ii iii iv vabc
Elliott Wave personality and characteristicsWave 1: Wave one is rarely obvious at itsinception. When the first wave of a new bullmarket begins, the fundamental news is almostuniversally negative. The previous trend isconsidered still strongly in force. Fundamentalanalysts continue to revise their earningsestimates lower; the economy probably does notlook strong. Sentiment surveys are decidedlybearish, put options are in vogue, and impliedvolatility in the options market is high. Volumemight increase a bit as prices rise, but not byenough to alert many technical analysts.
Wave 2: Wave two corrects wave one, but can neverextend beyond the starting point of wave one. Typically,the news is still bad. As prices retest the prior low,bearish sentiment quickly builds, and "the crowd"haughtily reminds all that the bear market is still deeplyensconced. Still, some positive signs appear for thosewho are looking: volume should be lower during wavetwo than during wave one, prices usually do not retracemore than 61.8% (see Fibonacci section below) of thewave one gains, and prices should fall in a three wavepattern.
Wave 3: Wave three is usually the largest and mostpowerful wave in a trend (although some researchsuggests that in commodity markets, wave five is thelargest). The news is now positive and fundamentalanalysts start to raise earnings estimates. Prices risequickly, corrections are short-lived and shallow.Anyone looking to "get in on a pullback" will likelymiss the boat. As wave three starts, the news isprobably still bearish, and most market playersremain negative; but by wave three's midpoint, "thecrowd" will often join the new bullish trend. Wavethree often extends wave one by a ratio of 1.618:1.
BasicWave 4: Wave four is typically clearly corrective.Prices may meander sideways for an extendedperiod, and wave four typically retraces less than38.2% of wave three (see Fibonacci relationshipsbelow). Volume is well below than that of wave three.This is a good place to buy a pull back if youunderstand the potential ahead for wave 5. Still,fourth waves are often frustrating because of theirlack of progress in the larger trend.
BasicWave 5: Wave five is the final leg in the direction ofthe dominant trend. The news is almost universallypositive and everyone is bullish. Unfortunately, this iswhen many average investors finally buy in, rightbefore the top. Volume is often lower in wave fivethan in wave three, and many momentum indicatorsstart to show divergences (prices reach a new highbut the indicators do not reach a new peak). At theend of a major bull market, bears may very well beridiculed (recall how forecasts for a top in the stockmarket during 2000 were received).
BasicWave A: Corrections are typically harder to identifythan impulse moves. In wave A of a bear market, thefundamental news is usually still positive. Mostanalysts see the drop as a correction in a still-activebull market. Some technical indicators thataccompany wave A include increased volume, risingimplied volatility in the options markets and possiblya turn higher in open interest in related futuresmarkets.
BasicWave B: Prices reverse higher, which many see as aresumption of the now long-gone bull market. Thosefamiliar with classical technical analysis may see thepeak as the right shoulder of a head and shouldersreversal pattern. The volume during wave B shouldbe lower than in wave A. By this point, fundamentalsare probably no longer improving, but they mostlikely have not yet turned negative.
BasicWave C: Prices move impulsively lower in fivewaves. Volume picks up, and by the third leg of waveC, almost everyone realizes that a bear market isfirmly entrenched. Wave C is typically at least aslarge as wave A and often extends to 1.618 timeswave A or beyond.
Basic3 BASIC RULESOLD EWPWave 2 always retraces less than 100% of wave 1.Wave 3 cannot be the shortest of the three impulsewaves, namely waves 1, 3 and 5.Wave 4 does not overlap with the price territory ofwave 1, except in the rare case of a diagonaltriangle.
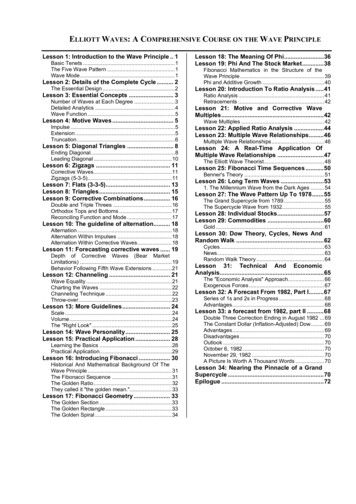
Fibonacci RatiosLeonardo Fibonacci was a 13th century accountant whoworked for the royal families of Italy. In 1242 he publisheda paper entitled "liber abaci." The basis of the work camefrom a two-year study of the pyramids at Gizeh.Fibonacci found that the dimensions of the pyramid werealmost exactly the same as the golden mean or (.618).Fibonacci is most famous for his Fibonacci SummationSeries which enabled the Old World in the 13th century toswitch from Arabic numbering (XXIV 24), to the arithmeticnumbering (24), that we use today. For his work inmathematics, Fibonacci was awarded the equivalent oftoday's Nobel Prize.
Fibonacci RatiosFibonacci Summation SeriesThe Fibonacci Summation Series takes 0 and adds 1.Succeeding numbers in the series adds the previous twonumbers and thus we have 0, 1, 1, 2, 3, 5, 8, 13, 21, 34, 55, 89to infinity. At the eighth series, by dividing 55 by 89, you havethe golden mean: .618. If you divide 89 by 55 you have 1.618.Do you see the pattern? 1 1 2, 1 2 3, 2 3 5, 3 5 8,5 8 13.These ratios, and several others derived from them, appear innature everywhere, and in the financial markets they oftenindicate levels at which strong resistance and support will befound. They are easily seen in nature (seashell spirals, flowerpetals, structure of tree branches, etc.), art, geometry,architecture and music.
Fibonacci ratiosRatios /The Golden ratio.The golden ratio is often calledthe golden section where the Greekletter phi represents the golden ratio. Itsvalue is:
Fibonacci Ratios 1 2.23/2 1.61861.8 1.618
Fibonacci etracement14.6-23.6-38.2-61.8-76.4-85.4
Fibonacci Ratios
Fibonacci sequence in nature
Fibonacci sequence in AnimalsThe eyes, fins and tail of the dolphin fall at Golden sections along the body.
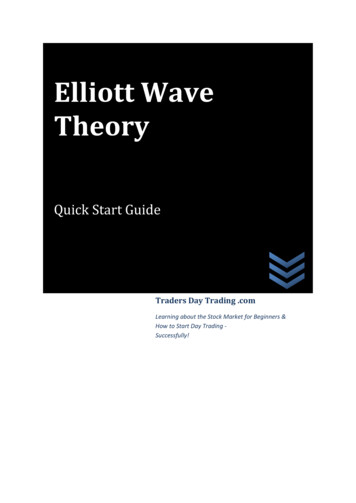
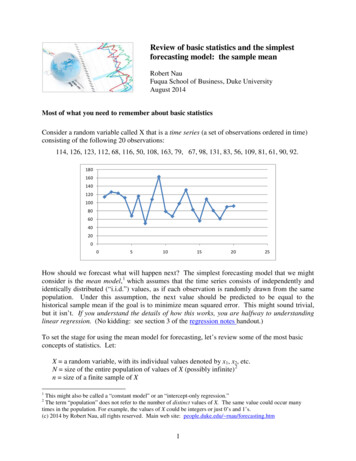
Human bodyThe white line is the body’s height.The blue line, a golden section of the white line, definesthe distance from the head to the finger tips.The yellow line, a golden section of the blue line, definesthe distance from the head to the navel and the elbows.The green line, a golden section of the yellow line, definesthe distance from the head to the pectorals and inside topof the arms, the width of the shoulders, the length of theforearm and the shin bone.The magenta line, a golden section of the green line,defines the distance from the head to the base of the skulland the width of the abdomen. The sectioned portions ofthe magenta line determine the position of the nose andthe hairline.
Human body
Basic structures /Motive and correctivesMotive waves.Elliott Wave Basics — Impulse PatternsThe impulse pattern consists of five waves. Thefive waves can be in either direction, up or down.The first wave is usually a weak rally with only asmall percentage of the traders participating. OnceWave 1 is over, they sell the market on Wave 2.The sell-off in Wave 2 is very vicious. Wave 2 willfinally end without making new lows and themarket will start to turn around for another rally.
Basic structures /Motive andcorrectives
Basic structures /Motive andcorrectives
The initial stages of the Wave 3 rally are slow, and it finally makes it to the top of the previous rally (the top of Wave 1).Basic structures /Motive andcorrectives/wave II/IIIAt this time, there are a lot of stops above the top of Wave 1.The area a lot of stops above the top of wave 1.Trades stillbelieve in the old trend .
Basic structures /Motive andcorrectivesThe Wave 3 rally picks up steam and takes the topof Wave 1. As soon as the Wave 1 high isexceeded, the stops are taken out. Depending onthe number of stops, gaps are left open. Gaps area good indication of a Wave 3 in progress. Aftertaking the stops out, the Wave 3 rally has caughtthe attention of traders.
Basic structures /Motive andcorrectives
Basic structures /Motive andcorrectives wave IV
Basic structures /Motive andcorrectives WAVE VOn the end of Wave 4, more buying sets in andthe prices start to rally again.The Wave 5 rally lacks the huge enthusiasm andstrength found in the Wave 3 rally. The Wave 5advance is caused by a small group of traders.Although the prices make a new high above thetop of Wave 3, the rate of power, or strength,inside the Wave 5 advance is very small whencompared to the Wave 3 advance.
Basic structures /Motive and correctivesExtension
Basic structures /Motive and correctives/Third wave extension
Basic structures /Motive and correctives/TruncationA truncated fifth wave does not move beyond theend of the third. It can usually be verified by notingthat the presumed fifth wave contains thenecessary five subwaves, as illustrated in Figures6 and 7.Truncation gives warning of underlying weaknessor strength in the market. In application, atruncated fifth wave will often cut short anexpected target. This annoyance iscounterbalanced by its clear implications forpersistence in the new direction of trend
Basic structures /Motive andcorrectives/ Truncation
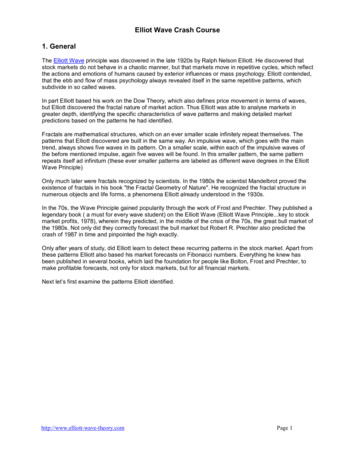
Basic structures /Motive andcorrectives/ Diagonal
Basic structures /Motive andcorrectives/ DiagonalA diagonal triangle is an impulsive pattern, yet not an impulse, as it has oneor two corrective characteristics. Diagonal triangles substitute for impulsesat specific locations in the wave structure. They are the only five-wavestructures in the direction of the main trend within which wave four almostalways moves into the price territory of (i.e., overlaps) wave one. On rareoccasions, a diagonal triangle may end in a truncation, although in ourexperience, such truncations occur only by the slimmest of margins.Ending DiagonalAn ending diagonal is a special type of wave that occurs primarily in the fifthwave position at times when the preceding move has gone "too far too fast,"as Elliott
The green line, a golden section of the yellow line, defines the distance from the head to the pectorals and inside top of the arms, the width of the shoulders, the length of the forearm and the shin bone. The magenta line, a golden section of the green line, defines the distance from the head to the base of the skull and the width of the abdomen. The sectioned portions of