Transcription
Scientific Bulletin – Economic Sciences, Volume 17/ Issue 2ANALYSIS, REPORTING AND FORECASTING WITH QLIKVIEWLuminiţa ŞERBĂNESCU11Faculty of Economic Sciences and Law, University of Piteşti, Romanialuminitaserb@yahoo.comAbstract: Any Business Intelligence solution - as a complex process of collecting,processing data, generating reports on the basis of which analysis and finalbusiness decision-making is achieved, proves its efficiency both through the speed ofthe process and through clear and concise form. The QlikView application can be asolution for companies that want to define a coherent performance analysis model atthe organization level. In this article, we highlighted the importance of usingQlikView in data analysis, reporting, and forecasting within a company.Keywords: Business Intelligence, analysis reports, forecasting, QlikViewJEL Classification Codes: C80, M10, M15.1. INTRODUCTIONTime is Money is a well-known slogan in business. But acting on time, making wellgrounded decisions based on the proper understanding of one's own business can make adifference between its success and bankruptcy. Interpreting a report in its classical form takestoo long and often requires additional data and clarification from the extended managementteam. A well-thought-out Business Intelligence (BI) system integrates all of these essentialdata sources and pre-calculates sets of indicators that integrate them into intuitive, easy-tofollow and interpreted control panels [1]. In summary, BI facilitates the analysis process andconsistently supports decisions.QlikView, the Business Intelligence software solution, is one of the most advancedtools a powerful management team uses daily in making business decisions. Using a BIsolution improves control and efficiency in the company, allowing the integration of historicalinformation with available data from all sources. Sometimes, BI solutions can even be used tomake predictions or simulations based on "what-if" scenarios for operational and financialresults.In business environments with increased competitiveness and growing growth, markedby the need for quick access to informed decision-making information, the use of QlikViewprovides the essential asset that ensures business stability and long-term profitability.In the companies where it is deployed, QlikView quickly becomes the manager'spreferred work tool, as it gives them an overview of their business. The platform interface isvery friendly, providing users with an intuitive experience. Thanks to its easy-to-use interfaceand the strongest data-indexing engine, users can explore data immediately. With QlikView,users do not need months or weeks of training to begin interacting with the application. Thetraining sessions last from a few hours to a maximum of 2-3 days, depending on the role ofthe users.1Associate Professor, Ph.D.This is an open-access article distributed under the Creative Commons AttributionNonCommercial 4.0 International License 6
Analysis, Reporting and Forecasting with QlikViewQlikView software is a leader in business intelligence and data discovery solutions. Inthe world, over 38,000 clients rely on Qlik solutions [2] to order information from varioussources, exploring the hidden relationships between data leading to discoveries which giverise to good ideas. Here are some of the main benefits:- The unique associative In-memory technology.- Easily consolidates multiple data sources.- User driver - simple to use, you do not need technical knowledge.- All data, always visible.- Minutes to change.- Insight driven - associations, searches and real-time analyzes.Sales growth, cost reductions, productivity gains, trend identification, inventoryoptimization, cash flow, impact analysis what-if are some of the challenges QlikView issuccessfully responding to.With QlikView, business users can:- Discover hidden trends and make discoveries that lead to innovative decisions.- Ask questions and follow perspectives on their own or in collaboration - on the go.- Search all the data and get the whole picture - just type any word or phrase in anyorder in the QlikView search box to instantly get associative results to allow them to see newconnections and their data.- Take Business Intelligence at your discretion without having to go back to IT orbusiness analysts for new requests or reports.2. THE USE OF QLIKVIEW APPLICATION IN DESIGNING ANALYSISREPORTING AND FORECASTINGThe organizations can rethink their analytics strategy and thereby redefine theirenterprise across three essential criteria:1. UNDERSTAND the business by enabling everyone to:a. Access any and all datab. Ensure self-serve, governed datac. Gain deeper, real-time insights2. SIMPLIFY the enterprise landscape by providing solutions that are:a. Simple to useb. Simple to understandc. Simple to manage3. TRANSFORM the future with line-of-business (LoB) scenarios to:a. Visualize new outcomesb. Predict new opportunitiesc. Plan new strategiesWith QlikView, you can analyze a huge amount of data, with a click away informationabout articles, partners, cash-flow, profit, discounts, fixed assets, stocks, etc. Irrespective ofthe volume of data, they can be represented and analyzed through an unlimited number ofviews [3].For designing analysis reports I will use QlikView Personal Edition, a free version ofQlikView. It is designed for students or small businesses. QlikView Personal Edition is thefull version of QlikView Desktop and uses the same installation package, the only differenceis that QlikView Personal Edition works without a license.To illustrate the use of QlikView, I created a series of reports which contains theevolution of sales on various periods and groups.67
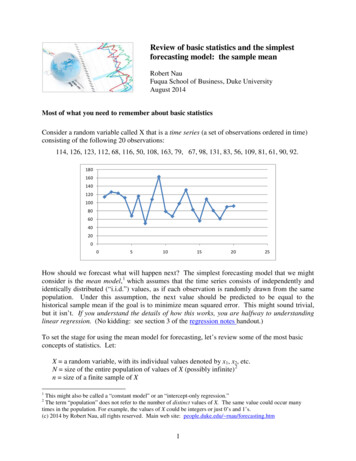
Luminiţa ŞERBĂNESCU1. Analysis. QlikView for business analysis enables organizations to measure, monitorand track key performance indicators. The click-based interactive visual interface providesusers with instant access, facilitating quick and complex management analyzes.Analysis pages are interactive, they help users explore their data and look for answers toquestions. Analysis pages are where you come to spend more time and interact with theapplication on a deeper level to explore the data. Typically each page has a part of thebusiness it is exploring or a specific technical objective (such as a page just for ComparativeAnalysis).Example: Evolutions per periods. In this report we make a detailed analysis of the salesfollowing several dimensions graphically represented on one axis or two. Here we canestablish if there is or not logical correlation between the chosen dimensions, on certainperiods of time, for example between the value and number of clients (we can study whathappens to the value if the number of clients rises, or the other way) (see figure 1).The dimensions of this graph can be changed so that to be displayed the values and thenumber of clients on another period of time (monthly, weekly, daily, annually, etc), for agroup of products or many, for a group of clients or many, etc. At the same time, it can bedisplayed the comparative evolution between other coordinates as for example: quantities soldversus value, number of clients versus number of products, average price versus number ofpoints of delivery, etc.A very important thing for the drawing of all the spreadsheets is the dimensionestablished as representative for them. Thus we used as dimensions: time, location ofwarehouses, customers, products, etc. These can be selected and altered on each sheet and wecan use combinations of these dimensions in order to define groups.Figure 1. Evolutions per periods (Source: developed by the author using QlikView)2. Reporting. QlikView reports connect to most databases (Excel, Access, Oracle,MySQL, SQL Server, SQLite) at the same time [4]. Thus, a QlikView report can retrieveinformation from multiple sources at the same time and display them in an organized andintelligible way for analysts, sales team, controllers, etc. QlikView reports help with decisionmaking, following an overview of company information.Reports can be automatically generated in a predefined or interactive format, givingthe user the flexibility to define their own data selection criteria and to view the data in thedesired format.68
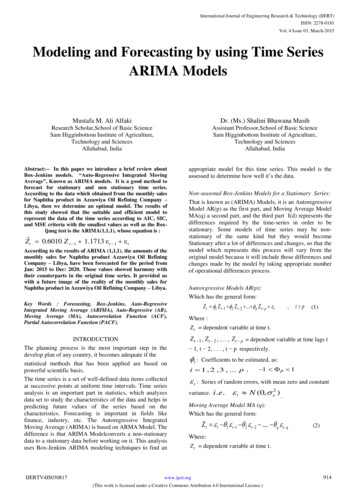
Analysis, Reporting and Forecasting with QlikViewReporting pages give the most granular information with lots of tabular data andshould ultimately lead to action. It’s where a user can spend a lot of time sorting and filteringthrough the details. This is a large part of the cognition phase of perception.With the QlikView application we can:- get reports in a short time (a few minutes);- perform analyzes that can positively affect decisions;- create reports in Microsoft Office, PixelPerfect, as well as HTML reports.- form multi-level reports due to advanced features such as scripts, conditionalformatting, inclusion of content, use of templates, logos and images.- provide users with the ability to receive reports at their request directly from theapplication.Example: Period comparisons will done using the same dimensions, but we establisha certain period for which we want to visualize sales evolution. For example, if we use a 7days period, this does not mean that we built the evolution for that week, but for a 7 daysperiod previous to the analysis date. This thing is very important in business, because wedon’t have to wait till the end of the week to have access to information, but it is considered aweek starting from current date (7 days ago).In the next diagram, we can observe the evolution from seven to seven days of thequantity sold by the company, the obtained value as well as the average price from eachwarehouse. There are made a few comparisons between days and it is established also theaverage on each period.Figure 2. Evolutions per periods (Source: developed by the author using QlikView)3. Forecasting. In the face of unstable market and economic conditions, companies needto use any means necessary to stay ahead of the market. Forecasting is one of them.QlikView software can assist businesses in shaping growth strategies and can increase69
Luminiţa ŞERBĂNESCUthe efficiency and effectiveness of forecasting [5]. Here's how.a. Accuracy. For example, revenue forecasts should answer questions about what yousell, who you sell and when you sell. The precision of your data and forecasts is essential inorder to get the right product in front of the right customer at the right time, as well asoptimize purchases and distribution to increase profitability.By having an accurate snapshot of your historical sales patterns, you are able toaccurately project future revenue, sales and customers to keep you ahead of the market.b. Comprehensiveness. The existence of multiple data storage locations is commonwithin businesses. Typically, businesses use different applications to process different typesof data, and because of this, data is stored in different locations, such as ERPs, CRMs,spreadsheets and more. When the time comes to build reports and forecasts, it is notuncommon for sales managers to lose track of certain information, because they simply don’tremember where some data is stored. Therefore the quality of their reports and forecastssuffers.QlikView software is equipped with the ability to store data from multiple sources inone location. And if, for instance, data is not stored in the program, it can be imported quiteeasily and saved within the database. This will enable sales managers to build comprehensive,high value reports.c. Timeliness. All too often, sales managers spend weeks on end building salesforecasts. The lack of a single data repository causes sales managers to spend days trackingdown information and compiling them, prolonging a process that could have been done withinminutes if supported with the right technology. With QlikView software you can store manydifferent types of data in one location.Aside from this, QlikView is equipped with simple interfaces and configurablefunctionalities to enable users to understand the system and use it efficiently. As a result, datacompilation is expedited, allowing sales managers to draw insights quickly and producetimely forecasts.d. Clarity. The most important aspect of reporting is its clarity and readability. Somesales managers, to save time, present reports the way it was built, without simplifying it fornon-technical readers. Business leaders and board members are then unable to comprehendthe report and the meeting accomplishes little or nothing. A report may be complex, but itsoutput should have the capability to mask this complexity by presenting the data in a simpleand easy to comprehend manner.Example: “What-If ratings”. What-if analysis is a data-intensive simulation whosegoal is to inspect the behaviour of a complex system (i.e., the enterprise business or a part ofit) under some given hypotheses called scenarios. More pragmatically, what-if analysismeasures how changes in a set of independent variables impact on a set of dependentvariables with reference to a simulation model offering a simplified representation of thebusiness, designed to display significant features of the business and tuned according to thehistorical enterprise data [6].What If analysis is basically where you take some numbers you know, add someassumptions to get to numbers that might be correct - if your assumptions are right. A typicalexample would be taking last years figures and projecting what next years might be, based onsome criteria.QlikView can do this elegantly by allowing variables to be changed to capture theassumptions and then using these in calculations. In QlikView, What-If Analysis isimplemented using sliders or input box. In What-if Analysis, users can adjust the value ofvariables and see the effect on the data set in the chart or table.70
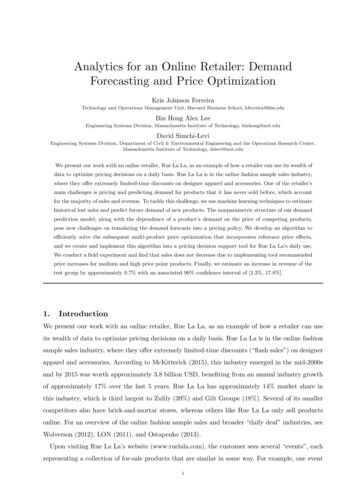
Analysis, Reporting and Forecasting with QlikViewIn figure 3, this report determines how the margin value, the total value, the averageprice and the total amount changes if the price of the product or the quantity changes, or both,simultaneously (decrease or increase).Figure 3. Ratings "What If"(Source: developed by the author using QlikView)3. CONCLUSIONSQlikView software are focused on delivering clear reports using simple visualrepresentations that can present the data in a simple manner. With clear reports, it will beeasier for sales managers to draw out existing trends and project future trends. Subsequently,your forecasts will also be presented clearly, enabling business leaders to quickly comprehendit and take action.Overall, Business Intelligence tools have been proven to increase the accuracy, clarity,and comprehensiveness of data and the timeliness of the forecasting process, to ultimatelydeliver high-quality forecasts.Through QlikView, management has all the information needed to improve thecompany's overall performance. Users have access to consolidated data, both at the holdinglevel and at each company level, with the analysis of the indicators being made up to thesmallest detail in the databases.REFERENCES1.Peter Rausch, Alaa Sheta, Aladdin Ayesh, (2013), Business Intelligence and PerformanceManagement: Theory, Systems, and Industrial Applications, Springer Verlag intelligence/QlikTech International, (2011), QWT Business Intelligence – Enterprise Script andProfessional Layout, https://www.qlik.com/us/4.Oleg Troyansky, Tammy Gibson, Charlie Leichtweis, (2015), QlikView Your Business: AnExpert Guide to Business Discovery with QlikView and Qlik Sense, John Wiley & e-and-financial-forecasting/Kellner, M., Madachy, R., & Raffo, D. (1999), Software process simulation modeling: Why?What? How?, Journal of Systems and Software, 46(2-3), 91-10571
QlikView reports connect to most databases (Excel, Access, Oracle, MySQL, SQL Server, SQLite) at the same time [4]. Thus, a QlikView report can retrieve information from multiple sources at the same time and display them in an organized and intelligible way for analysts, sales team, controllers, e