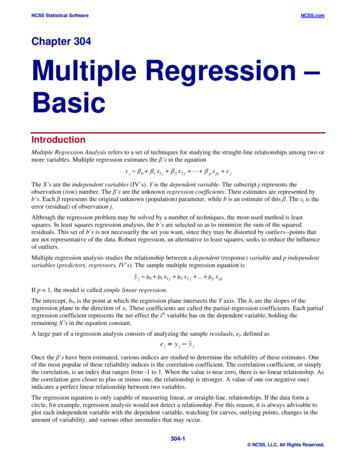
Transcription
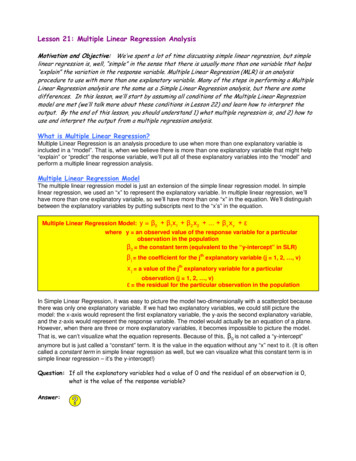
Lesson 21: Multiple Linear Regression AnalysisMotivation and Objective: We’ve spent a lot of time discussing simple linear regression, but simplelinear regression is, well, “simple” in the sense that there is usually more than one variable that helps“explain” the variation in the response variable. Multiple Linear Regression (MLR) is an analysisprocedure to use with more than one explanatory variable. Many of the steps in performing a MultipleLinear Regression analysis are the same as a Simple Linear Regression analysis, but there are somedifferences. In this lesson, we’ll start by assuming all conditions of the Multiple Linear Regressionmodel are met (we’ll talk more about these conditions in Lesson 22) and learn how to interpret theoutput. By the end of this lesson, you should understand 1) what multiple regression is, and 2) how touse and interpret the output from a multiple regression analysis.What is Multiple Linear Regression?Multiple Linear Regression is an analysis procedure to use when more than one explanatory variable isincluded in a “model”. That is, when we believe there is more than one explanatory variable that might help“explain” or “predict” the response variable, we’ll put all of these explanatory variables into the “model” andperform a multiple linear regression analysis.Multiple Linear Regression ModelThe multiple linear regression model is just an extension of the simple linear regression model. In simplelinear regression, we used an “x” to represent the explanatory variable. In multiple linear regression, we’llhave more than one explanatory variable, so we’ll have more than one “x” in the equation. We’ll distinguishbetween the explanatory variables by putting subscripts next to the “x’s” in the equation.Multiple Linear Regression Model: y β0 β1x1 β2 x 2 . βv x v εwhere y an observed value of the response variable for a particularobservation in the populationβ0 the constant term (equivalent to the “y-intercept” in SLR)β j the coefficient for the jth explanatory variable (j 1, 2, , v)x j a value of the jth explanatory variable for a particularobservation (j 1, 2, , v)ε the residual for the particular observation in the populationIn Simple Linear Regression, it was easy to picture the model two-dimensionally with a scatterplot becausethere was only one explanatory variable. If we had two explanatory variables, we could still picture themodel: the x-axis would represent the first explanatory variable, the y-axis the second explanatory variable,and the z-axis would represent the response variable. The model would actually be an equation of a plane.However, when there are three or more explanatory variables, it becomes impossible to picture the model.That is, we can’t visualize what the equation represents. Because of this, β0 is not called a “y-intercept”anymore but is just called a “constant” term. It is the value in the equation without any “x” next to it. (It is oftencalled a constant term in simple linear regression as well, but we can visualize what this constant term is insimple linear regression – it’s the y-intercept!)Question: If all the explanatory variables had a value of 0 and the residual of an observation is 0,what is the value of the response variable?Answer:
Likewise, the numbers in front of the “x’s” are no longer slopes in multiple regression since the equation isnot an equation of a line anymore. We’ll call these numbers coefficients, which means “numbers in front of”.As we will see, the interpretation of the coefficients ( β1, β2 , etc. ) will be very similar to the interpretation ofthe slope in simple linear regression.As with Simple Linear Regression, there are certain conditions that must exist in Multiple Linear Regressionfor conclusions from the analysis to be valid to a particular population of interest. Many of these conditionswill be the same or similar as in Simple Linear Regression. We will talk about these conditions and checks ofthese conditions in Lesson 22. Even though it is important to make sure all of the conditions are met beforedoing an analysis, we’ll concentrate only on the analysis in this lesson under the assumption that allconditions are met. (Note: this is backwards and is the ONLY time we’ll ever do an analysis without checkingthe conditions first, but it might be more interesting for all of us to see what the analysis is all about first.)Performing the Multiple Linear Regression AnalysisThe following ActivStats tutorials discuss how to read the Minitab output from a Multiple Linear RegressionAnalysis. We’ll go through another example in detail explaining and expanding on certain aspects of theoutput. It is recommended to view the tutorials now and again after the completion of the example to follow.: Go to page 26-1 in the Lesson Book:Watch the Nambe Hills Story on Metalware Pieces:Learn to Read the Multiple Regression Table in MINITAB(Note: you will learn HOW to use Minitab to do a MLR analysis in a LabActivity):Learn More About the Multiple Regression Table in MINITAB: Go to page 26-3 in the Lesson Book:Understand How the Values in the Table are InterrelatedExample 21.1: The Literacy Rate ExampleLiteracy rate is a reflection of the educational facilities and quality of education available in a country, andmass communication plays a large part in the educational process. In an effort to relate the literacy rateof a country to various mass communication outlets, a demographer has proposed to relate literacy rateto the following variables: number of daily newspaper copies (per 1000 population), number of radios(per 1000 population), and number of TV sets (per 1000 population). Here are the data for a sample of10 countries:CountryCzech Republic SARussiaVenezuelanewspapersradiostv setsliteracy 790.720.320.990.990.82
Question: What is the response variable? What are the explanatory variables?Answer:Below is the Minitab output from a Multiple Linear Regression analysis.PredictorConstantnewspaper copiesradiostelevision setsS 0.186455SourceRegressionResidual Sq 69.9%DF369SE 81.28P0.0020.5540.3230.247R-Sq(adj) 54.8%Analysis of 64P0.053The multiple linear regression equationThe multiple linear regression equation is just an extension of the simple linear regression equation – ithas an “x” for each explanatory variable and a coefficient for each “x”.Question: Write the least-squares regression equation for this problem. Explain what each termin the regression equation represents in terms of the problem.Answer:Interpretation of the coefficients in the multiple linear regression equationAs mentioned earlier in the lesson, the coefficients in the equation are the numbers in front of the x’s. Forexample, the coefficient for x1 (the number of daily newspapers) is 0.00054. Each “x” has a coefficient.How these numbers are determined is beyond the scope of this course. We’ll trust the output to give usthese values. But, we should understand what these values mean in the context of the problem. Theinterpretation of each coefficient will be very similar to the interpretation of the slope in simple linearregression, with some subtle but important differences.Let’s start with the interpretation of the coefficient for newspaper copies (x1). Like the slope in simplelinear regression, it tells us that we predict the literacy rate to increase by 0.00054 for every additionaldaily newspaper copy in that country (per 1000 people in the population). But, there is more. To properlyinterpret the coefficient of daily newspaper copies, the other two variables can’t be changing – only thenumber of daily newspaper copies increases by 1. So, a way to interpret the coefficient of number ofdaily newspaper copies is as follows:For every additional daily newspaper copy per 1000 people in a population, literacy rate ispredicted to increase by 0.00054, keeping the number of radios and TV sets the same.Although the above interpretation is technically correct, a better interpretation is as follows:For countries with the same number of radios and same number of TV sets per 1000 people inthe population, literacy rate is predicted to be 0.00054 higher for every additional dailynewspaper copy per 1000 people in the population.The idea with the second interpretation is that the number of radios and TV sets has to stay the same.So, if we had two countries that had the same number of radios and TV sets per 1000 people in thepopulation but one of the countries had one more daily newspaper copy than the other country (per 1000
people in the population), we’d predict the literacy rate for that country with one additional newspapercopy to be 0.00054 more than the other country.Let’s try interpreting the coefficient of radios.Question: Here is an interpretation of the coefficient of radios: For countries with the samenumber of daily newspaper copies and same number of TV sets (per 1000 people in thepopulation), literacy rate is predicted to be .00035 higher for every additional radioper 1000 people in the population. Which of the following is true regarding thisinterpretation?A) This is a correct interpretation of the coefficient of radios.B) This is not a correct interpretation of the coefficient of radios. “higher” should bereplaced with “lower”.C) This is not a correct interpretation of the coefficient of radios. You do not need tocompare only countries with the same number of daily newspaper copies and TVsets.D) This is not a correct interpretation of the coefficient of radios. You do not needthe word “predicted” in the interpretation.E) B, C, and D above.Answer:We’ll leave the interpretation of the coefficient of TV sets for you to do on your own. There are a coupleof ActivStats tutorials that summarize and illustrate what we’ve been discussing:: Go to page 26-2 in the Lesson Book:Learn How Regression Coefficients Change with New PredictorVariables:Understanding Removing the Linear Effects of a VariableConfidence intervals for the coefficients in the multiple linear regression equationAs in simple linear regression, the coefficients in the regression equation are based on a sample ofcountries. Had we collected data on all countries, the coefficients may have been different. The hope isthat the sample of countries is representative of all countries so that the coefficients in the equation areclose to what they would be had we had data on all countries. If we wanted to estimate what the truecoefficients are had we collected data on all countries, we could construct confidence intervals for eachcoefficient in the same fashion as was done in simple linear regression. Each confidence interval wouldgive us a range of possible values (with a certain level of confidence) for the coefficient.Let’s see how it’s done – we’ll see how similar this is to simple linear regression. Let’s construct a 95%confidence interval for β3 , the coefficient for TV sets.As usual, a confidence interval is of the form of best estimate margin of errorThe “best estimate” is the coefficient from the sample data (b3). The “margin of error” (t*)(SE(b3)). Ingeneral:Formula for confidence interval for a coefficient ( βi ):*bi (t n-v-1)(SE(bi ))
Note 1: the degrees of freedom for the t* critical value is the DFE in the Analysis of Variance table.(Recall, DFE n – v – 1 where v the number of explanatory variables)Note 2: the subscript “i” in the formula are for the specific explanatory variable. So, if we’re findingthe confidence interval for TV sets, we’ll use the coefficient for TV sets (b3) and the standard error forTV sets (SE(b3)).As usual again, we need three pieces of information to construct the bounds of the confidence interval,two of which can be found in the output: b3 and SE(b3) – both are highlighted in red in the output below:PredictorConstantnewspaper copiesradiostelevision setsCoef0.514860.0005421-0.00035350.001988SE 81.28P0.0020.5540.3230.247The other piece of information is the t* critical value for a 95% confidence interval. To find this value, weneed the degrees of freedom.Question: What are the degrees of freedom for the t* value in this problem?Answer:Question: Determine the lower and upper bounds for the 95% confidence interval for β3 .Answer:Question: Which of the following is the best interpretation of the 95% confidence interval forβ3 ?A] We’re 95% sure that literacy rate will either go down by .0018 or go up by .00578.B] We’re 95% sure that a country’s literacy rate will change by -0.0018 to 0.00578.C] For countries with the same number of daily newspapers and same number of radios(per 1000 people in the population), we’re 95% sure that a country’s literacy ratewill change by -0.0018 to 0.00578.D] For countries with the same number of daily newspapers and same number of radios(per 1000 people in the population), we’re 95% sure that the literacy rate will bebetween 0.0018 lower to 0.00578 higher for a country with 1 more TV set per 1000people in the population.E] We’re 95% sure that the literacy rate will be between 0.0018 lower to 0.00578higher for a country with 1 more TV set per 1000 people in the population.Answer:The confidence intervals for the other two coefficients will be left for you to do. Remember to use theproper point estimate and standard error. For example, to find the bounds for a confidence interval forβ2 , use b2 -0.00035 and SE(b2) 0.00033.Using the multiple linear regression equation for prediction
One of the uses of a regression analysis is for prediction. Predicting using a multiple linear regressionequation is just an extension of predicting with a simple linear regression equation. We just have to makesure to put the right values in for the right x’s.Question: Predict literacy rate for a country that has 200 daily newspaper copies (per 1000 inthe population), 800 radios (per 1000 in the population), and 250 TV sets (per 1000 inthe population).Answer:Determining a final model – how to choose “significant” predictors of the response variableAnother reason for performing a multiple linear regression analysis is to determine which (if any) of theexplanatory variables are significant predictors of the response variable. Typically, researchers mayinclude explanatory variables they think are useful predictors of the response variable (i.e. help to“explain” the response variable). But, are they? For example, in Example 21.1, researchers includedthree variables associated with mass communication as possible predictors of literacy rate. But, are allneeded? That is, does each explanatory variable help explain some of the variation in the responsevariable after accounting for the effects of the other explanatory variables in the model? A two-stepprocess will be used to answer this question.Step 1: perform an F-testThe first step is to determine if any of the explanatory variables are significant predictors of theresponse variable. If none are, there is no need to continue the analysis. However, if at least one is,then we can continue with the analysis.To determine if any of the explanatory variables are significant predictors of the response variable,an F-test is performed. The F-test in multiple regression tests a different hypothesis than in simplelinear regression.Hypotheses for the F-test in multiple linear regression.Null hypothesis;H0: all the coefficients 0orH0: β1 β2 . β v 0This implies that none of the explanatory variables are significant predictors of theresponse variable.Alternative hypothesis:HA: at least one coefficient is not 0orHA: at least one βi 0This implies that at least one of the explanatory variables is a significant predictor ofthe response variable.It is important to note that the alternative hypothesis is that at least one of the explanatory variablesis a significant predictor of the response variable. So, if there is evidence to reject the null hypothesisfrom the F-test, it does NOT say that all of the explanatory variables are significant predictors. It justsays that there is at least one that is – it won’t tell us how many or which one(s), just that there is atleast one that is a significant predictor of the response variable. To determine which one or ones, ttests on each explanatory variable need to be performed. More on that later. Let’s continue with theF-test.Recall from Lesson 20, the F-statistic MSM / MSE. The numerator degrees of freedom for the Fstatistic DFM (which equals v, the number of explanatory variables), while the denominatordegrees of freedom DFE (n – v – 1). The F-statistic for the F-test testing the null hypothesis givenin the yellow box above is given in the multiple linear regression output and is highlighted in redbelow for the Literacy Rate example:
SourceRegressionResidual ErrorTotalDF369Analysis of 64P0.053Question: Verify that the F-statistic in the output above equals MSM / MSE.Answer:Question: What are the degrees of freedom for this F-statistic?Answer:The p-value for the F-test testing the null hypothesis in the yellow box above is also given in theoutput – it is highlighted in red in the output below:AnalysisSourceDFRegression3Residual Error6Total9of 64P0.053There are several other resources that can be used to determine the p-value for this F-test:1) The F-distribution calculator – click on the link to get to this applet. See Lesson 20 on howto use the applet.2) An ActivStats tutorial contains instructions on how to use their F-table to determine the pvalue:: Go to page 26-3 in the Lesson Book:Apply the F-table to RegressionNote: the important part of this tutorial is towards the end where the narrator explains how toscroll through the table to get to the observed F-statistic for a given numerator anddenominator degrees of freedom.3) F-tables, which can be found in Lesson 20 on MyStatLab. See Lesson 20 on how to use theF-tables to approximate the p-value.Since the p-value is given in the Minitab output, we’ll use that to answer the question of interest. But,be able to use any one of the other methods listed above to find the p-value just in case it is notgiven in the Analysis of Variance table.Question: State a conclusion in the context of the problem.Answer:As mentioned in the answer above (but is worth repeating once more), if the p-value from the F-testis less than 0.10, we should continue the analysis. But, if the p-value is greater than 0.10, then thereis no evidence to indicate that any of the explanatory variables are significant predictors of theresponse variable and, therefore, there would be no need to continue to the next step. In the LiteracyRate example, we had suggestive (but weak) evidence that there could be at least one explanatoryvariable that is a significant predictor of the response variable. Therefore, we need to move to step 2.Step 2: perform a t-test on each explanatory variable
One last time: only do this step if there was even the slightest evidence to reject the null hypothesisfrom the F-test. Rejecting the null hypothesis from the F-test is an indication that at least one of theexplanatory variables helps to explain the response variable. To determine which one or ones aresignificant predictors, t-tests on each explanatory variable will be performed.Hypotheses for the t-tests in multiple linear regression:Null hypothesisH0: coefficient for a particular explanatory variable is 0ORH0: βi 0 , where i 1, 2, , vThis implies that the particular explanatory variable being tested does NOT help toexplain the response variable after accounting for the effects of the otherexplanatory variables in the model.Alternative hypothesisHA: coefficient for a particular explanatory variable is NOT 0ORH0: βi 0 , where i 1, 2, , vThis implies that the particular explanatory variable being tested does help toexplain the response variable after accounting for the effects of the otherexplanatory variables in the model.One comment about the hypotheses before continuing: notice how the hypotheses are written inwords – both include a part that is underlined stating, “after accounting for the effects of the otherexplanatory variables in the model.” In multiple regression, the coefficients and standard errors of thecoefficients for each of the variables are determined based on the other explanatory variables beingin the model. For example, the coefficient and standard error of the coefficient for newspaper copiesis 0.00054 and 0.000865, respectively (see output). But, these values were determined based onhaving both radios and TV sets in the model. If one or both of those other explanatory variables wasnot in the model, the coefficient and standard error of the coefficient for newspaper copies maychange. If the coefficient and standard error of the coefficient changes, then the t-statistic and pvalue would also change, which could lead to a different conclusion about newspaper copies!!Therefore, when writing the hypotheses in words (and the conclusion) for the t-tests, it is critical tomake sure we include the part, “after accounting for the effects of the other explanatory variables inthe model.”Let’s start with the first explanatory variable: newspaper copies.H0: β1 0HA: β1which implies the number of daily newspaper copies in a country does not helpto explain that country’s literacy rate after accounting for the effects of thenumber of radios and the number of TV sets in the country. 0 which implies the number of daily newspaper copies in a country does help toexplain that country’s literacy rate after accounting for the effects of the numberof radios and the number of TV sets in the country.As in simple linear regression, t-statistic DFE Question:bi - 0.SE(bi )Calculate the t-statistic (with degrees of freedom) for newspaper copies.For your convenience, the output is given below:
PredictorConstantnewspaper copiesradiostelevision setsCoef0.514860.0005421-0.00035350.001988SE 81.28P0.0020.5540.3230.247Answer:The two-sided p-value for the t-tests testing the null hypothesis given in the yellow box aboveare given in the column titled “P” in the Minitab output. For example, the p-value for dailynewspaper copies is 0.554. This p-value can also be found using the t-distribution calculator(remember to multiply the given p-value by two to get the two-sided p-value), or the t-table onpage A-62 in the text. If the p-value is given in the output, use that. But, be ready to determinethe p-value using the t-distribution calculator or the t-table if the p-value is not given in theoutput.Question:Based on the p-value, which of the following is a correct conclusion aboutdaily newspaper copies?A] There is not enough evidence to indicate that the number of dailynewspaper copies in a country is a significant predictor of that country’sliteracy rate.B] There is not enough evidence to indicate that the number of dailynewspaper copies in a country is a significant predictor of that country’sliteracy rate, keeping the number of radios and TV sets the same.C] There is not enough evidence to indicate that the number of dailynewspaper copies in a country is a significant predictor of that country’sliteracy rate, after accounting for the effects of the number of radiosand number of TV sets in the country.D] There is some evidence to indicate that the number of daily newspapercopies in a country is a significant predictor of that country’s literacyrate, after accounting for the effects of the number of radios andnumber of TV sets in the country.E] There is strong evidence to indicate that the number of daily newspapercopies in a country is a significant predictor of that country’s literacyrate, keeping the number of radios and TV sets the same.Answer:It will be left as an exercise for you to do the t-tests for the other two variables. But, in looking at theoutput below, the t-statistic for radios is -1.08 with a two-sided p-value of 0.323 and the t-statistic forTV sets is 1.28 with a two-sided p-value of 0.247. (All t-statistics have 6 degrees of freedom.)PredictorConstantnewspaper copiesradiostelevision setsCoef0.514860.0005421-0.00035350.001988SE 81.28P0.0020.5540.3230.247Based on these p-values, it doesn’t appear that any of the explanatory variables are significantpredictors of literacy rate! So, even though the p-value from the F-test indicated suggestive (butweak) evidence that there was at least one explanatory variable that was a significant predictor ofliteracy rate, the t-tests indicated that none of them were! But (and here’s the important part), that’safter accounting for the effects of the other explanatory variables!! If one of the explanatory variables
was not in the model, we might have different conclusions about the other two variables! But, how dowe know without removing one of the variables? And, if we’re going to remove a variable, which onedo we remove? That’s all part of the next topic in determining a final model.Step 3: Backwards selection processAn objective in multiple regression is to determine the predictors (i.e. explanatory variables) thataccurately describe what happens with the response variable. That statement is pretty vague, and ismeant to be. The idea is to determine a “best-fitting” model. But, what’s “best-fitting” may depend onthe problem. One part of determining a “best-fitting” model (but not necessarily the only part) is todetermine which variables are significant predictors of the response variable. Researchers mayinclude a number of explanatory variables in a model because they think all of them are significantpredictors. But, they may not be. There are a number of “selection” methods (called stepwisemethods) that are used to include only significant predictors in a final model. The one that we’llconcentrate on here is called the backwards selection process.In a backwards selection process, all explanatory variables are included in the initial model. Then the“least significant” explanatory variable is removed from the model and the model is re-fit with theremaining explanatory variables. Again, the least-significant explanatory variable is removed and themodel is re-fit with the remaining explanatory variables. This process of removing one explanatoryvariable at a time is continued until all remaining explanatory variables are “significant” predictors ofthe response variable.What does “least significant” and “significant” mean? That is somewhat subjective, but the guidelineswe’ll use here is that the least significant explanatory variable is the one with the highest p-valuefrom the t-test. A variable is “significant” if its p-value from the t-test is less than 0.05 (or so). Puttingit altogether, the backwards selection process will remove the explanatory variable with the highestp-value from the t-test as long as its p-value is greater than 0.05 (or so). Then we’ll refit the modelwith the remaining explanatory variables. (Remember, when one explanatory variable is removed,the coefficients and standard error of the coefficients may change, which will change the t-statisticand the p-value.) We’ll continue to remove the least significant explanatory variable (one at a time)until all remaining explanatory variables have p-values less than 0.05 (or so). Note: the “or so” isincluded because 0.05 is an arbitrary set cut-off point. We may decide to keep an explanatoryvariable with a p-value of 0.06, for example.Let’s see how this works in practice with the Literacy Rate example. Here is the relevant output:PredictorConstantnewspaper copiesradiostelevision setsCoef0.514860.0005421-0.00035350.001988SE 81.28P0.0020.5540.3230.247Question: Which of the following is true regarding what to do first using the backwardsselection process?A) Remove newspaper copies since it has the t-statistic closest to 0.B) Remove radios since it has a negative coefficient.C) Remove newspaper copies since it has the highest p-value from the t-test.D) Remove TV sets since it has the lowest p-value from the t-test.E) Remove all of them since none of them are significant predictors of literacyrate.Answer:Question: True or false? Suppose all p-values from the t-test are much less than 0.05. Wewould still remove the explanatory variable with the highest p-value.Answer:
After removing a variable, run the analysis again with the remaining variables and do the t-tests onthe explanatory variables. Here is the relevant output after removing newspaper copies from theanalysis. Note how the coefficients, standard error of the coefficients, t-statistics, and p-values havechanged.PredictorConstantradiostelevision setsCoef0.53008-0.00047360.0027812SE .1050.014Question: What are the degrees of freedom for the t-tests in the above output?Answer:Question: Which variable would get removed in the backwards selection process?A] radios since its p-value is the highest and it’s greater than 0.05.B] TV sets since its p-value is less than 0.05.C] Both variables since at least one has a p-value greater than 0.05.D] neither since at least one p-value is less than 0.05.Answer:So, we’ll remove radios from the model since it has the highest p-value AND its p-value is greaterthan 0.05. We’ll refit the model with only TV sets and run the analysis. Below is the output:PredictorConstanttelevision setsS Coef0.567900.0013886SE Coef0.096060.0004710T5.912.95P0.0000.018R-Sq Analysis of VarianceSourceRegressionResidual ErrorTotalDF
Lesson 21: Multiple Linear Regression Analysis . Motivation and Objective: We've spent a lot of time discussing simple linear regression, but simple linear regression is, well, "simple" in the sense that there is usually more than one variable that helps "explain" the variation in the response variable.
