Transcription
09-11-2018Indian Statistical InstituteFoundation CourseonPredictive ModelingusingPython1Indian Statistical InstituteCONTENTSSL No.TopicsSL No. Topics1Introduction to Predictive Modeling9Linear Regression2Introduction to Python10Dummy Variable Regression3Descriptive Statistics11Binary Logistic Regression4Test of Hypothesis12Classification & Regression Tree5Normality Test13Random Forest6Analysis of Variance14Naive Bayes7Cross Tabulation & Chi Square Test15k Nearest Neighbors8Correlation16Support vector Machine21
09-11-2018Indian Statistical InstituteIntroductiontoPredictive Modeling3Indian Statistical InstitutePREDICTIVE MODELINGIntroductionA set of methods to arrive at quantitative solutions to problems of businessinterestPart of data science or statistical learningHas assumed tremendous importance in the recent past as the data availability isconstantly on the riseThere is widespread belief that the existing data may be fruitfully analyzedarrive at hitherto unknown insightsto42
09-11-2018Indian Statistical InstitutePREDICTIVE MODELINGExamples1. An automobile manufacturer wants to understand how the fault and failurerelated data captured through the sensors may be used to classify thecondition of vehicles so that preventive maintenance may be carried outoptimally2. An insurance company may wish to classify drivers as very risky, risky, safeetc. on the basis of their driving habits so that insurance premium may befixed intelligently.3. A company engaged in oil exploration may need to estimate the time andexpenses of drilling under different geological conditions before taking up adrilling assignment.5. Credit card as well as health insurance companies may wish to identifyfraudulent transactions so that appropriate actions may be initiated6. An email service provider may wish to develop a method to classify spam mailfrom usual mail on the basis of the content of the mail5Indian Statistical InstitutePREDICTIVE MODELINGPredictive Modeling ProcessProblem statementProblemformulationData preparation &understandingModel building &validationDeployment63
09-11-2018Indian Statistical InstitutePREDICTIVE MODELINGSupervised learningUnderstanding the behavior of a target (response / dependent / y) variable asa set of input or process varaibles (independent / explanatory / x) changeTypically attempts are made to develop a function or model to estimate thetargetOften called dependency analyses7Indian Statistical InstitutePREDICTIVE MODELINGSupervised learning: Examples1. Predict whether a patient, hospitalized due to a heart attack, will have asecond heart attack. The prediction is to be based on demographic, diet andclinical measurements for that patient2. Predict the price of a stock in 6 months from now, on the basis of companyperformance measures and economic data3. Predict whether a particular credit card transaction is fraudulent. Theprediction is to be based on past transaction history, transaction type,reputation of the merchants involved and other similar variables4. Identify the impact of different variables like price, relative brand position,general economic condition, level of competition, and product type (luxury /necessity, etc) on the demand of a particular product during a given period84
09-11-2018Indian Statistical InstitutePREDICTIVE MODELINGUnsupervised learning: Examples1. Identification of typical profile of employees who quit quickly2. Identification of products that are usually sold together3. Grouping of cities or geographies with respect to their characteristics4. Develop a scale to measure brand position9Indian Statistical InstitutePREDICTIVE MODELINGPredictive modeling tasks1.Hypotheses testing2.Classification and class probability estimation3.Value estimation, explanatory and causal models105
09-11-2018Indian Statistical InstitutePREDICTIVE MODELINGHypothesis testingHypotheses are statements about a given phenomenonHypothesis testing consists of determining the plausibility of the statementson the basis of dataExamples1.Increasing number of years of education increases earning potential2.Design A produces a lower defect rate compared to design B3.A particular design of a web page leads to more conversion compared toanother11Indian Statistical InstitutePREDICTIVE MODELINGClassification & class probability estimationUsed in situations where the target is to be classifiedThe problem is to allocate the target variable to one of the classes based onthe value of some explanatory variable(s)In most cases the probability that the target will belong to different classes isfirst estimatedAllocation to a particular class is made on the basis of the estimatedprobabilitiesExamples1.Classification of credit card transaction as fraudulent or not2.Classification of whether a customer will renew her contract or not3.Classification of whether a sales bid will be won, lost or abandoned bythe customer4.Classification of a loan application as low, high or medium risk126
09-11-2018Indian Statistical InstitutePREDICTIVE MODELINGValue estimationUsed to estimate or predict the value of a target variable rather thanclassifying the sameThe value needs to be estimated based on certain explanatory variablesExamples1.Finding the lifetime value of a customer2.Estimating the effort required to complete a software developmentproject3.Finding the total number of cheques that may arrive for processing13Indian Statistical InstitutePREDICTIVE MODELINGFundamental tasks and techniques: RelationshipSL NoFundamental taskStatistical / data mining technique1Phenomenon ng, graphical analysis and datavisualization, contingency ntanalysis, Decision trees, Neuralnetworks, Support vector machine,Naive Bayes classification, etc3Value EstimationTable lookup, k nearest neighbor,Regression models – Multiple linearregression and its variants includingshrinkage methods, Survival Analysis,Neuralnetworks,non-parametricmethods, etc147
09-11-2018Indian Statistical InstituteDESCRIPTIVESTATISTICS15Indian Statistical InstituteDESCRIPTIVE STATISTICSImportance of MeasurementWe don’t know what we don’t knowIf we can’t express what we know in the form of numbers, we really don’t knowmuch about itIf we don’t know much about it, we can’t control itIf we can’t control it, we are at the mercy of chanceSuccessful organizations have a common language to communicateCommon language promotes objectivity in decision-making processDoes the problem really exist? Measurement will answer that questionImprovement can happen only if we understand where we are and where weshould goHave we reached where we intended to? -- only data answers that questionA good data collection simplifies the problem solving effort168
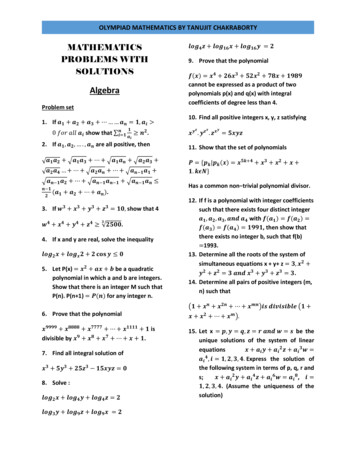
09-11-2018Indian Statistical InstituteDESCRIPTIVE STATISTICSVariable TypesVariableQualitativeAttribute[Count or %](type of car owned)QuantitativeContinuous[numeric ](Height of a person)Discrete[Count](number of children)Qualitative variable examples : Programming Style, Gender, religiousaffiliation, type of automobile owned, eye colorQuantitative variable examples : Size of a Program, Balance in bankaccount, minutes remaining in class, number of children in a family.17Indian Statistical InstituteDESCRIPTIVE STATISTICSTypes of DataQuantitative characteristics are of two principal types – Discrete and continuous.Discrete: A characteristic may take only some isolated or discrete values, e.g.,the number of defects on an item, the number of breakdown of machines in ashop, etc. This is often obtained by counting.Continuous: A characteristic may theoretically take any value within a definiterange, e.g., the body weight, length of a pencil, service response time,temperature in a room, etc. This is recorded with the help of a measuringequipment of defined accuracy.Qualitative characteristic is typically represented byAttribute Data: A characteristic that is judged “Good” or “Bad” by comparing it toa referenced standardExample: Defective / Non Defective, Delivered on time / Not on time189
09-11-2018Indian Statistical InstituteDESCRIPTIVE STATISTICSTypes of DataDiscrete dataData that can take a limited number of values. For example: Days in a week Number of defectsAttribute DataData that can be classified in binary form. For example: Items passed / rejected Responses to a customer satisfaction survey in 2 categories”Satisfied” and “Not Satisfied”Continuous DataData that can take any value within a specified range. For example: Temperature in this room Exchange rate of a currency Yield of a process Height of a person19Indian Statistical InstituteDESCRIPTIVE STATISTICSQuiz1. Give 3 examples of each type of data–Quantitative Continuous–Qualitative Attribute–Quantitative Discrete2.What guidelines help you distinguish between Quantitative Continuousand Quantitative Discrete data?3.What guidelines help you distinguish between Qualitative Attribute andQuantitative Discrete data?2010
09-11-2018Indian Statistical InstituteDESCRIPTIVE STATISTICSAnswers1.Quantitative ContinuousQualitative AttributeQuantitative DiscreteCycle timeLate deliveriesNo. of ComplaintsCostAccurate PONo. of ErrorsEffortDefective programsNo. of Bugs2.–Continuous data are measurable, usually on a continuous scale, such astime, amount (money), volume, length, or temperature–Discrete data are countable, on an integer scale, such as items with acharacteristic (attribute) or number of occurrences21Indian Statistical InstituteDESCRIPTIVE STATISTICSAnswers3.Qualitative AttributeQuantitative DiscreteYou are interested in counting items with You are interested in countingan attribute (Ex: projects delivered late) occurrencesforagivenopportunity (Ex: complaints perweek)You can also count items without the You cannot count a “nonattribute (Ex: orders delivered “not-late” occurrence” (Ex: impossible to on time)count “non -complaints”)You can determine the proportion of There are no physical limits to theitems with the attribute (Ex: % late number of occurrences (no limit todeliveries)thenumberofcomplaintspossible; this is often referred toas “countable infinity”)2211
09-11-2018Indian Statistical InstituteDESCRIPTIVE STATISTICSRole of Statistics“There are three kind of lies: Lies, Damn Lies and Statistics .” Benjamin Disraeli“Figures don’t lie: liars figure ”AnonymousWhat is Statistics?Statistics is the science concerned with collection, organizing, presenting andanalyzing data so that intelligent and more effective judgment may be formedupon them.“Statistics may be regarded as the technique of drawing valid conclusions from alimited body of experimental or observational data.”“Statistics is the name for the body of scientific methods (statistical methods)which are meant for the collection, analysis and interpretation of numerical data.”23Indian Statistical InstituteDESCRIPTIVE STATISTICSPopulation and SamplePopulation: An aggregate of living or non-living things whose characteristic(s) isunder study.Sample: A sample is part of the population. A sample is used as a basis formaking estimates and inferences about the population. By size of the sample,we mean the number of elements or groups of elements of the population thatconstitute the sample.2412
09-11-2018Indian Statistical InstituteDESCRIPTIVE STATISTICSPopulation and Sample Theentire set of items is called the Population. Thesmall number of items taken from the population to make a judgment of thepopulation is called a Sample. Thenumbers of samples taken to make this judgment is called Sample size.SamplePopulation25Indian Statistical InstituteDESCRIPTIVE STATISTICSPopulation and SampleNO ACTIONRandom SamplingSamplePOPULATIONMeasurement /ObservationDataACTION2613
09-11-2018Indian Statistical InstituteDESCRIPTIVE STATISTICSAdvantages of sampling over complete enumeration– Reduced cost– Greater speed– Greater scope– Desired accuracy27Indian Statistical InstituteDESCRIPTIVE STATISTICSFrequency distributionFrequency distribution is a form of data summarization. It is obtained by firstdividing the range of (sample) values into a number of class-intervals, and thenclassifying the values into these intervals. A frequency distribution thusconsists of a set of class-intervals and the frequency of values in each of them.It helps comprehension of both location and dispersion of data.2814
09-11-2018Indian Statistical InstituteDESCRIPTIVE STATISTICSExample: Response Time (in minutes) to 100 customer 00.4 116.182.971.394.6117.8 104.3 2.2101.2 116.180.2105.290.6130.1 2101.5 101.6143.996.384.9109.394.579115.993.1110.3 121.763.987.2107.2 132.7 126.2 131.4 125.2109104.3 106.979.389.888.9103.7 80.999.7127.5 121.591.874.690.1110.582.8100.2 114.492.9110.297.5100.329Indian Statistical InstituteDESCRIPTIVE STATISTICSThe steps involved in the construction of a frequency table are:1. Collect around 100 observations(measurements) to form a frequencydistribution. Each observation should be recorded to the same degree ofR X Max X Minaccuracy.2.Obtain the range of measurements as3. Decide on appropriate number of class intervals (k) based on theguidelines provided below :3015
09-11-2018Indian Statistical InstituteDESCRIPTIVE STATISTICSThese guidelines are not rigid and can be modified as and when foundnecessary. Generally, the number of classes should not be too large;otherwise the purpose of classification, viz, summarization of data will notbe served. Moreover, by taking a large number of classes, one willintroduce an irregular pattern in the frequencies which may be completelyabsent in the actual distribution.The number of classes should not be too small either, for this also mayobscure the true nature of the distribution, i.e, some useful information maybe lost due to too much condensation. Further, if the number of classes istoo small, each observation within any class is equal to the midpoint of thatclass will make the computed value of measures of central tendency anddispersion very unreliable.Lastly, the classes should preferably be of equal width. Otherwise, theclass frequencies will not be directly comparable and the computations ofstatistical measures will be laborious.31Indian Statistical InstituteDESCRIPTIVE STATISTICS4. Calculate the approximate length of class interval as equal toC R W;W be the smallest unit of measurement.K5.Specify the class boundaries. The lower limit (boundary) of the firstclass is given by X min 0.5 W . The subsequent ones are obtained byadding the class width C.6.Read the observations in order, and for each observation, put a tallymark against the particular class containing the observation.7.Count the total number of tally marks in each class. This is called thefrequency of that class.3216
09-11-2018Indian Statistical InstituteDESCRIPTIVE STATISTICSResponse Time (in minutes) to 100 customer .576.333Indian Statistical InstituteDESCRIPTIVE STATISTICSFrequency Distribution of Response TimeClass63.85 – 72.1772.17 – 80.4980.49 – 88.8188.81 – 97.1397.13 – 105.45105.45 – 113.77113.77 – 122.09122.09 – 130.41130.41 – 138.73138.73 – 147.05Midpoint of class 3109.6119117.938126.254134.572142.893n fi 100% CumulativeFrequency (Fi)311244164839195971003417
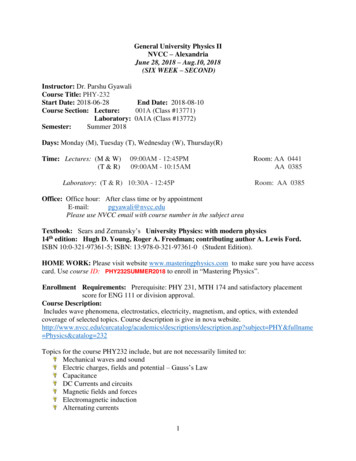
09-11-2018Indian Statistical InstituteDESCRIPTIVE STATISTICSHistogram of Response e Time35Indian Statistical InstituteDESCRIPTIVE STATISTICSSpecimen of HistogramFigure shows 12 typical histogram.1.2.Does the process have the ability to meet the specification limits?What action, if any, is appropriate on the process?These questions can be answered by analyzing.1.2.3.The centering of the histogram. This defines the aim of the process.The width of the histogram. This defines the variability about the aim.The shape of the histogram. When a normal or bell-shaped curve isexpected, then any significant deviation or other aberration is usuallycaused by a manufacturing (or other) condition that may be the root ofthe quality problem. For example, histogram with two or more peaks mayreveal that several “populations” have been mixed together.Histogram illustrate how variables data provide much more information thando attributes data.3618
09-11-2018Indian Statistical InstituteDESCRIPTIVE STATISTICS37Indian Statistical InstituteDESCRIPTIVE STATISTICSFor example, Figure b,d,g, and i warn of potential trouble even though all unitsin the sample are within specification limits. With attributes measurement, allthe units would simply be classified as acceptable and the inspection reportwould have stated “50 inspected, 0 defective” – therefore no problem. Onecustomer had a dramatic experience based on a lot which yielded a samplehistogram similar to figure "i". Although the sample indicated that the lot metquality requirements, the customer realized that the vendor must have mademuch scrap and screened it out before delivery. A rough calculation indicatedthat full production must have been about 25 percent defective. The histogramenabled the customer to deduce this without ever having been inside thevendor’s plant. Note how the “ product tells on the process”. As the customerwould eventually pay for this scrap (in the selling price), he wanted the situationcorrected. The vendor was contacted and advice was offered in a constructivemanner.As a general rule, at least 50 measurements are needed for the histogram toreveal the basic pattern of variation. Histogram based on too fewmeasurements can lead to incorrect conclusions, because the shape of the38histogram may be incomplete without the observer realizing it.19
09-11-2018Indian Statistical InstituteDESCRIPTIVE STATISTICSHistogram have limitations. Since the samples are taken at random rather thanin the order of manufacture, the time to time process trends duringmanufacture are not disclosed. Hence the seeming central tendency of ahistogram may be illusory – the process may have drifted substantially. In likemanner, the histogram does not disclose whether the vendor’s process wasoperating at its best, i.e., whether it was in a state of statistical control.In spite of these shortcomings, the histogram is an effective analytical tool. Thekey to its usefulness is its simplicity. It speaks a language that everyoneunderstands – comparison of product measurements against specificationlimits. To draw useful conclusions from this comparison requires littleexperience in interpreting frequency distribution, and no formal training instatistics. The experience soon expands, to include applications indevelopment, manufacturing, vendor relations, and field data.39Indian Statistical InstituteDESCRIPTIVE STATISTICSExercise 1: The data shown below are chemical process yield on successivedays. Construct a histogram for these 7.790.188.387.395.390.390.694.384.14020
09-11-2018Indian Statistical InstituteDESCRIPTIVE STATISTICSExercise 2: The time to failure in hours of an electronic componentsubjected to an accelerated life test is given below. Construct histogram ofthese 216014213012912512312212641Indian Statistical InstituteDESCRIPTIVE STATISTICSMeasuring the ShapeIf data pattern is Symmetric– It’s a data set in which spread of the data set around its mean is identical– For such a data set -mean mode medianIf data pattern is Asymmetric–Positive / Right skewedhigh spread on the right side of the meanModeMeanMedianNegative / Left skewed- high spread on the left side of the meanMeanModeMedian21
09-11-2018Indian Statistical InstituteDESCRIPTIVE STATISTICSContinuous Data CharacteristicsLocation / Central Tendency– Measure of the center point of any data setSpread / Dispersion– Measure of the spread of any data set around its centerShape– Measure of symmetry of any data set around its center43Indian Statistical InstituteDESCRIPTIVE STATISTICSMeasures of location– Mean– Median– Mode– Quartiles4422
09-11-2018Indian Statistical InstituteDESCRIPTIVE STATISTICSMean– Mean is the arithmetic average of all data points in a data setX X1 X2 X3 . XnnWhere n number of data pointsMode– Mode is the most frequently occurring data point in a data setMedian– Median is the middle data point of a data set arranged in an ascending /descending orderOdd number of data pointsEven number of data pointsAverage45Indian Statistical InstituteDESCRIPTIVE STATISTICSSpread MeasuresRange– Range is the difference between the maximum & minimum data valueVariance / Standard Deviation– Variance and Standard Deviation tell us how individual data points are spreadaround meanVariance s2 ( X1 - X )2 ( X2 – X )2 . ( Xn – X )2Standard Deviation (n–1)s s24623
09-11-2018Indian Statistical InstituteDESCRIPTIVE STATISTICSImportance of SpreadBACMean of Curve ‘A’ is more representative of its data set as compared to Curves ‘B’ &‘C’If this graph represents say, delivery time of an item to different customers, thenindividual customer’s experience about delivery time would be different.47Indian Statistical InstituteDESCRIPTIVE STATISTICSInter Quartile RangeThe lower quartile Q1 is the value such that one-fourth of the observations fallbelow it and three fourths fall above it.The middle quartile is the medianThe third quartile Q3 is the value such that three -fourths of the observations fallbelow it and one-fourth above it.The Inter Quartile Range IQR is the difference between the third quartile andthe first quartile.Thus IQR Q3-Q14824
09-11-2018Indian Statistical InstituteDESCRIPTIVE STATISTICSBox PlotBox Plots are simple means of providing a useful picture of how the data aredistributed. To draw Box Plot Determine Q1, Q3 and IQR A line is drawn at the median to divide the box Two lines, known as Whiskers are drawn outward from the box.One line extends the top edge of the box at Q3 to either maximum data value orQ3 1.5 (IQR). Another line from the bottom edge of the box at Q1 extends downwardto a value that is either the minimum data value or Q1 – 1.5 IQR whichever isgreater. The end points of the whiskers are known as upper and lower adjacent values Values that fall outside the adjacent values are candidates for consideration as49outliers. They are plotted as asterisks (*).Indian Statistical InstituteDESCRIPTIVE 0.582.989.780.293.35025
09-11-2018Indian Statistical InstituteDESCRIPTIVE STATISTICSBox PlotsFor a given data set:L 22Q1 46Q2 Md 62Q3 75IQR 75 - 46 29H 96x 20x 30L 22 40 50Q1 46 60 70 80Md 62 Q3 75 90 100H 9651Indian Statistical InstituteDESCRIPTIVE STATISTICSBox Plots for Aptitude Scores100Apptitude Score8060402012Sample5226
09-11-2018Indian Statistical InstituteDESCRIPTIVE STATISTICSExercise 1: The data of 30 customers on credit card usage in INR1000, are given.1. Summarize and interpret the credit card usage?2. Plot histogram?53Indian Statistical InstituteNORMAL DISTRIBUTION5427
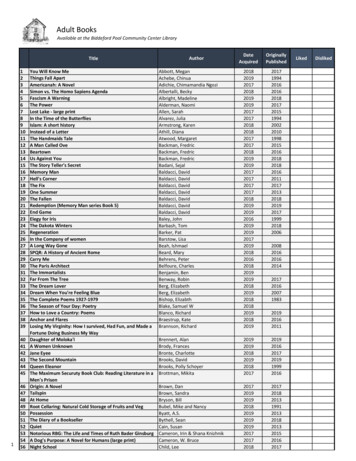
09-11-2018Indian Statistical InstituteNORMAL DISTRIBUTIONIntroduction to Normal DistributionDeveloped by Karl GaussMost prominently used distribution in statisticsApplicability to many situations where given the population knowledge, we needto predict the sample behaviorMany natural phenomena follows Normal Distribution– Human characteristics such as weights, heights & IQ’sAlso Physical process outputs such as yield, follow Normal Distribution55Indian Statistical InstituteNORMAL DISTRIBUTIONNormal Distribution PropertiesThe normal curve is bellshaped and has a single peakat the center of the distributionIt is symmetric about meanThe arithmetic mean, median,and mode of the distributionare equal and located at thepeakThus half the area under thecurve is above the mean andhalf is below itArea under the curve is 1It is asymptotic56Normal Distribution28
09-11-2018Indian Statistical InstituteNORMAL DISTRIBUTIONArea under Normal Distribution - - 1σµ 1σ68.26%- 2σ 2σ95.46%- 3σ- 4σ- 5σ- 6σ99.73% 3σ99.9937%99.99943%99.999998% 4σ 5σ57 6σIndian Statistical InstituteNORMAL DISTRIBUTION- X2 X1Area covered within X1 & X2 represents the probability that a data point liesbetween X1 & X2If mean, X1 50 & X2 47.5, then the area between them ½ of 68.26% 34.13%In other words, if the distribution (say Productivity of a Programmer in LOC/day)follows normal distribution, then probability, that the productivity on a particularday in future would lie between 47.5 and 50 is 34.13%5829
09-11-2018Indian Statistical InstituteNORMAL DISTRIBUTIONStandard Normal Distributionµ1µ2 µ3Instead of dealing with a family ofnormaldistributionswithvarying means & standarddeviations, a standard normalcurve standardizes all thedistributions with a singlecurve that has a mean of 0 &standard deviation of 1It’s illustrated as N ( 0,1 ), i.e.mean 0 & standard deviation 1- 59Indian Statistical InstituteNORMAL DISTRIBUTIONConcept of Z ValueTo standardize different measurement units, the Z variable is usedZ WhereX - µσX Value of the data point we are concerned withµ Mean of the data pointsσ Standard Deviation of the data pointsZ Number of standard deviations between X & the mean (µ)Z value is unique for each probability within the normal distributionIt helps in finding probabilities of data points anywhere within the distribution6030
09-11-2018Indian Statistical InstituteNORMAL DISTRIBUTIONIn a certain organization, the response time to customer complaints is normallydistributed with a mean of 110 minutes with a standard deviation of 3 minutes.What is the probability that for any complaint the response time will be morethan 114 mins? Less than 105 mins?p 105 minsp 114mins61Indian Statistical InstituteIntroductiontoPython6231
09-11-2018Indian Statistical InstitutePYTHON INSTALLATION1. Download Anaconda from ml2. Run the set up (exe) file and follow instructions3. Check Jupyter notebook is installed63Indian Statistical InstitutePYTHON INSTALLATION3. Open Jupyter Notebook6432
09-11-2018Indian Statistical InstitutePYTHON INSTALLATION3. Open Jupyter Notebook65Indian Statistical InstituteDESCRIPTIVE STATISTICSusing Python6633
09-11-2018Indian Statistical InstituteDESCRIPTIVE STATISTICSExercise 1: The monthly credit card expenses of an individual in 1000 rupees isgiven in the file Credit Card Expenses.csv.a. Read the dataset to Pythonb. Compute mean, median minimum, maximum, range, variance, standarddeviation, skewness, kurtosis and quantiles of Credit Card Expensesc. Compute default summary of Credit Card Expensesd. Draw Histogram of Credit Card Expenses67Indian Statistical InstituteDESCRIPTIVE STATISTICSReading a csv file : Source codeimport pandas as mypdmydata mypd.read csv("E:/ISI/PM-01//Data/Credit Card Expenses.csv")mydataTo read a particular column or variable of data set to a ne variableExample: Read CC Expenses to CCcc mydata.CC Expensescc6834
09-11-2018Indian Statistical InstituteDESCRIPTIVE STATISTICSOperators - ArithmeticOperatorDescription nentiation%modulus (x mod y) 5%2 is 169Indian Statistical InstituteDESCRIPTIVE STATISTICSOperators - LogicalOperator ! Descriptionless thanless than or equal togreater thangreater than or equal toexactly equal tonot equal to7035
09-11-2018Indian Statistical InstituteDESCRIPTIVE STATISTICSDescriptive StatisticsComputation of descriptive statistics for variable CCFunctionMeanMedianModeStandard .var()cc.min()cc.max()cc.quantile( 3-0.09-0.43671Indian Statistical InstituteDESCRIPTIVE STATISTICSDescriptive ticsCountMeanStandard 53575961657236
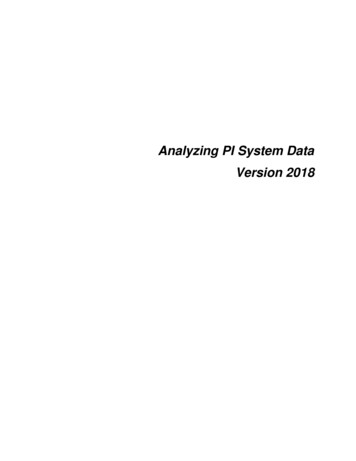
09-11-2018Indian Statistical InstituteDESCRIPTIVE STATISTICSDescriptive StatisticsArithmetic functions for variable prod()FunctionCodeSquare rootImport math as mymathmymath.sqrt(49)Sum of Squaressum(cc**2)Value2011486.21447E 18Value77027673Indian Statistical InstituteDESCRIPTIVE STATISTICSGraphs:GraphCodeHistogramimport matplotlib.pyplot as myplotmyplot.hist(cc)myplot.show()Box Plotmyplot.boxplot(cc)myplot.show()7437
09-11-2018Indian Statistical InstituteDESCRIPTIVE STATISTICSGraphs:HistogramBox plot75Indian Statistical InstituteDESCRIPTIVE STATISTICSExercise 2: The data of 30 customers on credit card usage in INR1000, sex (1:male, 2: female) and whether they have done shopping or banking (1: yes , 2: no)with credit card are given in file CC Expenses Exercise.csv.a. Import the file to Pythonb. Compute descriptive summary of variable Credit Card Usagec. Check whether the average usage varies with sex?d. Check whether the average credit card usage vary with those who doshopping with credit card and those who don’t do shopping?e. Check whether the average credit card usage vary with those who do bankingwith credit card and those who don’t do banking?f. Compute the aggregate average of usage with sex & shopping?g. Compute the aggregate average of usage with all three factors?7638
09-11-2018Indian Statistical Ins
1 Introduction to Predictive Modeling 9 Linear Regression 2 Introduction to Python 10 Dummy Variable Regression 3 Descriptive Statistics 11 Binary Logistic Regression 4 Test of Hypothesis 12 Classification & Regression Tree 5 Normality Test 13 Random Forest 6 Analysis of Variance 14 Naive Bayes 7 Cross Tabulation & Chi Square Test 15 k Nearest .