Transcription
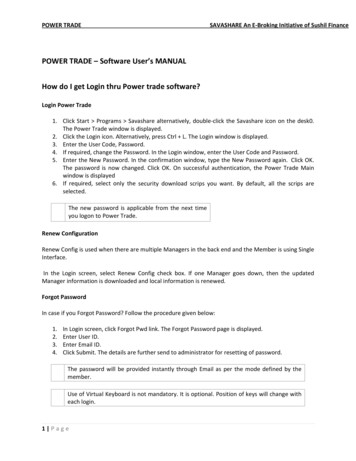
POWER TRADESAVASHARE An E‐Broking Initiative of Sushil FinancePOWER TRADE – Software User’s MANUALHow do I get Login thru Power trade software?Login Power Trade1. Click Start Programs Savashare alternatively, double‐click the Savashare icon on the desk0.The Power Trade window is displayed.2. Click the Login icon. Alternatively, press Ctrl L. The Login window is displayed.3. Enter the User Code, Password.4. If required, change the Password. In the Login window, enter the User Code and Password.5. Enter the New Password. In the confirmation window, type the New Password again. Click OK.The password is now changed. Click OK. On successful authentication, the Power Trade Mainwindow is displayed6. If required, select only the security download scrips you want. By default, all the scrips areselected.The new password is applicable from the next timeyou logon to Power Trade.Renew ConfigurationRenew Config is used when there are multiple Managers in the back end and the Member is using SingleInterface.In the Login screen, select Renew Config check box. If one Manager goes down, then the updatedManager information is downloaded and local information is renewed.Forgot PasswordIn case if you Forgot Password? Follow the procedure given below:1.2.3.4.In Login screen, click Forgot Pwd link. The Forgot Password page is displayed.Enter User ID.Enter Email ID.Click Submit. The details are further send to administrator for resetting of password.The password will be provided instantly through Email as per the mode defined by themember.Use of Virtual Keyboard is not mandatory. It is optional. Position of keys will change witheach login.1 Page
POWER TRADESAVASHARE An E‐Broking Initiative of Sushil FinanceThe Work EnvironmentPower Trade provides a user‐friendly working environment. On successfully logging on, the Power TradeMain window is displayed with various options: the Menu Bar, Tool Bar, Indices Bar, Filter Bar, MessageBar, Status Bar. The Menu Bar consists of various options:oooooooooo File: Manages the file operations, enables loading and saving of workspaces.View: Various functionalities are available such as Bhav Copy, Net Position and so on.Market: The market information functionalities are available such as Market watch,Market Picture and so on.Orders: The various Order‐related functions are available here.Ex:The various Exercise‐related functions are available here.Tools: Certain handy tools are also available such as Calculators, Online backup facilityand so on.Window: Manages displayed windows.Stocks: Status of the Depository can be viewedLinks: Useful web sites links can be directly browsed from here.Help: The detailed Help file can be invoked from here also version detail is available.The Tool bar consists of various buttons to perform the common tasks quickly.ToolbarButtonDescriptionLoginLogoffOnline BackupPrintMessage LogOrder EntryOrder BookTradesIntegratedNetPositionMarket WatchSecurityInformationModify OrderCancelSelectedOrder (s)2 Page
POWER TRADESAVASHARE An E‐Broking Initiative of Sushil FinanceCancel All Orders The Indices Ticker displays the current Nifty, Sensex values.The Filter Bar enables entering securities/contracts in the Market Watch.‐ Filter Bar displayingvarious scrip detailsVarious system messages are displayed in the Message Bar. The Status Bar displays the BSE Code,along with various status indicators.Availability of shortcut keys for most common functionsCommonly used abbreviations for many widely used terms in Power Trade.This help uses common abbreviations for many widely used terms in the Power Trade application.AbbreviationsATPB/SD. QtyDPREOSGTCGTDIOCLTPLTQLTTLUTMTM G/LMTM Pos.OIOwn/CliRLSLOLEOSESSEOTODYEOSTLMEOSQty.Trig PriceULVol.3 PageFull FormsAverage Traded PriceBuy/SellDisclose QuantityDaily Price RangeEnd of SessionGood Till CancelGood Till DateImmediate Or CancelLast Traded PriceLast Traded QuantityLast Traded TimeLast Updated TimeMark To Market Gain/LossMark To Market PositionOpen InterestOwn/ClientRegular LotS0 LossOdd LotEnd of SessionEnd of TodayEnd Of SettlementEnd Of SessionQuantityTrigger PriceUnderlyingVolume
POWER TRADESAVASHARE An E‐Broking Initiative of Sushil FinanceWorkspaceWorkspace is view of Power Trade system main window along with all the windows, toolbars, and thestatus bar in their corresponding size and positions. The Power Trade system provides you a facility ofsaving a workspace, that is, (the view of the Power Trade system window) as the default window so thatthe same view can be retrieved when you log on the next time. The advantage of creating a workspaceis that you need not open the windows and arrange them every time.For example, open multiple windows and arrange them accordingly. Click File Save Workspace andsave the workspace as a file. In the Save As window, type a new name and click Save. The workenvironment is captured as seen.To restore from stored workspaces, click File Load Workspace. Browse the file and click Open. Set theworkspace as the default file. On logging to Power Trade, the windows are arranged in the samemanner as you saved them.Ticker (Integrated)Ticker (Integrated) displays entire list of securities and contracts from the applied portfolio.View Ticker (Integrated)1. To view Integrated Ticker, click View Ticker (Integrated). Alternatively, press Shift F4; right‐click the ticker and select and apply the Portfolio.2. To customize the tickers, click on the Ticker and select the appropriate color, font, layoutoptions from the displayed Customize windowTicker (Conditional)Ticker (Conditional) displays only the contracts included from the applied conditions.View Ticker (Conditional)1. To view conditional Ticker, click View Ticker (Conditional); right‐ click the ticker and select andapply the Portfolio.2. To customize the tickers, click on the Ticker and select the appropriate color, font, layoutoptions from the displayed Customize windowIndexIndex window displays latest calculated indices. It tracks the current trend of the index values on aregular time basis and updates information as the market variations occur. Index Graph ‐ graphical representation of the movements4 Page
POWER TRADESAVASHARE An E‐Broking Initiative of Sushil FinanceView Index information graphically1. Click View Index Index Graph. Alternatively, press Shift Page Up; double‐click an indexfigure on the Index Ticker. A graphical representation of the selected index is displayed.2. The graph is plotted on the graph toolbar is available that enables viewing various graphattributes.Toolbar IconDescription1Textenables user to write a text on the chart2Quadrant lines3Tyrone levels4RaffRegression5Fibonacci arcs6Fibonacci FansDivide high and low range in to four equalsections and show horizontal linesaccordingly.Tirone levels are a series of horizontal linesplotted on trading charts to predict possiblesupport and resistance levels, developed byJohn Tirone. They are very much similar toFibonacci retracements and Quadrant lines.Tirone levels are used mainly by short‐termtraders, especially day traders; they are alsouseful for long‐term trading.Developed by Gilbert Raff, the Raff RegressionChannel is a linear regression with evenlyspaced trendlines above and below. Thewidth of the channel is based on the high orlow that is the furthest from the linearregression. The trend is up as long as pricesrise within this channel. An uptrend reverseswhen price breaks below the channelextension. The trend is down as long as pricesdecline within the channel. Similarly, adowntrend reverses when price breaks abovethe channel extensionFibonacci Arcs are percentage arcs based onthe distance between major price highs andprice lows. Therefore, with a major high,major low distance of 100 units, the 31.8%Fibonacci Arc would be a 31.8 unit semi‐circle.Fibonacci Fans use Fibonacci ratios based ontime and price to construct support andresistance trendlines; also, Fibonacci Fans areused to measure the speed of a trend'sSr.No.5 Page
POWER TRADE6 PageSAVASHARE An E‐Broking Initiative of Sushil Finance7FibonacciRetracements8Error Channels9Fibonacci timezones10Ellipsemovement, higher or lower.It is a method of technical analysis fordetermining support and resistance levels bydividing price high and low levels based onFibonacci ratios.Errror channels are calculated by plottingparallel lines above and below the LinearRegression Trendline at a distance of standarderror.These are vertical lines based on the fibonaccisequence. These lines extend along the x axis(date axis) as a mechanism to forecastreversals based on elapsed time.Allows to add a circle or ellipse to the chart.11Rectangleallows to add a rectangle to the chart.12Buy Symbolallows to add a buy symbol.13Sell Symbolallows to add a sell symbol.14Exit symbolallows to exit symbol15Trend line16Gann fans17Horizontal line18Speedresistancelinesare used to graphically design trends in dataand to analyze problems of prediction.markup a chart with common rise and runratios.allows to add a horizontal line to your chartfor showing support or resistance on pricechart.Displays two trend lines and the slope of eachline defines a different rate of change.19Add bmpobjectsallows to add bitmap object to charts.20Free line21Cross hairsymbolAllows user to draw any free handdrawing/marking on chart.Curcer changes to cross hair viewng.22Darvas boxDarvas box is a technical indicator whichallows to identify break outs. This buttonenables and disables darvas boxes viewing onchart.
POWER TRADESAVASHARE An E‐Broking Initiative of Sushil Finance3. To view index information for a plotted point, click the required point or drag the required area.With the left mouse button pressed, drag the mouse across a range of points and view thedetails.4. To display graphically the open, high, low, close price values of the scrip, right‐click inside thewindow and select OHLC.5. To view multiple scrips and watch the variations in the same window, select Manage Scripstoolbar icon.Bhav CopyBhav Copy gives an overview of fluctuations, and the trade volume of all contracts that are published bythe Exchange based on the market session. Usually, a Bhav Copy is broadcasted at the end of eachtrading session. Power Trade provides an exclusive Bhav Copy for each market segment.View Bhav Copy1. Click View Bhav Copy Bhav NSEDS/NSEL. The respective Bhav Copywindow is displayed with OHLC Price details and 52W High/Low values. The displayed details canbe saved for future reference. The Bhav Copy can be converted into a Text File Format ordownloaded locally.Multiple Bhav Copy windows can beinvoked simultaneously.2. To convert the Bhav copy into text format, right‐click inside the Bhav Copy window; select SaveAs and specify the location where you want to save.TradesTrade Book provides trade details. Using the Trade Book, you can view the orders, which are executed.For viewing selective transaction output, the Trade Filter window can be used.Applying Filter conditions in Trades1. Highlight a security in the Market Watch window.2. Click View Trades. Alternatively, click the toolbar iconor press F8. The Trades window isdisplayed for that particular scrip. Press F8 again, will invoke the Trades Book [All} window.3. Right‐click inside the Trades window and select Filter from the various right‐click optionsavailable. The Trade Filter window is displayed. By default, it displays Trades from all InstrumentTypes.3. As required, apply the conditions you want in the filter and Click Apply. Accordingly, theconditional output is displayed.The All sub‐option displays the entire records7 Page
POWER TRADESAVASHARE An E‐Broking Initiative of Sushil Financeof the selected filter option.See an ExampleOrder Entry time stamp feature stamps the orderentry time in an added field called Server time inTrade window. This field displays the time when anorder is actually placed.To view selective Trade details, right‐click inside theTrade Book window, click Column Profile andcustomize the window columns as required.Bulk Trade Modification1. Click View Trades or press F8. The Trades window is displayed.2. Select multiple scrips.3. Right‐click inside the Trades window and click Modify. On confirmation, the Bulk TradeModification window is displayed.4. Modify the changes as required.5. Click Modify.Trades Online Backup1.2.3.4.Right‐click inside the Trades window.Click Online Backup. The Online Backup window is displayed to take the Trades backup.If required, click Change. to modify the backup location.Click Generate File. The Trades backup is taken.Net PositionNet Position displays the net position details for all instrument types or contracts or commodities. Youcan view daily net position for all instruments with details like contracts, total buy/sell quantity, buy/sellaverage, net quantity, net average, net value, net price along with the MTM G/L and MTMV Positions. The negative (‐) Net Quantity indicates a Sold position.The positive Net Quantity indicates a Bought position.The negative (‐) Net Value signifies the negative Amount.The positive Net Value signifies the positive Amount.View Net Position Details Based on Product Type8 Page
POWER TRADESAVASHARE An E‐Broking Initiative of Sushil Finance1. Click View Net Position. Alternatively, click the toolbar icon. The Integrated Net Positionwindow is displayed with the position details of the executed transactions.2. Select Product type as Margin/Delivery/MTF/PTST. The respective Product Type details aredisplayed in Net Position window.Square off All the Net Position1. Click View Net Position. Alternatively, click the toolbar icon. The Integrated Net Positionwindow is displayed with the position details of the executed transactions.2. Right‐click inside the window and select Square‐off All. The Square Off window is displayed.3. Double click the order to modify.4. Click Modify.5. Click Subm
Developed by Gilbert Raff, the Raff Regression Channel is a linear regression with evenly spaced trendlines above and below. The width of the channel is based on the high or low that is the furthest from the linear regression. The trend is up as long as prices rise within this channel. An uptrend reverses when price breaks below the channel extension. The trend is down as long as prices