Transcription
Texas Automated Buoy SystemNorman L. Guinasso, Jr., Leslie C. Bender III, John N. Walpert, Linwood L. Lee III,Geochemical and Environmental Research Group, Texas A&M UniversityRobert D. MartinTexas General Land OfficeRobert D. Hetland, Steven K. Baum, and Matthew K. HowardDepartment of Oceanography, Texas A&M UniversityAbstract- The Texas Automated Buoy System (TABS) began in1994 when the Texas General Land Office (GLO) funded theGeochemical and Environmental Research Group (GERG) atTexas A&M University to design and purchase five telemeteringcurrent meter buoys. Instrumented buoys continuously measurecurrent velocity about six feet below the surface and transmit thedata to shore on a regular schedule via satellite telephone. Thesystem has eight buoys funded by the TGLO operating along theTexas Coast – one near Sabine Pass, two off Galveston, onemidway between Freeport and Corpus Christi, one off CorpusChristi, and two off Brownsville. The eighth buoy, a three meterdiscus buoy, was installed off Port Aransas in the summer of2005 and removed in 2008. Two additional buoys located nearthe Flower Garden Banks National Marine Sanctuary are fundedseparately by an oil industry consortium but are operated as partof the TABS program.Four different types of TABS buoys are currently used by theprogram. All the buoys can accommodate single point currentsensors. The 2.25 and 3m and TABS II buoys can accommodateacoustic current profiling instruments and meteorologicalpackages which include air temperature and humidity,barometric pressure, as well as wind speed and direction. Thelarger two buoys have both mechanical and acousticanemometers as well as accelerometers for measuring waves. TheTABS I buoys can be deployed in 10-20m water depth. TheTABS II buoys are suitable for deployment in 15m to 45m waterdepth. The two larger buoys have been deployed in up to 110mwater depth.Computers at Texas A&M University automatically collectdata from the buoys every two hours via the satellite datamodems and make the observations available to GLO and thegeneral public via the Internet. TABS data are made available toNOAA NDBC via ftp to permit the data to be used by theNational Weather Service. TABS sites B, J, K N and V have beengiven NDBC designators 42043, 42044, 42045, 42046 and 42047respectively.In 1998 a modeling component was added to the TABSprogram with the development and implementation of POMadapted to perform simulations on the Texas shelf. In 2002 themodeling was extended with the implementation of ROMS. Bothmodels are run on a regular basis and output to a web page.Wind data from National Center for Environmental Prediction(NCEP) Eta-12 wind fields are used to drive the model innowcast and forecast modes.Hurricanes have affected the buoy system resulting in the lossof several buoys at the deeper offshore locations. The TABS2.25m buoy was developed in an effort to deploy a buoy thatcould survive hurricanes. In September, 2008, the eye ofHurricane Ike passed directly over Buoy V located near theFlower Garden Banks. The mechanical anemometer wasdamaged but the acoustic wind sensor gave a complete record of0-933957-38-1/09/ 20.00 2009 MTSthe storms passage. Wave and atmospheric pressure data werealso recorded. Perhaps most interesting is the decrease ofmeasured waves in the eye of the storm.I.INTRODUCTIONDuring the first few hours of an oil-spill event, the spillresponse management team must make critical decisions aboutoperations and logistics. Effective response requiresimmediate information about wind and current velocityconditions to quickly evaluate the trajectory, fate, andpotential impact of spilled material. In 1991 the Texaslegislature passed the Texas counterpart of the federal OilPollution Act of 1990 (OPA), the Oil Spill Prevention andResponse Act (OSPRA). This act designated the TexasGeneral Land Office (GLO) as the lead state agency fordealing with oil spills in the marine environment. In 1994 theGLO implemented plans for an operational system ofinstrumented buoys off the Texas coast, to be known as theTexas Automated Buoy System (TABS). The purpose of thebuoy system was to protect Texas coastal waters by providingtimely, accurate observations of winds and currents for use inspill response operations [1], [2], [3]. The GLO funded, fromits Coastal Protection Fee, the Geochemical andEnvironmental Research Group (GERG) at Texas A&MUniversity to design, build and operate a system of moored,telemetering current meter buoys using off-the-shelftechnology. GERG, working with Woods Hole Group (WHG)of East Falmouth, Massachusetts, designed the buoys tomeasure current velocity at a fixed depth of about two metersbelow the surface using an electromagnetic current sensor andtransmit the data to shore on a regular schedule via theexisting offshore cellular telephone network. In early 1995,less than nine months after receiving the contract, GERGdeployed the first buoys utilizing this technology. In March1996 TABS experienced its first major test with the bargeBuffalo 292 oil spill [4]. In its first ten years of operationthere were twenty major spills in which NOAA personnelhave worked with and consulted the TABS data [3]. Acomprehensive description of the history and operation of theTexas Automated Buoys System is given in [5].
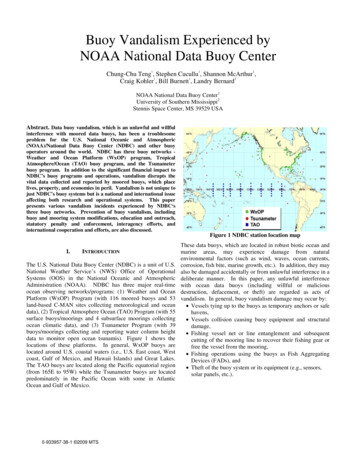
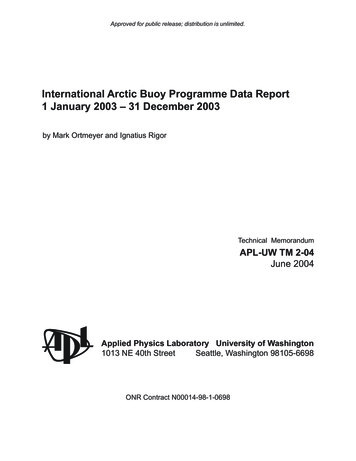
II. EQUUIPMENTFFourtypes of buoysbare usedd by the prograam. All are soolarpowwered and aree moored to thet bottom wiith chain and orNillspin wire. Thhe buoys are shhown in Figuree 1 approximateelyto scale.sA. HullsT TABS I buuoys are built fromThefa 15 cm pipepwith flanggesat bothbends coveered with a cloosed cell urethhane foam whiichin turntis coveredd with a Kevlar jacket. A staainless steel caageprootects the curreent meter and provided an attachment poointfor the mooring.TTABSII buoyys have a fabriicated aluminuum pressure caasewhhich is also covvered by urethaane foam a withh a Kevlar jackket.TAABS II buoys haveha fabricatted aluminum tower that holldsthee solar panels, metm sensors annd communicattion antennae. Astaiinless steel cagge protects thee current meterr and provides anattaachment point for the moorinng.T TABS thrree meter buoyThey uses a commmercial hull froomtwoo different mannufacturers as used by the NOOAA NDBC andaEnvvironment Cannada.T TABS 2.225m buoys havTheve a 2.25m diaameter foam huull,aluuminum top annd bottom plattes, an aluminuum tower, andd astaiinless steel undderwater bottoom frame. We have constructtedTAABS 2.25m buuoys using ureethane foam floatation coverredwitth Kevlar and alsoa using a foaam hull providded by Gilman.x BBuoy orientatioon for winds – Either a KVH C100coompass or a Hooneywell HMRR 3300 digital compassx AirA temperaturee – Either a Rootronics MP1011A or an RMYYoung41342VCC in a radiationn shieldx RelativeRhumidiity – Rotronicss MP101Ax AirA pressure – VaisalaVPTB 1000ATABBS 2.25 and thrree meter buoyys have an addditional R. MYoung wind sensor.F. Waave sensorsTABBS 2.25m buoyys and TABSS three meter buoys use aCrossbow 4400IMU inertial monitooring unit. Thiis instrumentprovidees accelerationns in the x, y, z directions and angularaccelerration rates aroound the pitchh, role and yaww axes. Datafrom a Honeywell magneticmcompaass are combinned with thisunit to calculate wavee height and dirrection.B. Power SystemmsA TABS buoyys make use ofAllo silicon solar panels and leaadacid batteries.unicationsC. Buoy Electronnics and CommuTTABSI buoys use a dedicateed microprocessor provided byWooods Hole Insttrument Systemms and a Qualccomm GSP-16620Paccket Data Moddem.OOtherbuoys usse a PC-104 emmbedded compputer running thetLinnux operating system. Thesee systems provide twelve RSR2322 channels, USB,UWi-Fi, andaeight A/DD channels. TheTcommputer can sennd and receive data using a QualcommQGSSP16220 Packet Dataa Modem via thhe GlobalStar satellitesnetwork.Ann ARGOS PPTT serves as a backupbdata syystem and as anemmergency locatoor beacon.D. Current MeterrsA buoys can be equipped withAllw Aanderaa Doppler CurreentSennsor DCS41000R although soome of the TAABS II buoys useumoodel DCS3900R. The TABSS II, TABS 2.25m and TABBSthreee meter buoyss can also be equipped with TRDITWorkhorrseADDCP.E. Meteorologicaal sensorsTTABSII, 2.5mm and three metermboys havve the followiingcommplement of seensors:x Wind speed and directiion – Gill Innstruments WiindObserver II Ultrasonic Annemometer Model 1390x Buoy tilt compensationcforf winds – HoneywellHHMMR3300 Digitaal Compass orr a Shaevitz AccuStarAII DuualAxis ClinommeterFigure 1. TABS buoys lefft to right: three metermdiscus buoy, TABS II buoyATABS II buuoy with single poiint current meter, TABSTI buoy,with ADCP,TABS 2.25 meterr buoyIII. MODELLLINGTwo numerical oceean models of thet Texas shelff are run on aregularr basis by R. D.D H and S. K B. in the Department ofOceanoography at Texxas A&M Unniversity The originaloshelfcirculattion model, deeveloped and maintained byy Dr. JosephYip frrom 1998-20002, consists ofo a 3-D verrsion of thePrincetton Ocean ModelM(POMM) adapted to performsimulattions on the TexasTshelf on a domain exttending from25oN on the Mexicann coast to 85oW at the coastlinne of Florida.The operational POMM model is a simmplified barotrropic versionthat peerforms a 24 hourhsurface currentcpredictiion once perday. WhenWR. D. H toook over the programpin 20002, he led thedeveloppment of a seecond-generatioon shelf circulation modelusing thet Regional OceanOModelinng System (RROMS). Thedeveloppment continuues today. Thee ROMS baseed circulationmodel was designedd to provide greatergmaintaiinability andextensiibility than was available witth the POM model,mas wellas to enableegreaterr flexibility annd ease of managingmand
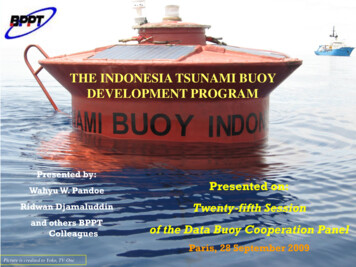
transforming the simulation model input and output fields.Both the computational kernel and the data handlinginfrastructure were completely revised for these purposes.ROMS is a free-surface, hydrostatic, primitive equationocean model that uses stretched, terrain-following coordinatesin the vertical and orthogonal curvilinear coordinates in thehorizontal. (See [6] and the references therein for backgroundinformation on both POM and ROMS.) Computationally,ROMS uses advanced numerical algorithms and softwaretechnology to facilitate efficient simulations on single andparallel computer architectures. Scientifically, it contains avariety of modular features including high-order advectionschemes; accurate pressure gradient algorithms; severalsubgrid-scale parameterizations; atmospheric, oceanic, andbenthic boundary layers; biological modules; radiationboundary conditions; and data assimilation. These scientificand computational features allow for both an easilymaintained present operational system, and a flexible upgradepath for the research and development of future, improvedversions of the system. The higher order advection schemeand the boundary layer schemes, in terms of mixing, are used;data assimilation is not.Both models are driven by 12km gridded winds derivedfrom the NCEP NMC WRF model which are downloadedfrom NCEP by an automated system in the Department ofOceanography.B. Data analysisThe analysis of the data proceeds in two steps: Level Iquality control and Level II quality control. Level I qualitycontrol is automated and begins when the raw data from theTABS buoys are received. Raw data are transferred to a Linuxserver where the ASCII data are converted to engineeringunits. Obviously flawed data are removed. The Level I dataare immediately used to update the main web page shown inFigure 2. This web page shows in graphical form the latestdata and provides links to the underlying data bases. Graphicaldisplays are generated every hour showing time series plots ofthe currents, water temperature, buoy tilt, and variousengineering parameters that indicate the operating status of thebuoy.IV. DATA MANAGEMENTA. CommunicationsPrimary communication with the TABS buoys is via theGlobalstar satellite data network. The buoys initiate thecommunications link once every 0.5 to 2 hours by placing acall to the modems at GERG or at Texas A&M University.The duration of the each call is generally a minute or less,during which current speed and direction, water temperature,meteorological data, and engineering data are transmitted asASCII strings. One advantage of Globalstar is the ability toconduct two-way communications. Buoys can be instructed totransmit data more frequently in the event of an oil spill orother emergency. After data are received, an automated datacollection algorithm checks for data loss. Any gaps in thetelemetered data can then be filled at the next successfultransmission. If the communication buffer on board the buoyfills up, this is assumed to be an indication that the primarycommunication link is down and a secondary communicationlink, ARGOS, is initiated. The message size of SystemARGOS is limited to 32 bytes, so we assure that the mostrecent data in the communication buffer have priority overolder data. Each message, or burst, contains four sets of halfhourly currents and battery voltages. During a satelliteoverpass, up to seven bursts can be uploaded depending on theduration of the pass (a function of the elevation and azimuth)and the quality of the transmission link. The interval betweensatellite passes varies.Figure 2. Image from TABS web page showing near real time oceanographicdata. The green letters represent TABS buoys. The red letters and numbersrepresent NDBC buoys and CMAN stations. Surface currents are shown asblack vectors. Winds are shown a red vectors but can be displayed at windbarbs at the viewers optionAn example of the plot displaying currents and watertemperature is shown in Figure 3. Time series plots of themeteorological data, winds, air temperature, and atmosphericpressure are made available for the TABS II buoys. Once aday, the quality of the Level I data is reviewed by anexperienced oceanographer, who can then make furthercorrections to the data when needed. The final qualitycontrolled Level I data are then inserted into a database forretrieval by users.C. Data disseminationThe Level I quality controlled data are inserted into anarchival database designed to facilitate the extraction of userspecified subsets. The database is built on mysql, an opensource Linux structured query language database, and onsimple flat ASCII files. The data have proven useful for modelinitialization, model skill assessment, research, andoperational planning purposes. The GLO has direct access to
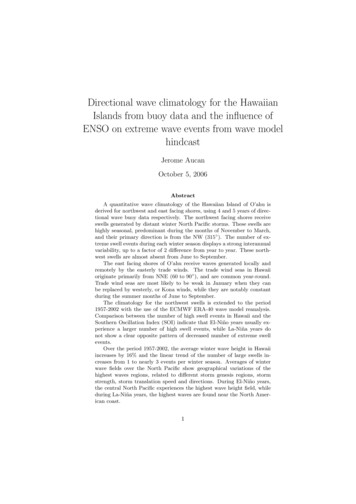
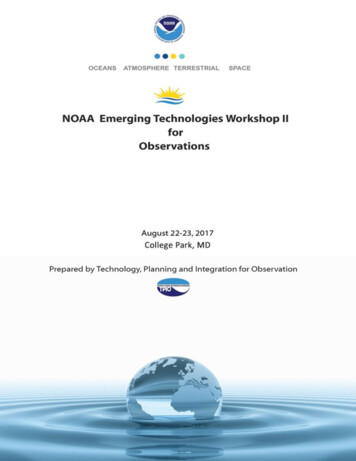
this database via FTP over the Internet. The public has accessthrough the World Wide Web (WWW) at nally, TABS meteorological data from sites B, J, K,N, and V are branded as NDBC sites 42043, 42044, 42045,42046, and 42047 and formatted for ingest into the NationalData Buoy Center. The TABS web page provides the userwith access to a variety of oceanographic and meteorologicaldata products. Using their browser, the user is able to vieweither the latest data or access the database and view archiveddata. The user can also download the data for later use. Userscan select a TABS buoy location from the map or from textlinks for those without a graphical web browser. For eachTABS station the user can choose to view either a graph of thepast 4 days of data or the data in tabular format. The graphconsists of a ‘‘stick plot’’ of the currents, cross shelf, andalong shelf components of the current and water temperature(see Fig. 3). Data are presented in both English and metricunits. Graphs can be downloaded as either a GIF image or apostscript file.Figure 3. Level I data from TABS Buoy B viewed by clicking on the mapShown in Figure 2. The four day stick plot gives the viewer an immediateindication of data quality. A time series of the along-shelf and cross-shelfcomponents of the currents have been found useful to a wide variety of users.The last panel gives salinity at 1.7m depth and temperature at 1.7 and 2.4meter depth.Several additional features of the TABS website assist inthe utilization of the TABS data. A summary plot provides astick plot for each buoy using a common time axis.A status table lists buoy latitude, longitude, lease block, andwater depth. The status table also indicates which of the buoyshave successfully transmitted their data during the past 12 hrand contains other information regarding the operational statusof each buoy. Each buoy page also contains a link that allowsthe user to search the TABS database and retrieve data from abuoy for a user-selectable time period. The user can access upto two months of data at a time. The results of each databasesearch can be viewed in both graphical and tabular format.V. REAL TIME ANALYSISThe Real Time Analysis feature provides the user withmultiple views of the quality controlled oceanographic,meteorological and engineering data for the past 30 days. Theoceanographic data is presented for each buoy as a series ofgraphical products showing the vector stick plots of thecurrents, the decomposition of the current into its mean,periodic, and autoregressive components, the rotary spectra, ashort-term stochastic forecast, the probability of a flowreversal, the tides, a scatter plot, a current rose, and the watertemperature. The current vectors, the current decompositionand the current rose are provided in 1-, 2-, 4-, 7-, 14-, and 30day slices to accommodate the needs of oil spill managers. Anexample of a 7-day current decomposition plot is shown inFigure 4 for buoy D.Figure 4. An example of the RTA product showing the 7-day decompositionof the current into its mean, periodic and autoregressive components. Thesum of the three individual components accounts for 72.4% of the variance.
During the summer the flow at this site is weak and variable.The combination of the three individual components, mean,periodic and autoregressive, accounts for 72.4% of thevariance. This provides a sound statistical framework formaking a short-term stochastic forecast. Figure 5 shows theforecast for the next 48 hours in the top panel. In the middlepanel the forecast that was made the day before is compared tothe actual currents, along with statistics for speed anddirection. The bottom panel shows the 48-hour old forecastand compares it with the actual currents. We note that this is aparticularly good example of the forecast model. For thosebuoys equipped with a meteorological package, the wind datais presented as vector stick plots, a time series of the speed ofthe 10-minute mean and the maximum gust, the scatter plot, awind rose, the air temperature, the barometric pressure, andthe relative humidity. The winds are presented as 1-, 2-, 4-, 7-,14-, and 30-day stick plots. Also plotted are the latent heatflux, the sensible heat flux, the wind stress magnitude, and theair-sea temperature difference. All of the oceanographic andmeteorological data can be easily downloaded by the user.Figure 5. This is an example of the RTA product showing the short-termstatistical forecast of the currents. The recorded currents are shown in blue,the forecast currents in magenta.Figure 6 shows another real-time analysis product namely acurrent rose for Buoy K for the month of August 2009.VI. WAVE MEASUREMENTSThe new 2.25-m TABS buoys are outfitted with twoinstruments for measuring buoy motions, a six degree offreedom accelerometer and a high quality aviation grade 3axis magnetometer. The significant wave heights, peak andmean periods and directional spectra are computed from thisdata. The accelerometer is a Crossbow IMU440 solid stateFigure 6. This is another example of a real-time analysis product showing acurrent rose for the month of August 2009 for Buoy K.MEMS device designed to measure the linear accelerationalong three orthogonal axes and the rotation rates around thesame three orthogonal axes. The unit is not gimbaled, but ismounted (strapped-down) inside the buoy’s system controllerhousing approximately at the waterline with the z-axis alignedperpendicular to the buoy deck. The magnetometer is aHoneywell HMR 3300 digital compass that uses an internaltwo-axis accelerometer to allow accurate heading even whenthe unit is tilted at 60 deg. On board the buoy during real-timeoperations the x, y and z channels of the accelerometer dataare first processed to remove outliers. In order to compensatefor the buoy’s pitch and roll, the magnitude of the three axesaccelerations is taken to be the earth-referenced verticalacceleration, or heave [7]. The acceleration spectrum is thencomputed with a smoothed auto-spectral estimate based on theauto-covariance estimate described by [8].The majoradvantage of auto-covariance spectra is the frequency bins canbe specified a priori, allowing one to concentrate thefrequency resolution in the region where wave energy residesand eliminating bins at very low frequencies where no waveenergy is expected to be present. The benefits of using acovariance spectra rather than an FFT outweigh any minorspeed advantage gained from the FFT. A modified frequencydomain filter similar to that of [9] is applied to theacceleration spectrum to remove any low frequency noise.The acceleration spectra is then converted to the 1Ddisplacement spectra, from which the significant wave height,peak period and mean period are computed. Figure 7 showsan example of the resulting 1D displacement spectra.The directional spectrum is computed in the manner of[ and, because it requires pitch, roll and heading data, involvessynchronizing the compass data to the acceleration data. Theco-spectra and quad spectra of the
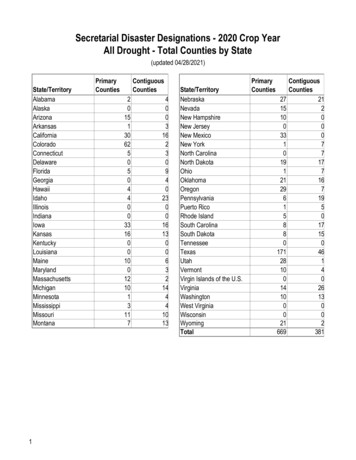
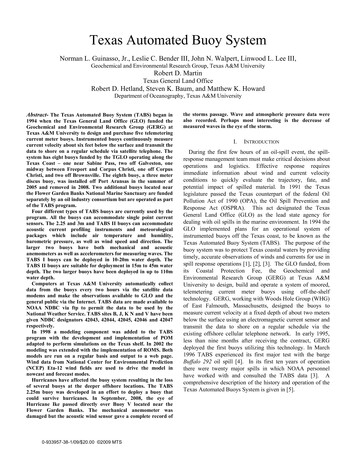
VII. HURRICANE IKEFigure 7. The 1D displacement spectra measured at buoy N.combinations of heave, pitch and roll are computed on boardthe buoy computed with a smoothed auto-spectral estimatebased on the auto-covariance estimate described by [8]. Eachof these spectra are sent to shore on an hourly basis, where theCollege Station computers compute the directional spectra.Figure 8 shows an example of the time series of wave heights,periods and mean wave direction recorded at buoy N. Themean wave direction is defined at the direction the waves atthe peak period are coming from, measured clockwise fromthe north.In its passage across the Texas continental shelf beforegoing ashore at Galveston, Texas around 2 am on September13, 2008, Hurricane Ike passed within 20 nautical miles ofbuoys “B”, “F” and “N” and went over the top of “V”. Thehurricane track and buoy locations are shown in Figure 9.Some data transmissions from buoys B, F and N were neverreceived, though the data was retrieved from B and F when thebuoys were recovered. Buoy “B” experienced peak windgusts of 17 m s-1 before the data stopped reaching CollegeStation, buoy “N” experienced peak wind gusts of 25 m s-1before the superstructure was swept away, and buoy “V”experienced peak wind gusts of 33 m s-1, first when theleading edge of the eyewall passed over the buoy and thenagain as the trailing edge went over. Buoy “V” experienced apeak current speed of 101 cm s-1, buoy “F” was 108 cm s-1,buoy “R” was 109 cm s-1, buoy “B” was 111 cm s-1, buoy “W”was 122 cm s-1, buoy “N” was 127 cm s-1, and the highestpeak current speed was recorded at buoy “D”, 128 cm s-1.Internally-recorded data from buoy N could not be recoveredfor post-processing. The wave and meteorological data frombuoy V transmitted in near-real-time provide a fascinatingrecord as the eye of Ike passed directly over the buoy (Figure10).o30 NHoustonBuoy R30'12 pmoBuoy B29 NBuoy F30'6 pmo28 NBuoy VBuoy N12 pm30'o27 N6 am30' o96 W30'o95 W30'o94 W30'o93 W30'o92 WFigure 9. The track of Hurricane Ike on from 5 am September 12 to 5 pmSeptember 13, 2008 and the location of TABS buoys. Times are in CDT.Figure 8. Sample of wave information from a five day period.
sonic anemometers and six axis accelerometers has led towhat we believe are improvements in the quality of buoy data.That this has been done in a university environment atreasonably low cost we attribute to the dedication of our staff.ACKNOWLEDGMENTSWe thank Greg Pollock (Deputy Commissioner for OilSpills, TGLO), Jerry Patterson (Commissioner, TGLO, 2003 present), David Dewhurst (Commissioner, TGLO, 1999 2003), and Gary Mauro (Commissioner, TGLO, 1983 - 1999),for their sustained support of the TABS Programs. Mr. FrankKelly played a pivotal role at GERG during the first five yearsof the program. We also would be remiss if we failed tomention the marine technicians that have been a critical part ofTABS over the past fourteen years, Paul Clark, R. J. Wilson,Marty Bohn, Alexey Ivanov, Eddie Webb, Willie Flemings,Andrew Dancer, Paul Dancer, Chris Schmidt, Chris Cook,Charles Ruckett, Mike Fredericks, Larry Lewis, ColeMarkham, Kevin Lamonte, Tony Cocchiarella, Jorge Barrera,and Marcus Trichel.REFERENCES[1]Figure 10. Buoy V recording the passage of Hurricane Ike as seen in near realtime on the TABS web site. The top panel shows the wind velocity as a stickplot. The third panel shows the significant wave height. The fourth panelshow the atmospheric pressure recorded at the buoy. As the eye of the stormpassed over the buoy, the wave height decreased from about 8m to about 5minside the eye of the hurricane.The barometer shows a minimum atmospheric pressure of 957mb as the eye passes overhead; the winds shift from northerlyto southerly. The air temperature decreases as the leadingedge of the eye wall approaches, and then as the eye passesover it increases to a local maximum and then decreases. Asthe eye moves away the temperature increases. Swell waves,seen as peak periods greater than 10 seconds begin to arrive atV nearly 48 hours before the hurricane does. In the eye thewave heights decrease from nearly 8 m to less than 5 m.VIII.CONCLUSIONSThe Texas Automated Buoy System is now in its 14th yearof operation. Starting with five buoys in 1995, it has expandedto nine buoys in 2009. We have watched the buoys evolvefrom small simple buoys like the TABS I suitable formeasuring currents in nearshore waters to the more capableTABS II buoys. Hurricanes have taught us that our spar buoydesigns may not been the most robust. As a result wedeveloped more capable buoys with more reserve buoyancyhave survived hurricanes and provided valuable data duringhurricanes. Our experiments with advanced sensors such asKelly, F. J., N. L. Guinasso, Jr., L. L. Lee III, G. F. Chaplin, B. A.Magnell, and R. D. Martin, Jr. . Texas Automated Buoy System(TABS): A public resource. In Proceedings of the OceanologyInternational 98 Exhibition and Conference, 10-13 March 1998,Brighton, UK, Vol. 1, pp. 103-112, 1998.[2] Guinasso, Jr., N. L., L. C. Bender, III, L. L. Lee, III, J. N. Walpert, J.Yip, R. O. Reid, M. Howard, D. A. Brooks, R. D. Hetland, and R. D.Martin. Observing and forecasting coastal currents: Texas AutomatedBuoy System (TABS). OCEANS 2001 MTS/IEEE Proceedings, 13181322, Marine Technology Society, Washington DC, 2001.[3] Martin, R. A., N. L. Guinasso, Jr., L. L. Lee III, J.N. Walpert, L.C.Bender, R.D. Hetland, S.K. Baum, and M.K. Howard. 2005. Ten yearsof realtime, near-surface current observations supporting oil spillresponse. Proceedings of the 2005 International Oil Spill Conference,American Petroleum Institute, Washington, DC., pp 541-545.[4] Lehr, B., D. Simeck-Beatty, D. Payton, J. Galt, G. Watabayashi, R.D.Martin, and R. Solis. Trajectory Prediction for barge Buffalo 292 spill.Proceedings of the 1997 International Oil Spill Conference, April 7-10,1997, Fort Lauderdale, FL.[5] Bender III, L.C., N.L. Guinasso, Jr., J.N. Walpert, L.L. Lee, III, R.D.Martin, R.D. Hetland, S.K. Baum, M.K. Howard. Development,Operation, and Results From the Texas Automated Buoy System, Gulfof Mexico Science 25(1):33-60, 2007.[6] Ezer, T.H., H.G. Arango, and A.F. Shchepetkin, “Developments interrain-following ocean models: intercomparisons of numerical aspects,”Ocean Modelling, vol. 4, pp. 249-267, 2002.[7] Bender, L.C., N.L. Guinasso Jr., J.N. Walpert, and S.D. Howden, “Acomparison of methods for determining significant wave heights:applied to a 3m discus buoy during hurricane Katrina,” unpublished,2009.[8] Jenkins, G.M. and D.G. Watts, Spectral Analysis and its Applications,Holden-Day Inc. Oakland, Ca, 1968.[9] Lang, N., “The empirical determination of a noise function for NDBCbuoys with strapped-down accelerometers,” Proc. IEEE Conference ofOceans ’87, pp. 225-228, 1987.[10] Steele, K.E., C-C. Teng, and D.W-C. Wang, “Wave directionmeasurements using pitch-roll buoys,” Ocean Engineering, vol. 19(4),pp. 349-375, 1992.
Wind data from National Center for Environmental Prediction (NCEP) Eta-12 wind fields are used to drive the model in nowcast and forecast modes. Hurricanes have affected the buoy system resulting in the loss of several buoys at the deeper offshore locations. The TABS 2.25m buoy was developed in an effort to deploy a buoy that