Transcription
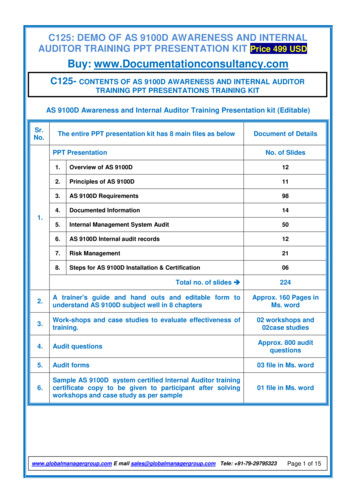
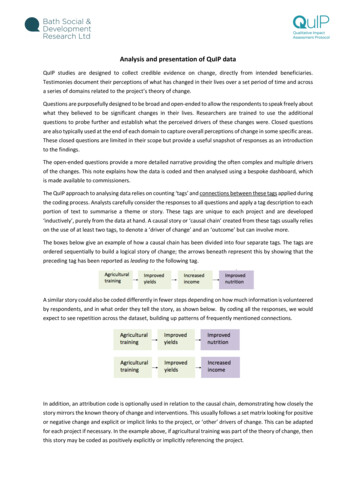
Analysis and presentation of QuIP dataQuIP studies are designed to collect credible evidence on change, directly from intended beneficiaries.Testimonies document their perceptions of what has changed in their lives over a set period of time and acrossa series of domains related to the project’s theory of change.Questions are purposefully designed to be broad and open-ended to allow the respondents to speak freely aboutwhat they believed to be significant changes in their lives. Researchers are trained to use the additionalquestions to probe further and establish what the perceived drivers of these changes were. Closed questionsare also typically used at the end of each domain to capture overall perceptions of change in some specific areas.These closed questions are limited in their scope but provide a useful snapshot of responses as an introductionto the findings.The open-ended questions provide a more detailed narrative providing the often complex and multiple driversof the changes. This note explains how the data is coded and then analysed using a bespoke dashboard, whichis made available to commissioners.The QuIP approach to analysing data relies on counting ‘tags’ and connections between these tags applied duringthe coding process. Analysts carefully consider the responses to all questions and apply a tag description to eachportion of text to summarise a theme or story. These tags are unique to each project and are developed‘inductively’, purely from the data at hand. A causal story or ‘causal chain’ created from these tags usually relieson the use of at least two tags, to denote a ‘driver of change’ and an ‘outcome’ but can involve more.The boxes below give an example of how a causal chain has been divided into four separate tags. The tags areordered sequentially to build a logical story of change; the arrows beneath represent this by showing that thepreceding tag has been reported as leading to the following tag.A similar story could also be coded differently in fewer steps depending on how much information is volunteeredby respondents, and in what order they tell the story, as shown below. By coding all the responses, we wouldexpect to see repetition across the dataset, building up patterns of frequently mentioned connections.In addition, an attribution code is optionally used in relation to the causal chain, demonstrating how closely thestory mirrors the known theory of change and interventions. This usually follows a set matrix looking for positiveor negative change and explicit or implicit links to the project, or ‘other’ drivers of change. This can be adaptedfor each project if necessary. In the example above, if agricultural training was part of the theory of change, thenthis story may be coded as positively explicitly or implicitly referencing the project.
Once the causal chains have been created and assigned an attribution code, QuIP data is processed into aninteractive dashboard (using an analytical software package called MicroStrategy). The MicroStrategy dashboardallows for a wide range of data visualisation and interrogation. An optional narrative report summarising keyfindings can complement this dashboard, but the dashboard itself is made available to commissioners to enablethem to explore the causal connections within the data in more detail. Examples of how the data is presentedwithin a QuIP dashboard follow.As a starting point, the full list of tags used in coding the data can be viewed, showing the number of times thatthey have been used overall. This gives an indication of how frequently particular tags and themes have comeup, both for individuals and FGDs. Both data sources (individual interviews and FGDs) are included within thesame dashboard, however analysis is deliberately kept separate through the use of a filter for interview type.These tag counts can be further filtered by other attributes such as interview characteristics (e.g. location, sex,age) and attribution (positive/negative/neutral, and explicit/implicit/other)Tags can also be clustered into relevant themes according to the theory of change and research questions.Clustering in this way aids the analysis process because it gives the opportunity to filter on specific themes.The ‘raw’ narrative data behind each tag code selected appears in the lower section of the dashboard and helpsto give examples of where the codes have been used.
Whilst tag counts can give an indication of the main stories coming out of the analysis, the focus in QuIP analysisis specifically on the connections between the tags – the causal relationships. The dashboard puts all of theindividual causal chains together in causal maps – allowing the user to select tags or themes to view and explore,with the same filter options as elsewhere. The example below shows an exploration of the causal relationshipsbetween tags within the theme of Health and Nutrition for household questionnaires, with a minimum numberof citations selected on the slider.
The example below shows the causal relationships between two selected tags as drivers of change – exploringthe outcomes related to them.These causal maps can be compared side by side by selecting different respondent characteristic options in thefilters – the example below compares male with female respondents.The dashboard also allows you to view a summary of how attribution codes were used across the interviews andfocus group discussions. Within the dashboard, you are able to filter these attribution codes by theme,characteristics and positive/negative. This helps to provide an overview of positive and negative responses indifferent project areas.
For each closed question asked a simple summary is produced in the dashboard, with two view options available,one focusing on how each individual respondent has answered each question, and the other summarising theoverall number of respondents responding with each answer option.
The dashboard also gives access to reference data, such as all the respondent information, interview schedulesand coded transcript extracts, searchable through various filters. This ensures the transparency of the processand the data and enables users to read through detailed responses by theme or attribution code.A reporting dashboard can be prepared which is bespoke to a project, incorporating pages with summaryfindings and background information. Please ask the Bath SDR team for an example if you would like to seemore – but this will require installation of MicroStrategy. The desktop version of the software is free todownload, and we can provide you with a download link for PCs and Macs.
interactive dashboard (using an analytical software package called MicroStrategy). The MicroStrategy dashboard allows for a wide range of data visualisation and interrogation. An optional narrative report summarising key findings can complement this dashboard, but the dashboard itself is made available to commissioners to enable