Transcription
A Business Intelligence Dashboard Design Approach to ImproveData Analytics and Decision MakingDmytro Orlovskyi, Andrii KoppNational Technical University “KhPI”, Kyrpychova str. 2, Kharkiv, 61002, UkraineAbstractThis paper considers a problem of dashboard design in order to improve data analytics anddecision making as business intelligence capabilities. Essentials of data warehouses and datamarts used as data sources for business intelligence activities are briefly outlined, and the starschema data structure is considered as the most widely used. Data visualization is consideredfrom the perspective of proper visualization graphs and charts selection. It is extremely vitalfor designed dashboards, since inappropriate visuals may mislead users and shift their focusto wrong things. Bar charts, line charts, and pie charts are considered as the most commonvisualization graphs. Proposed approach includes two phases: dataset preparation and datasetanalysis. While dataset preparation is mostly focused on star schema transformation into flatstructures, dataset analysis phase proposes recommendations on which visualizations may beplaced on a designed dashboard. In order to propose such recommendations, threshold valuesof dataset sizes are used. A dashboard design process, which is considered as the baseline ofthe proposed dashboard design approach, is outlined. Sample dataset in considered, five datasubsets are prepared and recommendations on visualization charts for these datasets, whichmay be placed on a dashboard, are proposed. Obtained results are discussed, conclusions aremade, as well as the further research objectives in this field are formulated.Keywords 1Data Analytics, Business Intelligence, Data Visualization, Dashboard, Star Schema.1. IntroductionIn today’s competitive market situation, it is extremely important for small business and largecorporations to have permanent access to analytical reports regarding their business activities. Suchaccess may be granted by modern data analytics and visualization techniques covered in this section.However, it is a challenging problem to design information technologies (IT) in this field. Thus, thepurpose of work is to provide an approach that may help to design IT for data analytics, visualization,and data-driven decision making. Related problems are outlined in following subsections.1.1.Data Analytics and Business Intelligence in Decision MakingThe subject of data analytics domain is the process that includes data collection, organization, preprocessing, transformation, modeling, and interpretation. Data analytics activities are usually dividedinto [1]: Descriptive analytics. Predictive analytics.These two areas naturally are overlapped and interrelated but still serve for the different purposes.However, the descriptive analytics focuses on data summarization or condensation in order to extractIT&I-2020 Information Technology and Interactions, December 02–03, 2020, KNU Taras Shevchenko, Kyiv, UkraineEMAIL: orlovskyi.dm@gmail.com (D. Orlovskyi); kopp93@gmail.com (A. Kopp)ORCID: 0000-0002-8261-2988 (D. Orlovskyi); 0000-0002-3189-5623 (A. Kopp) 2020 Copyright for this paper by its authors.Use permitted under Creative Commons License Attribution 4.0 International (CC BY 4.0).CEUR Workshop Proceedings (CEUR-WS.org)48
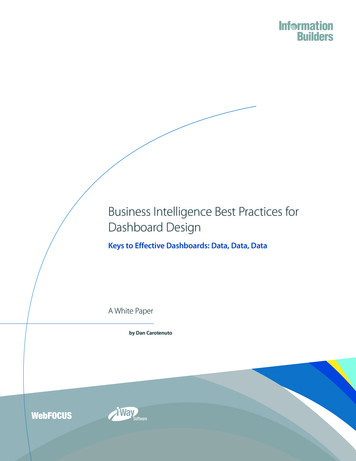
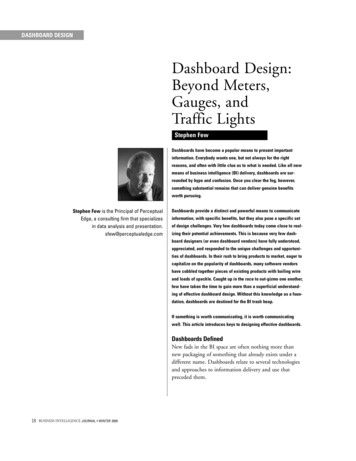
statistics or data patterns, while the predictive analytics is about extraction of models from data inorder to be used for future predictions [1].On practical business issues data analytics is used together with data warehousing to supportdecision making using management information systems usually called Business Intelligence (BI)systems. BI is an umbrella term, which covers reports, scorecards, dashboards, notification alerts, predefined user-specified queries, ad hoc queries, multidimensional analyses, statistical analyses,prediction, and simulation models. All of these are BI capabilities that help business users to makevital business decisions in order to reduce costs, increase revenues, etc. [2].Data warehouses are specialized databases used to store records about transactions, products,customers, performance metrics, financial results, etc. Such business information is collected overmultiple years in order to be used for analytical purposes. Data analytics methods and models use datavolumes stored in data warehouses to provide statistical analysis, predictions, and simulation resultsto stakeholders (business users that require such data insights) [2].Core Business Intelligence capabilities are: Data extraction. Data storage. Data visualization.These capabilities are supported by the respective information technologies: Extract-Transform-Load (ETL) pipelines. Data Warehouses (DW) and Data Marts (DM). Reports and dashboards.ETL technologies are used for data receiving from one or multiple source data stores (Extractphase), transforming (cleansing, aggregation, summarization, concatenation, etc.) of data (Transformphase), and storing data in a target source (Load phase). All the required data processing operationsare specified in ETL scripts. In Business Intelligence systems production databases usually act as thesource data stores, while DW and DM serve as the target data stores [3].A general use-case of ETL scripts in a BI data pipeline is demonstrated in Figure 1.Figure 1: ETL scripts general use-caseDW and DM used as the target data sources are traditionally built using relational or wide-column(or combined) database management systems. The difference between data warehouses and datamarts is that DM are usually focused on limited domains (i.e. subject areas) but also are having adimensional data model design, which is also used in DW. Data marts may belong to organizationaldepartments and are associated only with concrete activities of organizational units (e.g., “Sales”,“Marketing”, “Procurement”, etc.) [4].In fact, data marts depend on data warehouses, since in most business information systems DMtend to acquire their information from the general enterprise DW [4]. The (multi-) dimensional datamodel design, which is typical for DM and DW, is achieved through the appliance of following datastructures optimized for data warehousing needs: Star schema. Snowflake schema.49
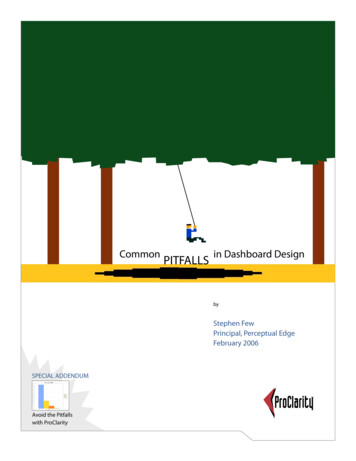
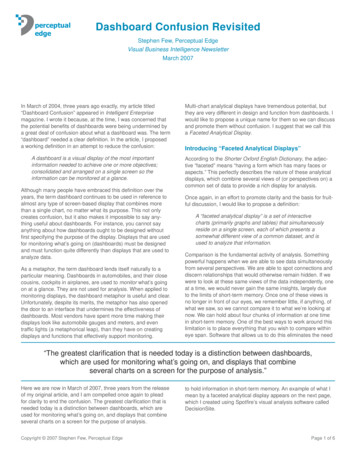
These schemas address needs of very large databases designed for analytical purposes. On practicedimensional modeling includes five steps [5]: Identify a business process (a sequence of activities that produces data records, e.g. orderplacement, sale processing, delivery processing, etc.). Identify a level of detail. Identify dimensions. Identify facts. Build a schema.In general a schema is the logical description (some sort of a blueprint) of a database. Databaseschemas define how data entities are organized (which attributes they contain) and how the relationsamong these entities are associated. Dimension tables in data warehouses are collections of referenceinformation about events, which are known as facts. Fact tables consist of dimension foreign keyslinked to dimension tables and measures, which represent some numeric facts [6].The star schema is simplest but extensively used nowadays data warehouse schema. According tothe star schema, the fact table is at the center and the dimension tables are nodes of the “star” [6].Sample star schema DW design is shown in Figure 2.Figure 2: Sample star schema data warehouse designSince the star schema data warehouse model is one of the simplest but, on the other hand, is themost widely used data structure in BI domain, in this paper will be considered exactly this kind ofstorages.Data loaded into DW may be prepared and used for descriptive (statistical) and predictive (modelbuilding) analytics. However, nowadays managers and other business users require dashboards thatreflect status of their activities in the form of measures that demonstrate a progress towards predefined goals [7]. Dashboards are used at the top presentation layer of the whole BI architecture [8].Dashboards allow business users to visualize data by combining a plethora of charts, graphs, andother data visualization widgets together. Advanced BI tools allow users to visualize results of variousmachine learning models (classification, clustering, regression, etc.) in an interactive graphical userfriendly interface. There are BI solutions such as Tableau, QlikView, Microsoft Power BI, and others,which are extremely efficient in data discovery and visualization. There are also open source datavisualization components D3.js and Kibana, which are extremely popular on market [9].1.2.Data Visualization and Business Intelligence DashboardsAccording to Stephen Few, a leader in the field of data visualization, the following dashboardsdesign principles are [10]:50
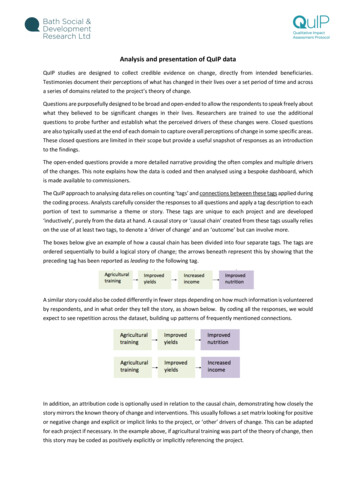
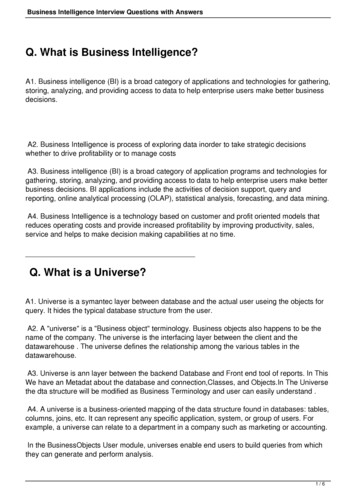
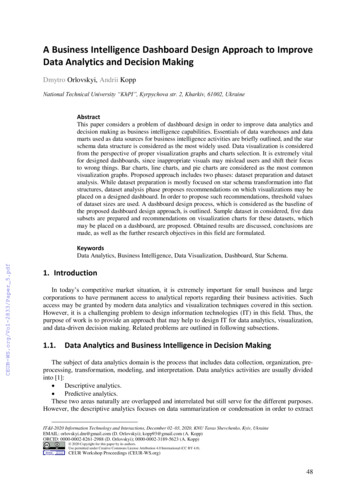
Used visualization charts should fit the best nature of data included in data sets displayed on adashboard. Used visualization charts should serve their purposes even in case if they are resized in orderto be placed into small spaces on a dashboard.Also, according to [10], dashboard design flaws are related to inappropriate data visualizationcharts and graphs chosen to be placed on dashboards.The most appropriate visualizations, which are highly informative and best suitable for human-eyeperceptions, according to Lisa Pappas and Lisa Whitman [11] are bar charts and line charts. On theother hand, less efficient visuals are dials or speedometers [11]. However, dials are widely used ondashboards probably because of the dashboard concept is originated from vehicles, such as planes andautomobiles.According to Zach Gemignani et al. [12], visualization charts are building blocks used to constructdashboards. Choosing wrong visualizations may mislead dashboard audience into focusing on thewrong things. When selecting charts, it is required to understand the purpose of a chart, which isactually making it easy for users to identify patterns and compare values to each other [12].Since people judge values accurately on two-dimensional plane, bar charts, line charts, and piecharts are the best visualizations. The ability to analyze data declines when graphs use other visualfeatures, such as size, color, radial distance, etc. Hence, pie charts are considered as less effective thanbar charts and line charts because of the requirement to compare radial distances and areas [12]. Someexamples of the most efficient visualization charts in different forms (e.g. horizontal and vertical barcharts, pie and donut charts, etc.) are demonstrated in Figure 3 [13].Figure 3: Some example of the most efficient visualization chartsIn [14] it is also mentioned that common graphs and charts are: Bar charts. Show comparison at different times, locations, and conditions. Line charts. Display trends over time in amounts, sizes, rates, etc. Pie charts. Show what parts make up a whole in order to compare relative sizes of these parts.Dashboard visualizations should be used to display relationships between different numbersbetween different numbers within dataset [15]. Hence, visualizations, which are attractive by sight(e.g. radial bar charts, polar area charts, radial histograms, chord diagrams, three-dimensional graphs,contour plots, heat maps, etc.), may be completely inefficient for data analytics. According to RussellCarter et al. [15], bar charts efficiently demonstrate differences in quantities between groups, linecharts are great for illustrating change across time, and pie charts show proportions well. Also in [15]is declared that visualization graphs should be as simple and as clear as possible, labels should belarge enough to read, and texts should be kept to minimum. Usage of line, pie, and bar charts is alsomentioned in the Essentials of Business Communication book [16]. It says that visualization should51
be easy to understand, there should not be unnecessary details or too much text that my overload theaudience.1.3.Problem StatementThe dashboard design problem includes selection of visualizations, such as graphs and charts,which should be placed in a limited space. If choose inappropriate visualization charts that do not fitnature of data presented in datasets prepared for visualization, developed BI dashboard applicationsmay mislead business users and shift their focus and attention to unimportant or wrong things. Thus,dashboard design problem is extremely relevant nowadays when big data volumes processing andanalysis is vital for making business decisions. Since the problem is not trivial and complex enough, itis required to propose a BI dashboard design approach.2. MethodsProposed approach is based on the relational algebra methods used to process DM and DW datastructures in order to prepare datasets for analysis and suggest appropriate visualizations that shouldbe placed on dashboards. The dashboard design process, which is underlying for a proposed approach,includes steps related to dataset preparation and dataset analysis that lead to recommendations ondashboard visualizations.2.1.Dataset PreparationThis step is based on the relational algebra methods that operate functional dependencies and otherassociated dependencies (partial, transitive, etc.). Therefore, in star schema data warehouses onlydimensions are de-normalized [6] (there might be transitive dependencies presented, when thedeterminant is not part of the primary key, e.g. in the sample data warehouse model there is thetransitive dependency 𝑆𝑡𝑜𝑟𝑒 𝐼𝑑 𝑆𝑡𝑜𝑟𝑒 𝐶𝑖𝑡𝑦 𝑆𝑡𝑜𝑟𝑒 𝑅𝑒𝑔𝑖𝑜𝑛), while fact tables are in 3NF.It means that business measures in the fact relation (table) depend on the primary key attributes(columns) derived from dimension relations (tables) as foreign keys:{𝐷𝑖𝑃𝐾 𝑖 ̅̅̅̅̅1, 𝑛} {𝑀𝑗 𝑗 ̅̅̅̅̅̅1, 𝑚},(1)𝐷𝑃𝐾𝑖whereis the 𝑖-th primary key attribute of the fact table derived as the foreign key from the 𝑖-thdimension table, 𝑛 is the number of primary key attributes in the fact table and, at the same time, thenumber of dimension tables respectively, 𝑀𝑗 is the 𝑗-th measure of the fact table, and 𝑚 is the numberof measures in the fact table.Then each dimension table may contain possibly de-normalized dependencies described as:𝐷𝑖𝑃𝐾 {𝐷𝑖𝑘 𝑘 ̅̅̅̅̅1, 𝑞𝑖 },(2)𝐷𝑘𝑖whereis the 𝑘-th attribute of the 𝑖-th dimension table, and 𝑞𝑖 is the number of attributes in the 𝑖-thdimension table.Composition of the associated dimension attributes (2) and measures (1) into the flat structure maybe done using the join operation of the relational algebra, ensuring inclusion into the result set only̅̅̅̅those tuples, which primary keys 𝐷𝑃𝐾𝑖 , 𝑖 1, 𝑛 are equal:𝑘̅̅̅̅̅{𝑀𝑗 𝑗 ̅̅̅̅̅̅1, 𝑚} 𝐷𝑃𝐾 ,𝑖 1,𝑛̅̅̅̅̅ {𝐷𝑖 𝑘 1, 𝑞𝑖 },𝑖(3)where is the notation of join operation.Hence, the result data set may be described with the following superset of attributes, which aremeasures and dimension attributes:{𝑀𝑗 𝑗 ̅̅̅̅̅̅1, 𝑚} {𝐷𝑖𝑘 𝑘 ̅̅̅̅̅1, 𝑞𝑖 }.(4)̅̅̅̅̅𝑖 1,𝑛The example of such flat structure (3, 4), which is based on the demonstrated sample star schemadata warehouse (Figure 2) is shown in Figure 4.52
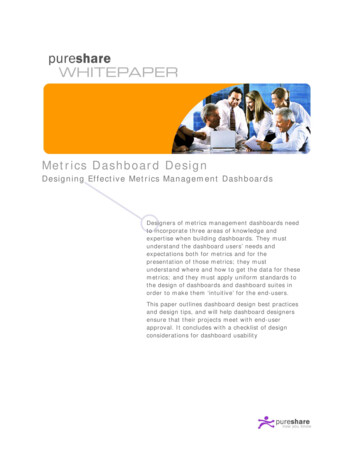
Figure 4: Sample flat structure derived from a star schemaIn order to prepare the obtained dataset for visualization, selection and projection operationsshould be done. In fact, on practice all the data preparations may be done using SQL (StructuredQuery Language). SQL can be used for data analysis such as filtering, sorting, and joining. SQL alsoprovides functions (e.g. aggregation functions MIN, MAX, SUM, COUNT, and AVG; pivoting, nullprocessing, and ranking functions, etc.) to respond complex analysis requests with all elegance andperformance of this language [7].2.2.Dataset AnalysisObtained flat data structures are extremely convenient for data selection and projection operationseven though these structures are de-normalized and contain redundant data. As it was mentioned in aprevious subsection, on practice these relational operations are performed using the SQL languageand its analytical capabilities. Each of SQL queries forms a subset of the general dataset extractedfrom the DM or DW. Subsets returned by SQL queries should be used as datasets for visualizationusing charts and graphs on BI dashboards (Figure 5).Figure 5: Generic data pipeline for the proposed approach53
As it is shown in Figure 4 above, each dataset obtained as the result of corresponding SQL queryshould be analyzed in order to define which data visualization graph or chart should be placed on adashboard.First of all, the set of attributes included in the result set of any SQL query may contain of twosubsets of attributes:𝑋 {𝐷𝑖𝑘 𝑘 ̅̅̅̅̅1, 𝑞𝑖 } 𝑌 {𝑀𝑗 𝑗 ̅̅̅̅̅̅1, 𝑚},(5)̅̅̅̅̅𝑖 1,𝑛where 𝑋 is the subset of attributes that may be placed on the x-axis, and 𝑌 is the subset of attributesthat may be placed on the y-axis.Obviously, there may be multiple attributes included in subsets 𝑋 and 𝑌 (5). Most of the modernBI suites allow data analysts to create charts with primary and secondary y-axes, hierarchical x-axes,and drill down (navigation to detailed data hierarchy layers in order to discover more granular data)features. For example, let us consider the sample dataset of five attributes related to sales: Cost of sold products (measure). Number of sold products (measure). Year (dimension’s attribute). Quarter number (dimension’s attribute). Month number (dimension’s attribute).Thus, considered attributes could be mapped to the line and column chart. Such data visualizationexample was made using Microsoft Power BI is shown in Figure 6.Figure 6: Example of dataset mapping to the visual chart axesSelection of proper visualization graphs and charts is the main problem, which must be solved inthe BI dashboards development. In order to analyze datasets (returned by SQL queries) and suggestvisualization, the following function is proposed: 𝐷𝑆 1,𝐶𝑎𝑟𝑑2 𝐷𝑆 𝑡1 ���𝑖𝑜𝑛(𝐷𝑆) {,𝑡1 1 𝐷𝑆 𝑡2 , 𝐵𝑎𝑟 𝐷𝑆 𝑡2 ,𝐿𝑖𝑛𝑒(6)where 𝐷𝑆 is the analyzed dataset produced by an SQL query and which is required to be placed on adashboard using a certain graph or chart, 𝑡1 is the upper threshold of the dataset size 𝐷𝑆 that issuitable for a pie chart visualization, and 𝑡2 is the upper threshold of the dataset size 𝐷𝑆 thatis suitable for a bar chart visualization.Proposed in (6) bar charts, line charts, and pie charts are considered as the most suitable for datavisualization and human perception, which were already mentioned in subsection 1.2 [11–16]. Whiletext cards may be used to display single-value measures, such as any generalized measures, ratios, orother possible scalar values.54
Sample thresholds, which may be used on practice, are demonstrated in Table 1. These thresholdswere recommended by different studies in the field of data analytics and visualization [14, 17–21].Table 1Dataset size thresholds suitable for different visualizationsSource[14, p. 107][17, p. 68][18, p. 281]Pie chart threshold, 𝑡1645Source[19][20][21]Bar chart threshold, 𝑡210 – 121215These limitations (Table 1) of pie charts and bar charts are caused by their usage as comparativetools, while line charts are used to display trends over time. It was hard to find recommendations onthresholds, we have found them mentioned by: Telg and Irani in [14], Evergreen in [17], and Stirrupet al. in [18] for pie charts; Choudhury in [19], Inforgram team in [20], and Gulbis in [21].2.3.Dashboard Design ProcessProposed dashboard design process basically includes the steps related to dataset preparation anddataset analysis, described in subsections 2.1 and 2.2 above. This process generalizes all the tasksrequired to prepare DM or DW measures and dimensions for visualization. At first, it is necessary totransform a star schema structure into a flat dataset. This may be done using the SQL language joinoperators. Then, it is required to prepare subsets of the general flat dataset. Prepared subsets will beused as data sources for future visualizations (graphs and charts) that should be then placed on adashboard. As well as the flat generic dataset, these subsets may be also prepared using the SQLlanguage and its powerful selection and projection capabilities, and analytical functions. After that,thresholds for pie charts and bar charts should be selected among the recommended values (Table 1).When all the previous steps are completed, recommendations regarding the visualization charts andgraphs, which should be used to display on a dashboard prepared data subsets, may be obtained. Withrespect to the obtained recommendations, the content of a designed dashboard may be created by dataanalysts or other stakeholders. The dashboard design process diagram is shown in Figure 7.Figure 7: Dashboard design process diagram55
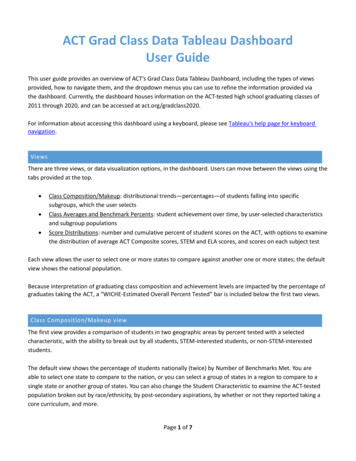
Described dashboard design process allows users to choose appropriate visualization charts andgraphs. Example of this process usage is outlined in the next section.3. Results and DiscussionAs the example we have used the test dataset with randomly generated records. This dataset issupposed to describe sales facts between 2009 and 2020 years. There are two measures: “Items Sold” (a number of sold product items). “Items Cost” (revenue of sales).And also there are four dimension attributes: “Date”. “Year”. “Quarter”. “Month”.In order to simplify the demonstrated example and focus only on the recommendations suggestionfor the visualization charts to be used, let us consider already prepared flat dataset of the columnsmentioned above.Now it is required to prepare subsets of the general dataset using SQL queries. There are five datasubsets, which are necessary to be visualized using a dashboard: Average revenue by quarter (Appendix 1). Lowest sales and highest sales by month (Appendix 2). Revenue by date (Appendix 3). Average revenue per item (Appendix 4). Average revenue per quarter (Appendix 5).Datasets returned by these SQL queries (Figure 8–12) are supposed to be visualized using thedifferent graphs and charts on a dashboard. It is required to define thresholds for data visualizations.In fact, there are 12 possible combinations of 𝑡1 and 𝑡2 thresholds: {4,5,6} {10,11,12,15} 12.After we have applied the function (6) proposed in subsection 2.2 to each of considered datasets,by using all the possible pairs of 𝑡1 and 𝑡2 threshold values, we have obtained the following resultsoutlined in Table 2.Table 2Recommended visualizations obtained for each of considered datasets𝐷𝑆12345𝑡1𝑡2 𝐷𝑆1 4 𝐷𝑆2 12 𝐷𝑆3 481 𝐷𝑆4 1 𝐷𝑆5 e B stands for a bar chart, C stands for a card, L stands for a line chart, and P stands for a piechart. Considered datasets (Table 2) are of different sizes, from large enough ( 𝐷𝑆3 481) to scalarvalues ( 𝐷𝑆4 1 and 𝐷𝑆5 1).Because of various dataset volumes, there were obtained recommendations regarding variousvisualizations to be placed on a dashboard. Actually there are only two distinct combinations of theproposed visualizations: PLLCC and PBLCC. The first one includes the following charts: Average revenue by quarter – a pie chart.56
Lowest sales and highest sales by month – a line chart.Revenue by date – a line chart.Average revenue per item – a card.Average revenue per quarter – a card.Sample dashboard design for the first combination of visualizations is shown in Figure 13. Thedonut chart is used instead of plain pie chart, since it is more visually attractive.Figure 8: Sample dashboard design for the first recommended set of visuals (PLLCC)The second set of recommended charts includes the following visualizations: Average revenue by quarter – a pie chart. Lowest sales and highest sales by month – a bar chart. Revenue by date – a line chart. Average revenue per item – a card. Average revenue per quarter – a card.Sample dashboard design for the first combination of visualizations is shown in Figure 14.Obtained dashboard design alternatives may be chosen by analysts for further usage or as theproofs of concepts for demonstration to business users (managers, directors, and other stakeholders)for their further approval. These alternatives could be quantitatively evaluated using visuals rankingproposed in [22]. Dashboard design variants 𝑉𝑎𝑟1 and 𝑉𝑎𝑟2 could be evaluated as following:𝑣𝑉𝑎𝑟𝑖 (𝑗 1𝑤𝑗𝑑𝑗 𝑥 ) , 𝑖 ̅̅̅̅1,2,max 𝑤𝑘 max 𝑑𝑘 𝑗̅̅̅̅𝑘 1,𝑣(7)̅̅̅̅𝑘 1,𝑣where 𝑥𝑗 is the number of visuals of 𝑗-th graph type placed on the dashboard under evaluation, 𝑤𝑗 isthe prevalence of 𝑗-th graph type [22], 𝑑𝑗 is the degree to which 𝑗-th graph type helps glean insightsand make decisions [22], and 𝑣 is the number of visuals.According to the evaluation results, second alternative design (𝑉𝑎𝑟2 1.94) is more preferablethan the first one (𝑉𝑎𝑟1 1.54), since bar charts are better suited for relatively small datasets of 10 –15 categories ( 𝐷𝑆2 12) than line charts (see Table 1).However, this approach should be complemented with the possibility of suggestions elaborationregarding places of visualization charts on a dashboard. In order to propose places of visualizations, itis required to define relative sizes of each chart, which may be based on corresponding dataset sizes.57
Figure 9: Sample dashboard design for the second recommended set of visuals (PBLCC)4. ConclusionIn this study we have discussed the dashboard design problem, which is extremely important indata analytics and decision making areas. In order to prevent misleading of business users, managers,and remaining stakeholders by inappropriately designed dashboards, which may contain unsuitablevisualization charts and graphs that do not fit to considered datasets, we have proposed the dashboarddesign approach. This approach is based on data mart or data warehouse transformation from the starschema, extremely popular and quite simple data structure, into the flat dataset, suitable for selectionand projection operations that should be used to produce data subsets. These data subsets then may beused as data sources for visualizations on dashboards, which are usually bar charts for comparisons,line charts for trends over time, pie charts for parts of a whole, and cards for scalar values. It is vital toselect appropriate visualization among the considered, which is why we have proposed the function,which maps data subsets to kinds of visuals and helps to elaborate recommendations for dashboarddesign. Considered example demonstrates sample dataset, derived subsets of records, and proposedvisual charts for their demonstration on a dashboard. Future research in this field includes softwareimplementation of the proposed approach, as well as the research of relative sizes and placement ofvisualization graphs and charts on a dashboard’s space.5. References[1] J. Moreira, A. Carvalho, T. Horvath, A General Introduction to Data Analytics, John Wiley &Sons, 2018.[2] S. Williams, Business Intelligence Strategy and Big Data Analytics: A General ManagementPerspective, Morgan Kaufmann, 2016.[3] R. van der Lans, Data Virtualization for Business Intelligence Systems: Revolutionizing DataIntegration for Data Warehouses, Elsevier, 2012.[4] R. Hughes, Agile Data Warehousing for the Enterprise: A Guide for Solution Architects andProject Leaders, Newnes, 2015.[5] A. Nordeen, Learn Data Warehousing in 24 Hours, Guru99, 2020.[6] P. Bhatia, Data Mining and Data Warehousing: Principles and Practical Techniques, CambridgeUniversity Press, 2019.58
[7] R. Ghlala, Analytic SQL in SQL Server 2014/2016, John Wiley & Sons, 2019.[8] A. M. Maquera, Business Intelligence – First Steps, 2020. URL: -primeros-pasos-3a17fc0a0c46.[9] P. Ghavami, Big Data Analytics Methods: Analytics Techniques in Data Mining, Deep Learningand Natural Language Processing, Walter de Gruyter GmbH & Co KG, 2019.[10] S. Few, Information Dashboard Design: Displaying Data for At-a-glance Monitoring, AnalyticsPress, 2013.[11] L. Pappas and L. Whitman. "Riding the technology wave: Effective dashboard datavisualization." Human Interface and the Management of Information, 2011, pp. 249–258. doi:10.1007/978-3-642-21793-7 29.[12] Z. Gemignani, C. Gemignani, R. Galentino, P. Schuermann, Data Fluency: Empowering YourOrganization with Effective Data Communication, John Wiley & Sons, 2014.[13] Data Viz Project – Collection of data visualizations to get inspired and finding the right type.URL: https://datavizproject.com/.[14] R. Telg, T. A. Irani, Agricultural Communications in Action: A Hands-On Approach, CengageLearning, 2011.[15] R. Carter, J. Lubinsky, E. Domholdt, Rehabilitation Research – E-Book: Principles andApplications, Elsevier Health Sciences, 2013.[16] M. E. Guffey, D. Loewy, Essentials of Business Communication, Cengage Learning, 2012.[17] S. Evergreen, Effective Data Visualization: The Right Chart for the Right Data, SAGEPublications, 2019.[18] J. Stirrup, A. Nandeshwar, A. Ohmann, M. Floyd, Tableau: Creating Interactive DataVisualizations, Packt Publishing Ltd, 2016.[19] S. Choudhury, Choosing the right chart type: Bar charts vs Column charts, 2013. r-column-charts/.[20] .URL:https://infogram.com/create/column-chart.[21] J. Gulbis, Data Visualization – How to Pick the Right Chart Type?, 2016. URL:https://eazybi.com/blog/data visualization and chart types.[22] W. Eckerson, M. Hammond, Visual Reporting and Analysis: Seeing Is Knowing, TDWI, 2011.6. AppendixAppendix 1. SQL query for the “Average revenue by quarter” datasetAppendix 2. : SQL query for the “Lowest sales and highest sales by month” datasetAppendix 3. SQL query for the “Revenue by date” datasetAppendix 4. SQL query for the “Average revenue per item” datasetAppendix 5. SQL query for the “Average revenue per quarter” dataset59
dashboard. Used visualization charts should serve their purposes even in case if they are resized in order to be placed into small spaces on a dashboard. Also, according to [10], dashboard design flaws are related to inappropriate data visualiza