Transcription
0Monitoring PlatformUser’s GuideFor System OwnersVersion 2.1Managing an Alternative Power Source with a Power Plant Controller MAN-01-00xxx
1DisclaimersImportant NoticeCopyright SolarEdge Inc. All rights reserved.No part of this document may be reproduced, stored in a retrieval system or transmitted, in any form or by any means, electronic,mechanical, photographic, magnetic or otherwise, without the prior written permission of SolarEdge Inc.The material furnished in this document is believed to be accurate and reliable. However, SolarEdge assumes no responsibility forthe use of this material. SolarEdge reserves the right to make changes to the material at any time and without notice. You may referto the SolarEdge web site (www.solaredge.com) for the most updated version.All company and brand products and service names are trademarks or registered trademarks of their respective holders.Patent marking notice: see http://www.solaredge.com/patentThe general terms and conditions of delivery of SolarEdge shall apply.The content of these documents is continually reviewed and amended, where necessary. However, discrepancies cannot beexcluded. No guarantee is made for the completeness of these documents.The images contained in this document are for illustrative purposes only and may vary depending on product models.Monitoring Platform User’s Guide for System Owners
2Emission ComplianceThis equipment has been tested and found to comply with the limits applied by the local regulations.These limits are designed to provide reasonable protection against harmful interference in a residential installation. This equipmentgenerates, uses and can radiate radio frequency energy and, if not installed and used in accordance with the instructions, may causeharmful interference to radio communications. However, there is no guarantee that interference will not occur in a particularinstallation. If this equipment does cause harmful interference to radio or television reception, which can be determined by turningthe equipment off and on, you are encouraged to try to correct the interference by one or more of the following measures:Reorient or relocate the receiving antenna.Increase the separation between the equipment and the receiver.Connect the equipment into an outlet on a circuit different from that to which the receiver is connected.Consult the dealer or an experienced radio/TV technician for help.Changes or modifications not expressly approved by the party responsible for compliance may void the user’s authority to operatethe equipment.Monitoring Platform User’s Guide for System Owners
3Version HistoryVersion 2.1, August 2020 – added layout chapterVersion 2.0, March 2020 – updated user interface screenshotsVersion 1.0, November 2019 – first releaseContentsDisclaimers . 1Version History . 3Contents . 3Introducing the SolarEdge Monitoring Platform . 4Using the SolarEdge Monitoring Platform . 4Home Page. 7Site Dashboard . 8Layout . 14Support Contact Information . 23Monitoring Platform User’s Guide for System Owners
4Introducing the SolarEdge Monitoring PlatformThe SolarEdge monitoring platform enables monitoring the technical and financial performance of one or more Photovoltaic siteswith SolarEdge equipment. It provides accurate information about present and past performance of each module individually andabout the system as a whole, enabling users to detect, pinpoint and troubleshoot faults, efficiently manage maintenance operationsand analyze site profitability.Smart algorithms continuously track the power, voltage, and current of all modules and inverters, as well as a range of statisticaland meteorological indicators to detect performance events that require intervention or maintenance.These features enable installers and system owners to verify site functionality and monitor its performance.Using the SolarEdge Monitoring PlatformGetting StartedTo use the SolarEdge monitoring platform, your system installer will create and register your system and then add you as thesystem owner.Once the installer initiates your registration, you will receive an invitation e-mail with a link to a form to fill in.To activate your account:1.Click the link sent to you in the invitation email message. The registration form is displayed:Figure 1: Registration Form2.Enter your details and select the required check-boxes.3.Click Save to complete the registration and get access to your solar system.4.When the "Thank You" page appears (Figure 2), click Log in to the Monitoring platform. The Login window is displayed (Figure3).Monitoring Platform User’s Guide for System Owners
5Figure 2: Thank You PageTo launch the SolarEdge monitoring platform:1.Do one of the following:Go to https://monitoring.solaredge.com.From the SolarEdge website, click the Monitoring Platform Login link at the top of the screen.The Login window is displayed.Figure 3: Login Window2.Enter your e-mail and password (as filled in the registration form) and click Login.If more than one site is assigned to you, the list of your SolarEdge sites appears in the Site List on the Home Page.If only one site is available, the site’s Dashboard is automatically displayed, without going through the Site List.Monitoring Platform User’s Guide for System Owners
6User SettingsTo set user preferences:1.Click the dropdown arrow next to your username and select User Settings. The User Settings window is displayed.Figure 4: User Settings Window2.Set the following: First Name Last Name Email Phone number Zip Code Address Change password – Click and modify if necessary System Units: Metric or Imperial Language: Select the language in which the monitoring platform will display. When you change the language, thelocalized data changes automatically, including numbers, currency and date formats.3.Click Save.Monitoring Platform User’s Guide for System Owners
7Home PageThe home page lists all the installed sites that you have permission to view. It provides an overall view of the various sites managedby the monitoring platform.If you only have access to one site, the site’s Dashboard is automatically displayed, without going through the home page. If yourequire access to additional sites, contact your installer.Figure 5: Home PageTo use the home page:1.2.Click Home at the top right toolbar. The site list is displayed containing the following information about each site:ColumnDescriptionSite NameA link to more information about a site. Click the site name to display the site dashboard.AddressInformation on a site’s physical location.Peak PowerSpecifies the total DC power ratings of all the modules.Do the following as required:To control which columns appear, click Choose Columns to open a dropdown list, and check the boxes for the columnsyou wish to display.Monitoring Platform User’s Guide for System Owners
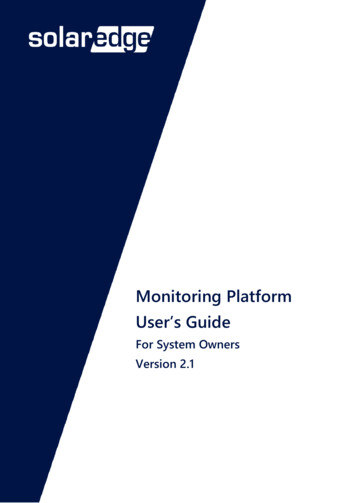
8Figure 6: Displaying ColumnsTo sort the site list by the values in any column, click on the column’s title. This toggles the order from ascending todescending and vice versa. Alternatively, click the column's dropdown arrow and select either Sort Ascending or SortDescending.Use the navigation bar above the list to navigate through the pages and refresh site information.Search for a specific site using the search box. The search text is remembered even if the browser is closed andre-opened.Site DashboardThe Dashboard provides a high-level view of the information collected by the monitoring platform for a specific site.To access a site's dashboard, simply click on the site name in the home page site list. If you only have access to one site, the site’sDashboard is automatically displayed.Monitoring Platform User’s Guide for System Owners
9NavigationbarSite selectionmenuSiteoverviewPower flowSite detailsWeather dataPower ure 7: Site DashboardMonitoring Platform User’s Guide for System Owners
10How to read the site dashboardSite overviewThe site overview area shows accumulated energy and revenue for the site. Each box specifies a value and its measurement unit.The revenue is calculated by multiplying the site-specific feed-in tariff per kWh by the actual energy produced. The revenue isdisplayed in the currency predefined by the user.Figure 8: Site OverviewPower flow diagramThe Power Flow diagram shows real-time system behavior – from solar production to site consumption, and grid import or export.For systems equipped with StorEdge, the battery charge / discharge status and state of energy will also be shown.Figure 9: Power Flow DiagramPower and energyIf a consumption meter is installed, a consumption bar is displayed*. The consumption reading represents your solar energyconsumption:System production – the bar represents the solar energy produced in terms of self-consumption and export. The selfconsumption percentage represents the amount of solar energy that used to power site loads, while the export percentagerepresents the amount of solar energy that was exported to the grid.Consumption – the bar represents the total energy consumed in terms of self-consumption and import. The selfconsumption percentage represents the amount of energy consumed from solar energy, while the import percentagerepresents the amount of energy consumed from the grid.Figure 10: Consumption BarIf a meter is not installed in the site, contact your installer to install a consumption meter in order to gain access to consumptionand self-consumption data.*Monitoring Platform User’s Guide for System Owners
11The power and energy chart is found directly below the consumption bar (when it appears). The chart shows the power productionof this site over a specified period. The default period is the billing cycle.The X-axis represents time and the Y-axis represents the power produced in kW (when in Day or Week view), or the energyproduced in kWh (when in Month, Billing Cycle, or Year view). Use the tabs above the graph to select the desired view.Power level is a function of variable factors, such as the irradiance level and ambient temperature. Therefore, the power-curvetypically rises and falls each day.If there is a data connection between a production meter and your SolarEdge system, then the production data displayed here istaken from the meter's readings. If not, the data is taken from your site inverter or module production readings.Figure 11: Weekly Power and Energy Chart ViewHow to read the power and energy chartThe solar production shown in green represents the power or energy produced from the sun. The consumption, marked in red,displays the site's loads consumption. In blue, the self-consumption is shown.Monitoring Platform User’s Guide for System Owners
12Comparative energyThe comparative energy chart compares the energy produced at the site during corresponding periods in previous years. You canselect to compare months or quarters of different years, or even entire years’ output.Figure 12: Comparative Energy ChartSite DetailsThe site details box displays general information about the site - status, ID, name, location, date installed, date the information waslast updated, and the site's peak power.If an EV charger or smart energy products are connected in the site, an indication for each one will also be displayed.Figure 13: Site DetailsMonitoring Platform User’s Guide for System Owners
13WeatherThe Weather area shows the current weather conditions together with other details as well as the forecast for the next few days.This information may be helpful when estimating future power production levels.Figure 14: WeatherEnvironmental BenefitsThe environmental benefits area shows the accumulated impact that non-renewable energy producing methods would have had onthe environment had they have been used to produce the amount of energy generated by this site. To learn how the environmentalbenefits are calculated read our dedicated technical note.Figure 15: Environmental BenefitsMonitoring Platform User’s Guide for System Owners
14LayoutOverviewThe layout window shows a schematic outline that represents inverters, their strings and the modules in each string. Near-real-timeperformance data is displayed for these components.To view the layout, select a site and click theicon in the top-left corner of the screen.Use the layout to:View the latest performance of specific components.Compare and analyze the performance of various components, such as modules.Pinpoint the location of alerted components.See how components are connected to each other.The layout offers both physical layout and logical layout views, as follows:Physical layout: Shows a bird’s eye view of the actual placement of each component in the site, including inverters, clusters,strings and modules.Logical layout: Shows a schematic logical view of the components in the site, meaning inverters, clusters, strings, modulesand their electrical connectivity.Physical LayoutThe physical layout schematic shows a layout of the components in the field: inverters, clusters, strings, modules and their physicalarrangement in the site. This layout offers a virtual bird’s eye view of the system’s components and their location, which functions asa usable tool for troubleshooting maintenance problems.Figure 16: Physical LayoutWhen in the physical layout window, click thelayout schematic.button in the toolbar and select logical layout to display the logicalIf a physical layout was not created for the site, the logical layout will be the default view.Monitoring Platform User’s Guide for System Owners
15Elements in the Physical Layout SchematicA sample physical layout schematic is shown in the figure below:Figure 17: Elements in the DiagramFor each system component in the layout diagram (inverters and modules), the following information is displayed:Amount of Energy: Indicates the energy produced by this component and its underlying components in the period chosenabove the diagram.Color Code: In the layout schematic, all the elements of the diagram are color coded according to the amount of energythey have produced in the timeframe specified by the buttons in the toolbar.The color-coding is comparative, that is, a module which has produced the most energy over the selected timeframe isdisplayed in light blue, while a module which has produced less energy is darker.The color-coding is also normalized, so the modules’ color is relative to their full capacity. For example, a 300W module isthe same color as a 400W module, when both produce the same percentage of their full capacity. Normalization is also inaccordance with the number of power optimizers connected to each string.Diagram SizingThe layout diagram can be fitted to your viewing needs:Zoom in/out: Make the diagram smaller or larger. Click the button to zoom in or the - button to zoom out. When usinga mouse, you can also use the wheeling scroll to zoom in or out.Fit to screen: Resizes the display of the diagram to fit in the screenFigure 18: Diagram Sizing OptionsMonitoring Platform User’s Guide for System Owners
16Navigator ToolThe Navigator tool at the top right-hand side of the window indicates the area displayed in the diagram using a red frame. Whenzooming in the layout, the red frame can be dragged to display other areas in the layout.Figure 19: Navigator ToolLogical LayoutThe Logical Layout shows a schematic logical layout of the components in the site: inverters, strings, modules and their electricalconnectivity. This layout displays a logical view of the installation site, showing which modules are connected in each string, whichstrings are connected to each inverter, etc.The following diagram displays the Logical Layout of the installation whose Physical Layout was shown above:Figure 20: Logical LayoutNOTEThe Layout schematic automatically zooms in or out, based on the number of components displayed in the window.When in the Logical Layout window, click thebutton in the toolbar and select Physical Layout to display the PhysicalLayout diagram.Both windows show the inverter with its associated strings and modules.Monitoring Platform User’s Guide for System Owners
17Component TypesComponentDescriptionSite: Represents the site level. Displays the energy produced by the site for the selected period.Inverter: Represents an installed inverter. Displays the energy sum produced by the strings or modulesconnected to it.String: Represents strings of modules. Displays the energy sum produced by the modules comprising thestring.Module: Represents a single module. Displays the energy produced by the module.Monitoring Platform User’s Guide for System Owners
18Component OptionsFor each component in the layout diagram, the following options can be selected by right-clicking the component:Info: Provides a window with details table for the selected component. For more information, see the Component Detailssection.Alerts: Redirect you to the alerts tab and displays all alerts related to the selected component.Choose Charts: Select a chart type to display for this component. This action will redirect you to the Charts tab.Collapse/Expand: Expand or collapse the selected components in the diagram, thus hiding or showing its underlyingcomponent hierarchy.Large-scale site installations may contain thousands of modules. To enable simple site navigation, the SolarEdgemonitoring platform enables the user to expand or collapse each hierarchical group of elements, one at a time. Forexample, expanding the inverter level shows all its connected modules.View Device Screen (only for inverters): View the inverter LCD Display in real-time. For SetApp enabled inverters, the LCDdisplay will present the current inverter status.Figure 21: Component OptionsComponent DetailsFor each component or multiple components in the layout, e.g. inverters and modules, you can display its up-to-date details andperformance data, such as the last power output measured.To view component details:1.Select one or more components of the same type in the diagram (for example, only modules or only inverters). You can useCtrl Click to perform multiple selections. Modules from different strings can be selected, as well as strings from differentinverters. Alternatively, you can use the mouse to draw and drag a selection box around the components whose details youwant to display.2.Right-click the selected components and select Info, or click3.Use the table information for near-real-time comparison of component performance, in order to troubleshoot faults and findtheir root cause, for example, checking which strings are producing less energy and locating the individual modules in thosestrings that may cause this situation.Monitoring Platform User’s Guide for System Ownerson the toolbar
19Inverter DetailsWhen the selected component is of inverter type, inverter-related information is displayed in the window, as shown below.Figure 22: Inverter Details WindowSystem DataThe Inverter Details tab displays by defaultis the System data tab. This tab displayes the most recent readings taken by the inverter,including the date and time they were taken. The following parameters are measured and shown for the inverter:ParameterDescriptionSerial NumberA unique identifier of this component.Name, Manufacturer, andModelIdentifying information assigned to this component.DSP 2 Version,Communication Board (CPU)Version, DSP1 VersionThe firmware versions currently installed on the inverter.Country Name, Country CodeInverter country settings.I RCD [mA]RCD Current, measured in Amps.Inverter StatusCurrent production status of the inverter.Last Isolation Value [KOhm]Inverter isolation value, measured in Kilo-Ohms.P AC [W]Inverter output power / inverter AC power, measured in Watts.Power Limit [%]Inverter output power limit, measured in percentage.V DC [V]Inverter DC voltage, measured in Volts.Active Power [W]Inverter active power, measured in Watts.Apparent Power [VA]Inverter Apparent Power, measured in VA.I AC [A]Inverter output current/inverter input current, measured in Amps.I AC/DC [A]Inverter out DC current, measured in Amps.V ACInverter output voltage / inverter AC voltage, measured in Volts.Monitoring Platform User’s Guide for System Owners
20Running operationsThis tab displays the operations currently being executed remotely on the inverter (e.g. reset, pairing).Device screenThis tab presents the data currently shown on the LCD Display. For SetApp enabled inverters, the LCD display presents the currentinverter status.ErrorsThis tab allows you to view any errors related to the selected inverter.Module detailsWhen the selected component is of module type, module-related information is displayed in the window, as shown below.Figure 23: Module Details WindowMonitoring Platform User’s Guide for System Owners
21System dataThe information window includes a single tab – System data. This tab provides the most recent module readings, including the dateand time they were taken. The following parameters are measured and shown for the selected module:ParameterDescriptionSerial NumberA unique identifier of this component.Name, Manufacturer, and ModelIdentifying information assigned to this component.Current [A]Module output current/inverter input current, measured in Amps.Optimizer Voltage [V]Power optimizer output voltage, measured in Volts.Power [W]Module output power / inverter AC power, measured in Watts.Voltage [V]Module output voltage / inverter AC voltage, measured in Volts.Actions in multiple components details windowWhen selecting multiple components, the following actions can be performed in the details window:a.Enlarge. Fit the details window to the entire screenb.Export to Excel. Save the component details in Excel formatc.Copy to Clipboard. Copy the data as textFigure 24: Details window actionsToolbarThe toolbar of the layout schematic provides options as described in the table below.IconDescriptionSystem components tree: Displays all components in the system according to their level. Click on acomponent to view its location in the layout schematic.Show playback: dynamically visualizes the power production of a site during a selected time fragment(either a day or a week).Timeframe Selection list: Select a timeframe in which to display the energy production by eachcomponent in the layout.Physical / Logical Layout: Displays the Physical or Logical Layout Schematic for the entire site.Selected components remain selected when moving between the different layouts.Hierarchy: Use the Hierarchy button to display the modules connected to each inverter.Show/Hide Preview: Shows or hides the Navigator tool, as described in the Navigator Tool section.Refresh: To refresh the Layout Schematic and Component Detail table, click this icon.Monitoring Platform User’s Guide for System Owners
22PlaybackThe Playback dynamically visualizes the power production of a site during a selected time fragment (either a day or a week).To open the playback viewer click Show Playbackon the window’s toolbar. The playback viewer is displayed.Figure 25: Playback ViewerChoose Normal or Accelerated for the playback speed.Clickto show how the modules’ energy production changes in time, represented by the color code detailed earlier.Drag the slider along the timeline to focus on a chosen time fragment.The resolution of the playback data is 15 minutes.Monitoring Platform User’s Guide for System Owners
23Support Contact InformationIf you have technical problems concerning SolarEdge products, please contact us:https://www.solaredge.com/service/supportBefore contact, make sure to have the following information at hand:Model and serial number of the product in question.The error indicated on the SetApp mobile application, LCD screen, on the monitoring platform, or as displayed by LEDs, ifthere is such an indication.System configuration information, including the type and number of modules connected and the number and length ofstrings.The communication method to the SolarEdge server, if the site is connected.The product's software version as it appears in the ID status screen.Monitoring Platform User’s Guide for System Owners
24Monitoring Platform User’s Guide for System Owners
Site Dashboard The Dashboard provides a high-level view of the information collected by the monitoring platform for a specific site. To access a site's dashboard, simply click on the site name in the home page site list. If you only have access to one site, the site's Dashboard is automatically displayed.