Transcription
May 2013Philadelphia Water DepartmentContamination Warning System Demonstration Pilot Project:Development of User Requirementsand Use Cases for a ContaminationWarning System DashboardOnline tyMonitoringCustomerComplaintSurveillanceAlert Validation& e minationIncidentRemediation& Recovery ofIncidentReturn to Routine OperationsConsequence Management
EPA DisclaimerAlthough the information in this document has been funded wholly or in part by the United StatesEnvironmental Protection Agency under the Water Security Initiative program, it may not necessarilyreflect the views of the agency and no official endorsement should be inferred.When referencing this white paper in another document, please use the following citation:Philadelphia Water Department and CH2M HILL. May 2013. Philadelphia Water DepartmentContamination Warning System Demonstration Pilot Project: Development of User Requirements and Use Casesfor a Contamination Warning System Dashboard. White Paper Submitted to EPA as part of theWater Security Initiative Grant Awarded to Philadelphia Water Department.This paper can also be downloaded from www.ch2mhill.com/iws.ii
AcknowledgmentsThe Philadelphia Water Department would like to recognize the following individuals and organizations for theirassistance and contributions in the development of this document:EPA Water Security Division Steve AllgeierKatie UmbergPhiladelphia Water Department Jerry SkoritowskiReena GeorgeContractor Support Raja Kadiyala, PhD, CH2M HILLAndrew Hu, CritigenChristopher Peluso, CH2M HILLChristopher Wiggins, CH2M HILLYakir Hasit, PhD, PE, CH2M HILLQuestions concerning this document should be addressed to:Geoffrey L. BrockPhiladelphia Water Department1101 Market StreetARAMARK Tower, 3rd FloorPhiladelphia, PA 10107‐2994Phone: 215‐685‐6220E‐mail: Geoffrey.Brock@phila.govGary BurlingamePhiladelphia Water DepartmentBureau of Laboratory Services1500 E Hunting Park AvenuePhiladelphia, PA 19124Phone: 215‐685‐1402E‐mail: Gary.Burlingame@phila.govYakir Hasit, PhD, PECH2M HILL1717 Arch StreetSuite 4400Philadelphia, PA 19103Phone: 215‐640‐9027E‐mail: Yakir.Hasit@ch2m.comiii
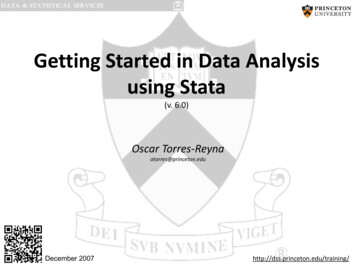
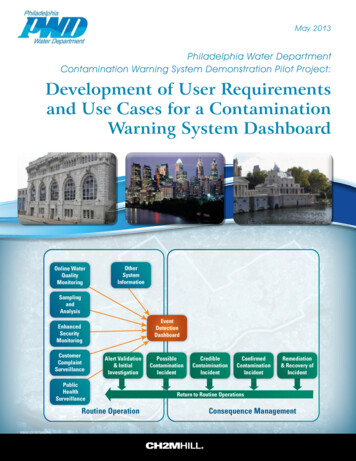
AbstractThe Philadelphia Water Department (PWD) developed a comprehensive contamination warning system (CWS) forits drinking water system under a Water Security (WS) initiative grant from the U.S. Environmental ProtectionAgency (EPA). The integration of multiple information streams is a core element when designing a CWS. PWDenvisioned a web‐based dashboard application to serve as the primary user interface for CWS alerts and anincident management system. The primary objective of system engineering and data integration was to combinethe five surveillance components—online water quality monitoring, consumer complaint surveillance, samplingand analysis, enhanced security monitoring, and public health surveillance—into a centralized platform that canbe used to determine whether a water contamination event has occurred and to facilitate appropriate responseand consequence management actions. To develop the CWS Dashboard, the system engineering team conducteda series of dashboard requirement workshops with CWS component leads and primary CWS users. After each userrequirement workshop, the system engineering team developed a detailed list of user requirements, coordinatedfollow‐up workshops to consolidate and prioritize the requirements, and then turned them over to the softwaredesign and development team to implement the CWS Dashboard.This paper describes the four critical steps taken in the development of user requirements for the CWSDashboard: (1) educate PWD staff on the process development through chartering workshop, (2) conductrequirement definition workshops with key staff from each CWS component, (3) review and prioritize the userrequirements, and (4) develop software design documents.Project BackgroundPWD developed a comprehensive CWS for its drinking water system under a WS initiative grant. The WS initiativeis a program developed by the EPA in partnership with drinking water utilities and other key stakeholders inresponse to Homeland Security Presidential Directive 9. The WS initiative involves designing, deploying, andevaluating a model CWS for drinking water security. A CWS is a systematic approach to collecting informationfrom various sources, including monitoring and surveillance programs, to detect contamination in drinking waterearly enough to reduce public health or economic consequences. The WS initiative goal is to develop watersecurity CWS guidance that can be applied by drinking water utilities nationwide.The project has six major components:1. Online water quality monitoring (OWQM)2. Sampling and analysis (S&A)3. Enhanced security monitoring (ESM)4. Customer complaint surveillance (CCS)5. Public health surveillance (PHS)6. Consequence management (CM)The integration of multiple information streams is a core element in designing a CWS. Taken separately, eachcomponent provides its own set of event triggers that have value for event detection. The primary objective ofsystem engineering and data integration is to combine the five surveillance components into a centralizedplatform that can be used to determine whether a water contamination event has occurred and to facilitateappropriate response and consequence management actions.The CWS Dashboard development process used for the PWD Pilot Project consisted of five steps (Figure 1); thefirst three are described in this white paper: Define business processes. Define user requirements. Define use cases. Design the software. Develop the solution.1
DEVELOPMENT OF USER REQUIREMENTS AND USE CASES FOR A CWS DASHBOARDFIGURE 1Software Development FlowDefinition of Business ProcessesThe CWS Dashboard development process started during operational strategy discussions that defined the corebusiness processes and initial information flow. Using the information flow diagrams, the project team then verifiedthe sources of information for the given component topic of the workshop and detailed the systems of record forthe data (i.e., the application or database housing the data for the component). As shown in Figure 1, documentsprepared during the development process were User Requirements, System Requirements, Mapping Requirements,and Use Cases.This paper focuses on the methods used to define user requirements and use cases for the CWS Dashboard.Development of User RequirementsPWD envisioned a web‐based dashboard application developed to serve as the primary user interface for CWSalerts and an incident management system. To develop the CWS Dashboard, the system engineering teamconducted a series of dashboard requirement workshops with the five component leads and primary CWSDashboard users. After each requirement workshop, the system engineering team developed a detailed list ofrequirements. The team identified whether a particular requirement was relevant only to a single component orcould be applied to all components. These requirements were presented to component leads and users duringfollow‐up workshops for consolidation and prioritization before turning them over to the software design anddevelopment team to implement the CWS Dashboard. The process for developing the user requirements for therequested functionality had four steps:1. Educate PWD staff on the process development through chartering workshops.2. Conduct requirement definition workshops with key staff from each component.3. Review and prioritize user requirements.4. Develop the software design documents.Each step is discussed in detail in the following subsections.2
DEVELOPMENT OF USER REQUIREMENTS AND USE CASES FOR A CWS DASHBOARDChartering WorkshopMany of PWD’s staff had not previously gone through a formal requirements‐gathering process, nor did theycompletely understand their role in the process and the expectations associated with their participation. Thechartering session allowed the system engineering team to educate the participants on the process, define theneed for the process, and provide examples of the outcome from the requirements gathering effort. The followingkey topics were discussed during the chartering workshop: Project objectives—All participants were informed of the overall CWS project, particularly the CWSDashboard application that would be developed for CWS. The scope of work and the timeline necessary tomeet the overall project’s schedule was conveyed. Critical success factors—Critical success factors both for the CWS Dashboard development effort and thebusiness processes/functions served were identified. Questions such as “How will we know that the plannedchanges have been effective?” and “How will success be measured?” were answered. Project deliverables—The deliverables from the effort were identified. Prepare, inform, and educate the workshop participants—Background on the software development effortincluding why it was critical for the stakeholders to get involved in the requirements definition, was provided. Participants—Participants that were needed for a successful workshop were selected. In general, theseincluded business users and staff with domain knowledge and expertise. Workshop schedule—Workshop dates and schedules were coordinated to achieve participation with criticalstaff.Definition of User RequirementsAfter the information sources were identified, the focus turned to individual data elements within therepositories: Users needed to define, in detail, the data fields from each source system necessary to perform variousbusiness processes. Users also were asked to define how they wanted to view and interact with these data.This critical information was used to define user requirements. A template was created to document the followinginformation for each user requirement (Table 1 lists example user requirements for the CCS component): ID – Identifier to be used for requirement tracking Requirement Name – A descriptive requirement name Requirement Description – As much information as necessary to clearly describe the requirement Category – Used to group like requirements into functional groups. Possible categories included the following: Map – Requirement related to map display and availability of data layers, cartography Data – Specific to a data layer or data set (see user requirement 2 in Table 1) Navigation – Map navigation tools and shortcuts Toolbox Functions – For each toolbox, toolbar icons control the functionality provided within the toolbox(see user requirements 4 and 5 in Table 1) Query – Dataset‐specific filtering (see user requirement 3 in Table 1) Reporting – The way that data are to be reported (chart, table, map) Help – Online documentation Printing – Maps, reports, queriesWorkshops with key PWD staff were held to define the component‐specific user requirements. The workshopsallowed free exchange of user requirements that aligned to the business processes automated by the application.3
DEVELOPMENT OF USER REQUIREMENTS AND USE CASES FOR A CWS DASHBOARDThe workshop facilitator ensured that all attendees participated and that requirements with technical ororganizational constraints were identified. The consolidation of requests and analysis of constraints occurredduring the review cycles. If enough requests came up with the same constraints, the PWD organization wasalerted that some investments and changes were needed to remove or reduce those constraints.TABLE 1Example User Requirements for CCSIDNameDescriptionCategory1Pressure zonePressure zone layer.Map service2Messageboard/overallactivity logRunning list of all activities performed for each alert and incident. Includes custommessages entered by users. Message can be associated with an alert or a component butcan also be a generic systemwide message. Log will include ID, timestamp, component,action/message, user, and priority. Include ability to filter by component, user, or priority.Data3Query CCScomplaintsQuery by complaint type and date range, display chart with number of calls (and eventdetection algorithms [EDA] thresholds) by pressure zone, service area. Click on chart – display calls (for the selected chart element) on the map.Query4Mouse Over:CCS complaintMouse‐over window displays service request ID, status (open/closed), priority, complainttype, problem address/zip, timestamp.Toolbox functions5Click On: CCScomplaintClick‐on window should display service request ID, status (open/close), priority, complainttype, customer name, problem address/zip, phone number, timestamp, sample taken, anda link to activity log for that call.Toolbox functionsReview and Prioritization of User RequirementsOnce all user requirements were gathered at the component level, the system engineering team reviewed themboth from a requirement definition perspective and from a business process perspective for completeness.Individual meetings were conducted to clarify any outstanding issues. Redundant requests were combined into acommon request. Technical and organizational constraints were evaluated to identify requirements that were notfeasible to implement given the project schedule and budget.The following process was used in the review and prioritization of the requirements:1. List all requirements to be prioritized in a spreadsheet. All items must be at the same level of detail.2. Estimate the relative benefit that each feature provides to the end user or the component.3. Estimate the negative impact on the end user if a feature is not implemented.4. Calculate a total value of the feature as the sum of items 2 and 3 above.5. Estimate the relative cost of implementing each feature.6. Estimate the relative degree of risk (e.g., unknown elements, technical complexity).7. Weight the value from 4 against the cost and risk of 5 and 6.TABLE 28. Rank the features according to 7.Priority ScaleAs part of Step 7, the requirements were prioritized to identifythe critical user requirements and those items that are “nice tohave” and could be implemented in the future. Prioritizationallowed the system engineering team to resolve conflicts, planfor staged deliveries, and make the necessary tradeoffdecisions. The priority scale used to categorize and rank therequirements is provided in Table 2.4PriorityClassificationDefinition1 – HighA mission‐critical requirement; requiredfor next release.2 – MediumRequired eventually but could wait untila later release if necessary.3 – LowAn enhancement; would be nice to havesomeday if resources permit.
DEVELOPMENT OF USER REQUIREMENTS AND USE CASES FOR A CWS DASHBOARDDefinition of Use Cases and Software Design DocumentsOnce the user requirements were reviewed and prioritized, user requirements with a high or mediumclassification were analyzed further to convert them into meaningful use cases to aid in software development.A use case is a list of steps typically defining interactions between a user and a system to achieve a goal.Software design documents were prepared in the form of tables or figures to document the conversion of userrequirements to use cases and provide overall guidance on the architecture of the CWS Dashboard. Example usecases in table form are provided to illustrate the conversion of requirements to a use case. Table 3 illustrates ageneral user requirement, i.e., opening the CWS Dashboard. Table 4 provides the use case that documents themouse‐over user requirement defined for CCS functionality that was shown in Table 1.TABLE 3Example Use CaseUse Case IDCWS‐1Related requirements55TitleOpen CWS DashboardPurpose/overviewA user navigates to the Dashboard URL and opens the CWS Dashboard Intro/home page.Users/actorsAll CWS users.PreconditionA user opens a web browser.ScenarioA user navigates to the CWS Dashboard Intro/home page with a unique URL.System displays an intro page to the CWS Dashboard.System displays web links relevant to PWD CWS (TBD).System displays a login tab or button.Post‐conditionCWS Dashboard Intro/home page is shown on the screen. A user can: Read CWS Dashboard information and/or user instruction on the intro page.Click the login button to log into the Dashboard system.TABLE 4Example CCS Use CaseUse Case IDCCS‐3Related requirements5TitleMouse‐over: CCS.Purpose/overviewAs a user moves the mouse over a CCS complaint point on the map, quick facts about the complaint aredisplayed on the screen.Users/actorsCCS users.PreconditionDefault CCS map and CCS toolbox is open on the screen, and a user selected the identify tool.ScenarioA user moves the mouse over a CCS complaint point on the map. System displays a map tips window showing:‐ service request ID‐ status (open/close)‐ priority‐ complaint type‐ problem address/zip‐ timestamp(Note: Too much information in the mouse‐over window may block the view of the map, need to revisit andrevise the number of parameters to be displayed by mouse‐over.)5
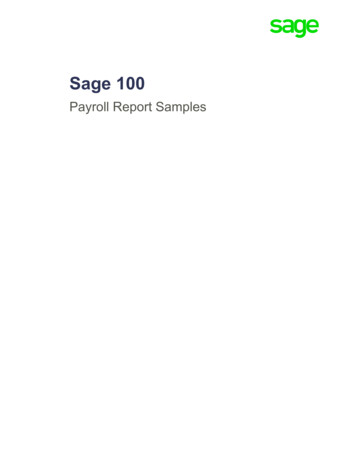
DEVELOPMENT OF USER REQUIREMENTS AND USE CASES FOR A CWS DASHBOARDTABLE 4Example CCS Use CaseUse Case IDCCS‐3Post‐conditionSelected CCS complaint information, including service request ID, status (open/close), priority, complaint type,problem address/zip, timestamp, is displayed on the map (also see the note above).Alternate Scenario 1A user moves the mouse away from a CCS complaint point on the map. System closes the map tips window.Screen mockups are an effective way of conveying user interface concepts from the requirements team to thedevelopment team. A simple screen mockup created in Microsoft Excel (Figure 3) conveyed the general screenlayout of the CWS Dashboard to the development team.FIGURE 3Example Screen MockupMany of the user requirements requested particular geographic information system (GIS) layers to fulfill specificbusiness needs. Table 5 is a separate mapping requirements document generated to manage the spatialrequirements and coordinate the mapping requirements with the GIS group.TABLE 5Example Set of Mapping RequirementsMap Service NameDescriptionPressure zoneDisplay pressure zone layer on mapWater assetsDisplay water assetsHydrantDisplay hydrantsWTP service areaDisplay water treatment plant (WTP) service areasOWQM GISDisplay OWQM GIS sites and water quality parametersBLS GISDisplay Bureau of Laboratory Services (BLS) GIS (sample location and water quality parameters)Zip codesZip codesCouncilmanic districtsCouncilmanic districts6
DEVELOPMENT OF USER REQUIREMENTS AND USE CASES FOR A CWS DASHBOARDLessons LearnedThe most effective user requirements came from input specific to the contributor's roles and responsibilities.Although end users were not always pleased to learn that they would not get all the features they desired in theinitial release of the CWS Dashboard, they understood that due to time and budget constraints, some featureswould be implemented before others. Getting a single user to set priorities on his or her requirements, let alone alarge group of users from different parts of the organization, can be difficult, but it is an important part of theCWS Dashboard development process. Having a clearly communicated process that empowers end usersthroughout the organization led not only to an application that was an integral part of the CWS, but also to amore efficient development process and a higher rate of user acceptance. Using a consistent team through theentire process from initial business requirement and process definition through the development of theapplication also fostered an efficient development pipeline with fast review and modification cycles.Conclusions and RecommendationsThe system engineering team conducted a series of dashboard requirement workshops with component leads andprimary CWS Dashboard users from five surveillance components (OWQM, CCS, S&A, ESM, and PHS) as part of thedevelopment of the CWS Dashboard. After each requirement workshop, the system engineering team developeda detailed list of requirements. The four‐step process to develop the user requirements for the requestedfunctionality proved to be successful.PWD has benefited from integrating the various component data systems. The CWS Dashboard is a complexapplication that brings together data from multiple components and facilitates the determination of whether acontamination or operational event has occurred in the water utility system. The CWS Dashboard providesimportant system information to key decision‐makers, wherever and whenever, to support timely andappropriate responses to water quality anomalies.7
Abbreviations and SWTPBureau of Laboratory ServicesCustomer Complaint SurveillanceConsequence ManagementContamination Warning SystemEvent detection algorithmUnited States Environmental Protection AgencyEnhanced Security MonitoringGeographic Information SystemIdentification numberOnline Water Quality MonitoringPublic Health SurveillancePhiladelphia Water DepartmentSampling and AnalysisTo be determinedWater SecurityWater treatment plantDISCLAIMERThis white paper was prepared under an EPA Water Security initiative grant awarded to Philadelphia Water Department.Neither Philadelphia Water Department nor CH2M HILL makes any warranty, expressed or implied, or assumes any legalliability or responsibility for any third party’s use, or the results of such use, or any information, apparatus, product, orprocess disclosed in this publication, or represents that its use by such third party would not infringe privately owned rights.8
design and development team to implement the CWS Dashboard. This paper describes the four critical steps taken in the development of user requirements for the CWS Dashboard: (1) educate PWD staff on the process development through chartering workshop, (2) conduct