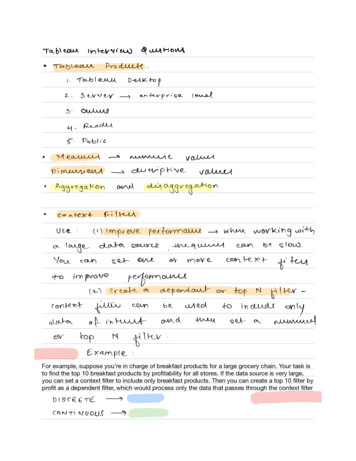
Transcription
EMBARKING ON ACommonNE W JOURNEY in Dashboard DesignPITFALLSbyStephen FewPrincipal, Perceptual EdgeFebruary 2006SPECIAL ADDENDUMAvoid the Pitfallswith ProClarity
TABLE OF CONTENTSExecutive Summary .1Introduction .2What Is a Dashboard? .2What Is So Hard about Designing Dashboards? .213 Common Pitfalls in Dashboard Design .3Pitfall #1: Exceeding the Boundaries of a Single Screen .4Pitfall #2: Supplying Inadequate Context for the Data.5Pitfall #3: Displaying Excessive Detail or Precision .5Pitfall #4: Expressing Measures Indirectly .6Pitfall #5: Choosing Inappropriate Media of Display .8Pitfall #6: Introducing Meaningless Variety .9Pitfall #7: Using Poorly Designed Display Media .9Pitfall #8: Encoding Quantitative Data Inaccurately . 10Pitfall #9: Arranging the Data Poorly . 11Pitfall #10: Ineffectively Highlighting What’s Important . 12Pitfall #11: Cluttering the Screen with Useless Decoration. 12Pitfall #12: Misusing or Overusing Color. 13Pitfall #13: Designing an Unappealing Visual Display . 14The Key to Dashboard Effectiveness . 15About the Author . 16Addendum from ProClarity CorporationAvoid the Common Pitfalls of Dashboard Design with ProClarity . 17Avoid Pitfall #1 with ProClarity Custom Templates . 17Avoid Pitfall #4 with ProClarity KPI Designer . 19Avoid Pitfall #5 with ProClarity Charts and Formatting Options . 25Avoid Pitfall #8 (Encoding Quantitative Data Inaccurately) withProClarity Chart Properties . 26Summary . 28This white paper is for informational purposes only. PROCLARITY MAKES NO WARRANTIES, EXPRESS OR IMPLIED, IN THISDOCUMENT. It may not be duplicated, reproduced, or transmitted in whole or in part without the express permission of theProClarity Corporation, 500 South 10th Street, Boise, Idaho 83702. For more information, contact ProClarity: info@proclarity.com; Phone: 208-343-1630. All rights reserved. All opinions and estimates herein constitute our judgment as of this date andare subject to change without notice. 2005 ProClarity Corporation. All rights reserved. No portion of this report may be reproduced or stored in any form without prior written permission.www.proclarity.com
EXECUTIVE SUMMARYDashboards have become a popular means to deliver important information at a glance, but this potential is rarely realized.Even the best dashboard software in the world will not produce a useful dashboard if it doesn’t incorporate effective visualdesign. Any dashboard that fails to deliver the information that people need clearly and quickly will never be used, no matterhow cute its gauges, meters, and traffic lights. Effective dashboards are the product of informed visual design.Based on his new book, Information Dashboard Design: The Effective Visual Display of Data, Stephen Few will lead you througha quick tour of the 13 most common pitfalls in the visual design of dashboards. Knowing what doesn’t work will help youavoid the problems that resign most dashboards to the trash heap.You Will Learn: What dashboards are, what they should do, and why they’re important The primary goals and challenges of dashboard design The 13 most common mistakes in the visual design of dashboards The importance of designing dashboards that are aligned with the way people see and thinkProClarity sponsored this white paper to help people better understand the concept of a business intelligence dashboardand how to effectively present quantitative information in general or while using ProClarity business intelligence solutions. 2005 Perceptual Edge1
INTRODUCTIONDespite their tremendous popularity and potential, many and perhaps most dashboard implementations fail miserably. Adashboard’s entire purpose is to communicate important information clearly, accurately, and efficiently, but most dashboardssay too little, and what they do say requires far too much effort to discern. This is a failure more of design than technology.Fundamentally, it is a failure of visual design.Browsing the many examples of dashboards that can be found on the Internet, especially on the sites of companies thatmarket dashboard software, you will find a bevy of flashy displays showing off cute gauges, meters, and traffic lights, butrarely will you find dashboards that really communicate. The reason examples like this dominate is simple: flash sells. Butdoes it work? The first day that you put a dashboard of this type in front of real business people, they’ll “ooooo and ahhhhhh,”delighted by its video-gamish appeal, but by the end of the week its superficial luster will fade and they’ll stop looking at italtogether if it fails to give them the information they need in a manner that is clear, accurate, and easy to monitor at a glance.In my work as an information design consultant, teacher, and writer, I’ve focused a great deal on dashboards in the last twoyears. In the course of this work, I’ve identified a list of the 13 most common pitfalls in the visual design of dashboards thatyou should avoid if you want yours to communicate effectively. Before we launch into this, however, let’s get our terminologystraight.WHAT IS A DASHBOARD?I began working with what we today call dashboards long before we started calling them by this name. About two years ago,I decided to pay special attention to the unique opportunities that dashboards provide for business communication and theunique challenges that they present in visual information design. I became frustrated immediately however, by the fact that agreat deal was being said about them—especially a great deal of marketing hype—but no one was actually saying what theywere. It’s easy to claim that you have the best dashboard software when you haven’t bothered to define what a dashboardis. I decided that a good working definition was needed, so I did some research and spent many hours thinking about it, andthen offered one of my own that was originally published in the March 2004 edition of Intelligent Enterprise magazine in anarticle entitled “Dashboard Confusion.” Here it is:A dashboard is a visual display of the most important information needed to achieve one or more objectives,consolidated and arranged on a single screen so the information can be monitored at a glance.I’ve attempted to provide a definition that distinguishes dashboards from other displays that also combine multiple piecesof information on a computer screen, as well as one that does not too narrowly limit the information that can be displayed orthe viewing audience it can serve.Dashboards consolidate onto a single screen the sometimes disparate information that someone needs to monitor to do ajob. This single-screen display need not be comprehensive in and of itself, but it must provide the overview that is neededto know when action is required, and ideally should provide an easy gateway to any additional information that is neededto determine the precise action that is appropriate. Dashboards tend to be highly visual (that is, graphical) in the way theypresent information, not because it is cute or entertaining, but because when presented properly, pictures of data can bescanned and understood much faster than the same data presented as text.WHAT IS SO HARD ABOUT DESIGNING DASHBOARDS?I spend a great deal of my time teaching people how to communicate quantitative business data effectively in the formof graphs—a skill set that is not common, despite the huge production of graphs in business today. The type of graphicalcommunication that is typically required in business is not difficult to learn how to do, but it doesn’t come naturally.Designing individual graphs is simple compared to designing entire dashboards. Trying to get all that information on a singlescreen in a way that doesn’t end up looking like a cluttered mess isn’t easy. If you think it is, chances are you haven’t actuallytried to do it. 2005 Perceptual Edge2
Figure 1: The greatest challenge of dashboard design involves squeezing all of thatinformation on a single screen in a way that doesn’t result in a cluttered mess.Dashboards that communicate clearly, accurately, and efficiently are the result of careful and informed visual design. Giventhe purpose that dashboards serve, as defined above, they must be designed to support the following process of visualmonitoring:1.2.3.See the big picture.Focus in on the specific items of information that need attention.Quickly drill into additional information that is needed to take action.Step #3 can be supported through convenient links to additional information, but steps #1 and #2 require visual designthat allows viewers to scan a great deal of information quickly to get an overview, easily recognize those items that demandattention, and then get enough information about those items to assess the potential need for a response. To achieve thisend, it helps to recognize and avoid the common mistakes in dashboard design that often get in the way.13 COMMON PITFALLS IN DASHBOARD DESIGNKnowing what to avoid isn’t everything, but it’s a good start. Here’s a list of the 13 mistakes that I’ll describe in detail:1.2.3.4.5.6.7.8.9.10.11.12.13.Exceeding the boundaries of a single screenSupplying inadequate context for the dataDisplaying excessive detail or precisionExpressing measures indirectlyChoosing inappropriate media of displayIntroducing meaningless varietyUsing poorly designed display mediaEncoding quantitative data inaccuratelyArranging the data poorlyIneffectively highlighting what’s importantCluttering the screen with useless decorationMisusing or overusing colorDesigning an unappealing visual displayLet’s dive in. Every one of these pitfalls is illustrated with an example from an actual dashboard that I found on the Web site ofa software vendor, with the one exception of pitfall #4. 2005 Perceptual Edge3
PITFALL #1: EXCEEDING THE BOUNDARIES OF A SINGLE SCREENSomething powerful happens when information is seen together, at the same time. Not only does this provide conveniencefor viewers and save them valuable time, it also paints a complete picture that can bring to light important connections thatmight not be visible otherwise. Something critical is sacrificed when the viewer must lose sight of some data in order to scrolldown or over, or move from screen to screen to see the rest. Part of the problem is that we can only hold a few chunks ofinformation at a time in short-term memory. Relying on the mind’s eye to retain a visualization that is no longer visible is alimited venture. One of the great benefits of a dashboard is the simultaneity of vision, the ability to see everything you needat once.Besides designing a dashboard that requires scrolling around to see everything, data is often fragmented into separatescreens. The dashboard below fragments the data that a sales executive might need to monitor into tiny slices selectedthrough the use of radio buttons or list boxes. For instance, to see the seven major metrics that are displayed in the upper leftcorner of the screen, the viewer must select and view them separate, never together. The same is true for product revenue,regional revenue, etc. With this design, the viewer can never compare the performance of products or regions, which is acommon need. Splitting the big picture into a series of separate small pictures is a mistake when seeing the big picture isworthwhile.Figure 2: This sales dashboard fragments the data into many slices by requiring the viewer toselect individual pieces without any means to see the whole. 2005 Perceptual Edge4
PITFALL #2: SUPPLYING INADEQUATE CONTEXT FOR THE DATAAs a means to monitor what’s going on in the business, dashboards are usually populated predominantly with quantitativemeasures of what’s currently going on. Measures of what’s going on in the business, however, rarely do well as a solo act;they need a good supporting cast to get their message across. To state that quarter-to-date sales total 736,502 without anycontext means little. Compared to what? Is this good or bad? How good or bad? Are we on track? Is this better than before?The right context for the key measures makes the difference between numbers that just sit there on the screen and thosethat enlighten and inspire action.Measures of what’s currently going can be enriched by providing one or more comparative measures, such as a target orsome history, as well as a quick visual means for assessing the measure’s qualitative state (for example, good, satisfactory, orbad).As an example, the gauge below could have easily incorporated useful context, but it falls far short of its potential. Other thanestimating that net income is around 3.5 million, this gauge tells us nothing.Figure 3: Typical dashboard display media often provide littleif any useful context for the measures that they present.A quantitative scale on a graph, such as the one suggested by the tick marks around this gauge, are meant to help usinterpret the measure, but it can only do so effectively if the scale is labeled with numbers. Beginning from the lower leftwhere the beginning of this scale is labeled 2M, can you figure out what each of the major tick marks represents? I can’t. Isthis amount of income good? A great deal of space is used by these gauges to tell us far too little. Much richer informationcan be displayed in a way that need not overwhelm the viewer with much, but just enough to make the data meaningful.PITFALL #3: DISPLAYING EXCESSIVE DETAIL OR PRECISIONTo support the purpose of rapid monitoring, dashboards should never display information that is more detailed or precisethan necessary. To do so would force the viewer to process levels of data that are irrelevant to the task at hand. Too muchdetail or measures that are expressed too precisely (for example, 3,848,305.93 rather than 3,848,306 or perhaps even 3.8M) just slow them down without benefit.Examine the two sections in the example below that I’ve enclosed in red rectangles. The lower right section displays from fourto ten decimal digits for each measure, which might be useful in some contexts, but doubtfully on a dashboard. The upperhighlighted section displays time down to the level of seconds, which seems excessive in this context. With a dashboard,every unnecessary piece of information results in wasted time, which is intolerable when time is definitely of the essence. 2005 Perceptual Edge5
Figure 4: This dashboard displays levels of detail and precision that are excessive.PITFALL #4: EXPRESSING MEASURES INDIRECTLYTo express measures appropriately, you must understand exactly what viewers need to see and how they plan to use theinformation. For a measure to be meaningful, viewers must know what is being measured and the units in which the measureis being expressed. A measure is poorly expressed if it fails to directly, clearly, and efficiently communicate the meaning thatthe dashboard viewer must discern. If the dashboard viewer only needs to know by how much actual revenue differs frombudgeted revenue, rather than displaying the actual revenue amount of 76,934 and the budgeted revenue amount of 85,000 and leaving it to the viewer to calculate the difference, why not display the variance amount directly? Also, in manycases, rather than displaying the variance amount as - 8,066, for instance, it would be more direct to simply express thevariance as a percentage, such as -10%. A percentage more clearly focuses attention on the variance itself, rather than the rawdifference (such as in dollars).Percentages also make it easier to compare the variances of multiple items when their actual values differ significantly inscale, such as the variances of actual from budgeted expenses for several departments, each with it own budget. A smalldepartment’s over-budget amount of 5,000 could be more troubling than a large department’s over-budget amount of 50,000, but this might only be obvious if the variance were expressed as a percentage.The variance graph below illustrates this point. Even though its purpose is to display the degree to which actual revenuevaries from planned revenue, you must work harder than necessary to discern this information. 2005 Perceptual Edge6
Figure 5: This graph failes to express the variance amount directly.The variance could, however, be displayed more directly and vividly by encoding budgeted revenue as a reference line of 0%and the variance as a line that meanders above and below budget, expressed in units of positive and negative percentages.Figure 6: This graph directly expresses the variance between actualand budgeted revenue, making it much easier to see and evaluate. 2005 Perceptual Edge7
PITFALL #5: CHOOSING INAPPROPRIATE MEDIA OF DISPLAYThis is one of the most common design mistakes that I encounter, not just on dashboards, but in all forms of datapresentation. Using a graph when a table of numbers would work better and vice versa is a frequent mistake, but what ismore common and egregious is use of the wrong type of graph for the data and its message.Without the value labels on the pie chart below, which was excerpted from a dashboard, you would only be able todiscern that opportunities rated as “Fair” represent the largest group, those rated as “Field Sales – Very High” represent aminiscule group, and the other ratings are roughly the equal in size. If you must read the numbers to determine how theslices of a pie chart relate to one another, you might as well use a table instead. We use graphs when the picture itselfreveals something important that couldn’t be communicated as well be a table of numbers. The slices of this pie cannotbe interpreted in a useful way without reading the associated numbers, so what use is the picture?Figure 7: A pie chart often does a poor job of showing howindividual items relate to one another and the whole.The bar graph below, however, tells the same story as the pie chart above, but does so clearly, because it is a bettermedium of display for this information.Figure 8: This bar graph is the appropriate choice for quickly communicating the relationshipbetween these individual items as they relate to one another and the whole. 2005 Perceptual Edge8
PITFALL #6: INTRODUCING MEANINGLESS VARIETYThis mistake is closely tied to the one we just examined. I’ve found that people often hesitate to use the same medium ofdisplay (bar chart, etc.) multiple times on a dashboard out of what I assume is a sense that viewers will get bored with thesameness. Variety might be the spice of life, but if it is introduced on a dashboard for its own sake, the display suffers. Youshould always select the means of display that works best, even if that results
Even the best dashboard software in the world will not produce a useful dashboard if it doesn’t incorporate effective visual design. Any dashboard that fails to deliver the information that people need clearly and quickly will never be used,