Transcription
EFFECTIVE DASHBOARD DESIGN:STRATEGIES & TACTICSBrent Dykes Director, Data Strategy
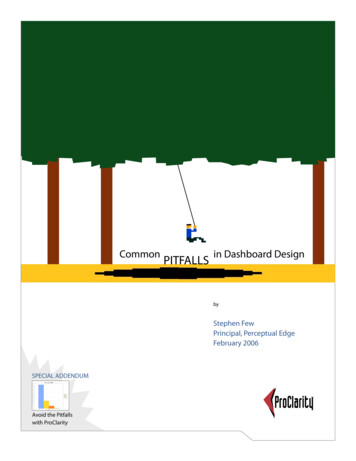
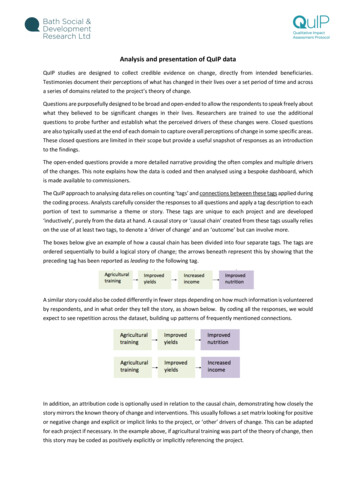
ARE YOUR USERS FEELING OVERLOADED?
HOW DOES THIS HAPPEN?DATAVISUALSAUDIENCEAUDIENCEDATAVISUALS
WHAT INFORMS DATA VISUALISATION?AUDIENCEBUSINESS OBJECTIVESMETRICS & TARGETSQUESTIONSVISUALISATIONS
HAVING A CLEAR SIGNAL IS IMPORTANT
AUDIENCE: HOW TO GET A CLEAR RAUDIENCEDIVERGENTAREAS OF FOCUS
AUDIENCE: HOW TO GET A CLEAR (MINUTIAE)AUDIENCEAUDIENCEDIVERGENTAREAS OF FOCUSDIFFERENTLEVELS
AUDIENCE: HOW TO GET A CLEAR EDIVERGENTAREAS OF FOCUSDIFFERENTLEVELSSHARED FOCUS SIMILAR LEVEL
DEFINE YOUR AUDIENCE & THEIR SHARED NEEDSLEVELStrategic oroperational?Desktop y priorities& metricsReal-time vs.scheduledExperts vs.novices
WHAT ARE THEIR BURNING QUESTIONS?
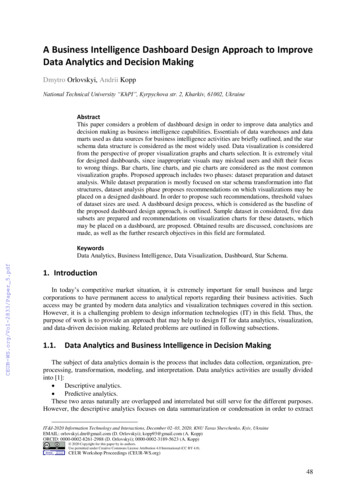
INVERTED PYRAMID FRAMEWORKINVERTED PYRAMIDMOST ILSTHE BOY WHO CAME BACK TO LIFEThe former missing child Will Byershas been found after a week of searching. Heis presently in stable condition in HawkinsGeneral Hospital. Byers' mother, JoyceByers, alleges that Will was the subject of asecret government program run by theHawkinsNationalLaboratory.Theallegation comes amidst a massiveinvestigation into the hidden organizationand its elaborate experimentation in perusalof mind control.The abuse detailed in the first reportincludes prolonged physical duress andpsychologicalinterrogation.Thisgovernment sanctioned torture has provokedoutrage amongst the American people. In astatement issued yesterday morning, Ivesmentioned her "disgust" with theorganization saying "our own Americanpeople are being treated like the enemy. weshould be directing our attention to the realtarget, the Soviets, not our own daughtersand sons." Under legal advice, Brenner hasissued no comment on.Twelve-year-oldWillByerswasreported missing on Nov. 3, and it wasfalsely reported that his body wasrecovered at Sattler Quarry.
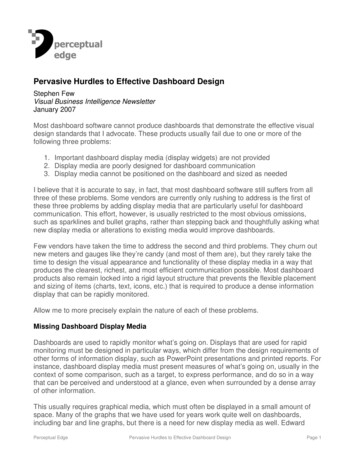
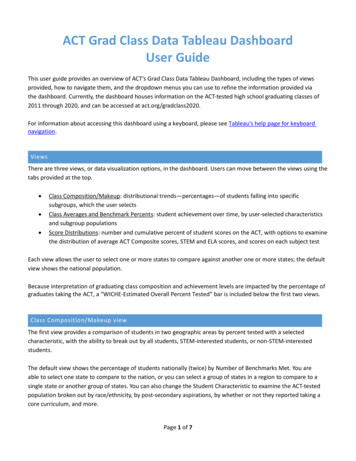
INVERTED APPROACH TO DASHBOARD DESIGNINVERTED PYRAMIDDASHBOARD DESIGNMOST IMPORTANTINFORMATIONOVERVIEWHOW AREWE ING?OTHERDETAILSEXPLOREHOW CAN ILEARN MORE?
OVERVIEW: HOW ARE WE DOING?KEY METRICS CONTEXT702 leads1,000 leadsMarch 2017Monthly Target892 leadsMarch 2018
BREAKDOWN: WHAT’S HAPPENING?KEY DIMENSIONS SUPPORTINGMETRICS
EXPLORE: HOW CAN I LEARN MORE?OTHERRELEVANTDIMENSIONS METRICS
HOW TO DESIGN YOUR DASHBOARDFOCUS AREA DASHBOARDINVERTED PYRAMID DASHBOARDCOLLECTION – FOCUS AREA #1COLLECTION #1KPI#1CARDCARDCARDCOLLECTION - OVERVIEWCARDOVERVIEWCOLLECTION – FOCUS AREA RDKPI#3CARDCARDCARDCARDCOLLECTION – BREAKDOWN #2CARDCOLLECTION – FOCUS AREA #4KPI#4KPI#2COLLECTION – BREAKDOWN #1COLLECTION – FOCUS AREA #3KPI#3COLLECTION #1KPI#1BREAKDOWNKPI#2CARDCARDCARDCARDCOLLECTION – BREAKDOWN #3CARDKPI#3CARDCARDCARDCARD
VISUALISING DATA EFFECTIVELY
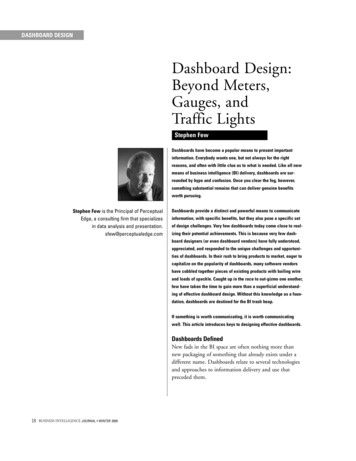
VISUALISATION STRATEGY BY DASHBOARD SECTIONSTATICOVERVIEWHOW AREWE DOING?RICH &BROADSIMPLE &SPECIFICEXPLOREBREAKDOWNHOW CAN ILEARN MORE?WHAT’SHAPPENING?INTERACTIVE
THE RIGHT CHART TYPE FOR YOUR tionBarLineBarScatterplotHistogramLollipopBarPie & DonutBubbleBox plotTableStacked AreaTreemapHeatmapChoropleth
NOT ALL CHARTS ARE CREATED nshipDistributionScatterplotChoroplethOVERVIEWHOW AREWE DOING?BREAKDOWNWHAT’SHAPPENING?DonutEXPLOREHOW CAN ILEARN MORE?TableStackedAreaTreemap
OVERVIEW: WHAT CAN YOU SEE AT A GLANCE?RULE #1Understoodin 3 secondsor lessRULE #2No clicking orhovering isrequired
WHAT’S ESSENTIAL FOR THE OVERVIEW CARDS?KEY RESULTSCONTEXTPOLARITYVARIANCE Count Sum Ratio Historicalperformance(P-o-P) Statisticalbenchmarks Targets Pace (to target) Peer / industrybenchmarks Positive Negative Neutral No change Slightchange SignificantchangeANOMALIES Potentialalerts Actionablereminders
THREE KEY TYPES OF OVERVIEW CARDSBAR CHARTSLINE CHARTSGAUGES
OVERVIEW: BAR CHARTSKEY RESULTS1. BarCONTEXTPOLARITYVARIANCE
OVERVIEW: BAR CHARTSKEY RESULTS1. BarCONTEXTPOLARITYVARIANCE
OVERVIEW: BAR CHARTSKEY RESULTS1. BarCONTEXTPOLARITYVARIANCE
OVERVIEW: BAR CHARTSKEY RESULTS1. BarCONTEXTPOLARITYVARIANCE
OVERVIEW: BAR CHARTSKEY RESULTS1. BarCONTEXTPOLARITYVARIANCE
OVERVIEW: BAR CHARTSKEY RESULTS1. BarGOODBAD 300KCONTEXTPOLARITYVARIANCE
OVERVIEW: BAR CHARTSKEY RESULTS1. BarGOODBAD 300KCONTEXTPOLARITYVARIANCE
OVERVIEW: BAR CHARTSKEY RESULTS1. BarCONTEXTPOLARITYVARIANCE
OVERVIEW: BAR CHARTSKEY RESULTS1. BarCONTEXTPOLARITYVARIANCE
OVERVIEW: BAR CHARTSKEY RESULTS1. BarCONTEXTPOLARITYVARIANCE
OVERVIEW: BAR CHARTS5/5UTILITY3/5NOVELTYKEY RESULTS1. BarCONTEXTPOLARITYVARIANCE
OVERVIEW: BAR CHARTSKEY RESULTS1. Bar2. Progress barCONTEXTPOLARITYVARIANCE
OVERVIEW: BAR CHARTSKEY RESULTS1. Bar2. Progress barCONTEXTPOLARITYVARIANCE
OVERVIEW: BAR CHARTS1/5UTILITY3/5NOVELTYKEY RESULTS1. Bar2. Progress barCONTEXTPOLARITYVARIANCE
OVERVIEW: BAR CHARTSKEY RESULTS1. Bar2. Progress bar3. LollipopCONTEXTPOLARITYVARIANCE
OVERVIEW: BAR CHARTSKEY RESULTS1. Bar2. Progress bar3. LollipopCONTEXTPOLARITYVARIANCE
OVERVIEW: BAR CHARTS2/5UTILITY4/5NOVELTYKEY RESULTS1. Bar2. Progress bar3. LollipopCONTEXTPOLARITYVARIANCE
OVERVIEW: BAR CHARTSKEY RESULTS1.2.3.4.BarProgress barLollipopBulletCONTEXTPOLARITYVARIANCE
OVERVIEW: BAR CHARTSKEY RESULTS1.2.3.4.BarProgress barLollipopBulletCONTEXTPOLARITYVARIANCE
OVERVIEW: BAR CHARTSKEY RESULTS1.2.3.4.BarProgress barLollipopBulletCONTEXTPOLARITYVARIANCE
OVERVIEW: BAR CHARTS5/5UTILITY4/5NOVELTYKEY RESULTS1.2.3.4.BarProgress NCE
OVERVIEW: LINE CHARTSKEY RESULTS1.2.3.4.5.BarProgress barLollipopBulletLineCONTEXTPOLARITYVARIANCE
OVERVIEW: LINE CHARTSKEY RESULTS1.2.3.4.5.BarProgress barLollipopBulletLineCONTEXTPOLARITYVARIANCE
OVERVIEW: LINE CHARTSKEY RESULTS1.2.3.4.5.BarProgress barLollipopBulletLineCONTEXTPOLARITYVARIANCE
OVERVIEW: LINE CHARTSKEY RESULTS1.2.3.4.5.BarProgress barLollipopBulletLineCONTEXTPOLARITYVARIANCE
OVERVIEW: LINE CHARTSKEY RESULTS1.2.3.4.5.BarProgress barLollipopBulletLine225 page viewsCONTEXTPOLARITYVARIANCE
OVERVIEW: LINE CHARTSKEY RESULTS1.2.3.4.5.BarProgress barLollipopBulletLineCONTEXTPOLARITYVARIANCE
OVERVIEW: LINE CHARTSKEY RESULTS1.2.3.4.5.BarProgress barLollipopBulletLineCONTEXTPOLARITYVARIANCE
OVERVIEW: LINE CHARTSKEY RESULTS1.2.3.4.5.BM1BM2BarProgress barLollipopBulletLineCONTEXTPOLARITYVARIANCE
OVERVIEW: LINE CHARTSKEY RESULTS1.2.3.4.5.BarProgress barLollipopBulletLineCONTEXTPOLARITYVARIANCE
OVERVIEW: LINE CHARTSKEY RESULTS1.2.3.4.5.BarProgress barLollipopBulletLineCONTEXTPOLARITYVARIANCE
OVERVIEW: LINE CHARTSKEY RESULTS1.2.3.4.5.BarProgress barLollipopBulletLineCONTEXTPOLARITYVARIANCE
OVERVIEW: LINE CHARTS5/5UTILITY3/5NOVELTYKEY RESULTS1.2.3.4.5.BarProgress barLollipopBulletLineCONTEXTPOLARITYVARIANCE
OVERVIEW: LINE CHARTSKEY RESULTS1.2.3.4.5.6.BarProgress RITYVARIANCE
OVERVIEW: LINE CHARTSKEY RESULTS1.2.3.4.5.6.BarProgress RITYVARIANCE
OVERVIEW: LINE CHARTSKEY RESULTS1.2.3.4.5.6.BarProgress RITYVARIANCE
OVERVIEW: LINE CHARTS5/5UTILITY3/5NOVELTYKEY RESULTS1.2.3.4.5.6.BarProgress RITYVARIANCE
OVERVIEW: GAUGESKEY RESULTS1.2.3.4.5.6.7.BarProgress barLollipopBulletLinePeriod-over-periodSingle valueCONTEXTPOLARITYVARIANCE
OVERVIEW: GAUGES1/5UTILITY1/5NOVELTYKEY RESULTS1.2.3.4.5.6.7.BarProgress barLollipopBulletLinePeriod-over-periodSingle valueCONTEXTPOLARITYVARIANCE
OVERVIEW: GAUGESKEY RESULTS1.2.3.4.5.6.7.8.BarProgress barLollipopBulletLinePeriod-over-periodSingle valueFaceCONTEXTPOLARITYVARIANCE
OVERVIEW: GAUGES2/5UTILITY5/5NOVELTYProject A StatusProject B StatusProject C StatusProject D StatusProject E StatusProject F StatusProject G StatusProject H StatusProject I StatusKEY RESULTS1.2.3.4.5.6.7.8.BarProgress barLollipopBulletLinePeriod-over-periodSingle valueFaceCONTEXTPOLARITYVARIANCE
OVERVIEW: GAUGES2/5UTILITY2/5NOVELTYKEY RESULTS1.2.3.4.5.6.7.8.9.BarProgress barLollipopBulletLinePeriod-over-periodSingle valueFaceComparativeCONTEXTPOLARITYVARIANCE
OVERVIEW: eTarget% Change DirectionKEY RESULTS1. Bar2. Progress bar3. Lollipop4. Bullet5. Line6. Period-over-period7. Single value8. Face9. Comparative10. Comparative filledCONTEXTPOLARITYVARIANCE
OVERVIEW: GAUGESKEY RESULTS1. Bar2. Progress bar3. Lollipop4. Bullet5. Line6. Period-over-period7. Single value8. Face9. Comparative10. Comparative filledCONTEXTPOLARITYVARIANCE
OVERVIEW: GAUGES4/5UTILITY3/5NOVELTYKEY RESULTS1. Bar2. Progress bar3. Lollipop4. Bullet5. Line6. Period-over-period7. Single value8. Face9. Comparative10. Comparative filled11. FilledCONTEXTPOLARITYVARIANCE
OVERVIEW: GAUGES3/5UTILITY4/5NOVELTYKEY RESULTS1. Bar2. Progress bar3. Lollipop4. Bullet5. Line6. Period-over-period7. Single value8. Face9. Comparative10. Comparative filled11. Filled12. RadialCONTEXTPOLARITYVARIANCE
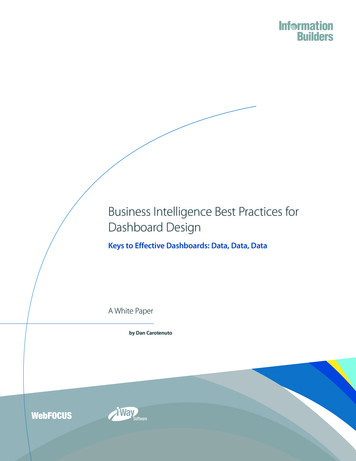
OVERVIEW: OPTIMISING YOUR SUMMARY NUMBERS1. Descriptive labels2. Goals & scale markers
OVERVIEW: OPTIMISING YOUR SUMMARY NUMBERS
OVERVIEW: OPTIMISING YOUR SUMMARY NUMBERS1. Descriptive labels2. Goals & scale markers3. Customized
OVERVIEW: OPTIMISING YOUR SUMMARY NUMBERSCONCATENATE HTML CASE Statement
OVERVIEW: FOUR KEY TAKEAWAYS#1 - Keep the cards simpleClean, intuitive visuals
OVERVIEW: FOUR KEY TAKEAWAYS#2 - Build the cards to inspire actionIndicatorsP-o-PTargetsContext, polarity, & variance
OVERVIEW: FOUR KEY TAKEAWAYS#3 - Ensure every card pulls its ither show results or provide contextCONTEXT
OVERVIEW: FOUR KEY TAKEAWAYS#4 - Signal can come from a singlecard or a combination of cardsSIGNALSIGNALSingleCombination
LET’S DIG A LITTLE DEEPER WITH BREAKDOWNS
BREAKDOWN OPTIONS IN DOMOFiltersDrill pathsCollectionsRelated cardsHover text
BREAKDOWN: EVERYTHING IS NTEXTHOW AREWE DOING?BREAKDOWNWHAT’SHAPPENING?DEADEND
BREAKDOWN: EVERYTHING IS CONNECTEDOVERVIEWHOW AREWE CCONTEXTMETRICCONTEXT?
BREAKDOWN: ANTICIPATING THE NEXT QUESTION(S)OVERVIEWMARKETING DASHBOARDHow many leadswere generated?HOW AREWE DOING?BREAKDOWNWHAT’SHAPPENING?How manyleads bychannel?How manyleads bycampaign?How manyleads perregion?How manyleads perweek?
4 COMMON TYPES OF DIMENSIONAL BREAKDOWNSTIME HourlyDailyWeeklyMonthlyAnnually PEOPLEPLACESCustomer typesSegmentsRoles / positionsGroups / teamsDemographics CountriesRegionsStatesCitiesStoresTHINGS ProductsCategoriesServicesProcess stagesIndustries
BREAKDOWN: TYPICAL EXAMPLESBY REGIONBY REVENUE TYPE
BREAKDOWN: SUBTLE CONTEXT TECHNIQUE
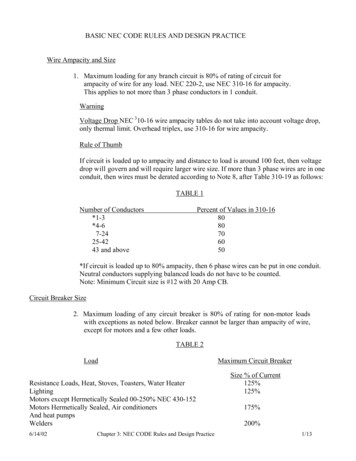
METRICS: LEADING VS. LAGGING INDICATORSLEADINGLAGGINGMeasure the inputsof your key businessprocessesMeasure the outputsof your key businessprocessesHelp predict futureperformanceShow past resultsEasier to influencebut harder to measureEasier to measurebut difficult to influence
LEADING AND LAGGING INDICATOR EXAMPLESFocus AreaLeading IndicatorLagging IndicatorSalesQualified opportunitiesClosed dealsMarketingClick-throughsLeadsHuman ResourcesEmployee sentimentEmployee turnoverManufacturingOn-time deliveryCustomer satisfactionCustomer ServiceCustomer satisfactionCustomer churn
BREAKDOWN: LEADING AND LAGGING INDICATOR CARDS
GOOD DASHBOARD DESIGN IS IMPACTFULDASHBOARD DESIGNOVERVIEWHOW AREWE DOING?BREAKDOWNWHAT’SHAPPENING?EXPLOREHOW CAN ILEARN MORE?
QUESTIONS?
INFORMATION SUPPORTING INFORMATION OTHER DETAILS The former missing child Will Byers has been found after a week of searching. He is presently in stable condition in Hawkins General Hospital. Byers' mother, Joyce Byers, alleges that Will was the subject of a secret government program run by the Hawkins National Laboratory. The allegation comes .