Transcription
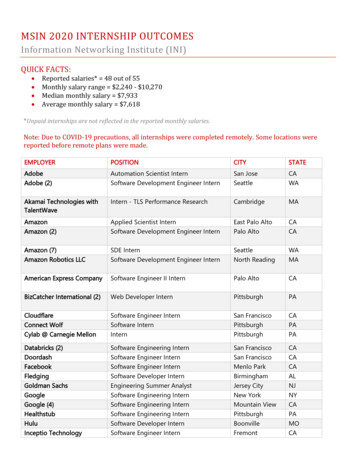
Sustainable Technology &Infrastructure Monthly MarketUpdateApril 2017 ReviewAprilPerformance ofKey MarketIndicesStock PerformanceYTDCY 2016April Ending Versus52 Wk High52 Wk LowDow Jones Industrial Average1.3%6.0%13.4%(0.8%)22.2%NASDAQ Composite2.3%12.3%7.5%(0.0%)31.6%S&P 5000.9%6.5%9.5%(0.5%)19.2%NASDAQ Clean Edge0.4%8.6%(3.6%)(1.3%)26.1%Corporate Transactions HgCapital announced the sale of Qundis, a leading provider of sub-metering solutions inEurope, to Kalorimeta (“KALO”) for 400mm–GCA acted as KALO’s exclusive financial advisor A Macquarie-led consortium acquired the UK Green Investment Bank (“GIB”) from the Britishgovernment for 1.7bn and committed 600mm for projects under construction TBG, a Swiss-based family office, announced its acquisition of Telvent DTN, an agriculturaldata business, from Schneider Electric for an enterprise value of 900mmNotableMergers &Acquisitions andAssetTransactionsAsset Transactions The publicly-listed YieldCo Pattern Energy Group Inc. (“PEGI”) acquired from its sponsor,Pattern Energy Group LP, the 324 MW Broadview wind power facility and associatedtransmission lines for a cash consideration of 215mm and assumed debt of 54mm NextEra sold a 250 MW wind project in Colorado to its YieldCo, NextEra Energy Partners, for 238mm plus the assumption of 184mm in liabilities related to tax equity financing D.E. Shaw completed the sale of an interest in a 921 MW renewable energy portfolio toUllico, Fiera and other investors A joint venture between Enel and Dutch Infrastructure Fund (“DIF”) acquired 50% of the ReachSolar Energy facility located in Australia for 157mm. The JV will acquire the remaining 50%later this year Sonnedix acquired from Centerbridge Partners a 136 MW portfolio of operating and latestage solar projects located in SpainCorporate Transactions Microvast Power System, a manufacturer of batteries for electric and hybrid-electric vehicles,raised 400mm from a group of investors led by CITIC Securities to help expand productioncapacity and commercialize its technologyNotablePrivatePlacements andProject FinanceTransactions ENGIE invested in Chinese solar developer Unisun. ENGIE will own 30% of Unisun followingthe investment SDIC Fund Management is investing 47mm in Maxwell Technologies, an energy storagedeveloper, for a 19.9% stakeAsset Transactions Octopus Energy Investments raised 624mm in debt from six banks to refinance a 516mmbridge facility tied to a 522 MW UK solar PV portfolio The European Investment Bank provided a 380mm loan to TennT to finance the 1,400 MW,624 km HVDC NordLink transmission line connecting Germany and Norway Atlantic Energias Renovaveis received 217mm in financing from the Brazil DevelopmentBank for a 671mm investment in a portfolio of 12 wind farmsAbout Greentech Capital AdvisorsGreentech Capital Advisors is the largest global investment bank and asset management firm focused exclusively onSustainable Infrastructure. We are an expert team of 45 professionals working seamlessly on our clients' behalf in New York,Zurich and San Francisco and through strategic partnerships in Asia. Our team of experienced bankers provides conflict-freeadvice and thoughtful, innovative solutions with an intensely focused effort that does not stop until you achieve success. Ourinvestment banking advisory services focus on mergers and acquisitions, strategic advisory and capital raises. OurGCAasset/1management business offers a long only public equity fund that invests in companies which are solving resource constraintsaround food, energy and water.
Selected Recent Sustainable Technology &Infrastructure M&A TransactionsCorporate TransactionsDealDateAcquirerTargetTarget / Transaction Description4/27/2017SiriusXMAutomatic Labs4/26/2017KalorimetaQundisAcquisition of a supplier of metering devices andsystems for water and room heating equipment4/26/2017Badger ank4/19/2017NorthernPacific GroupSungevityAcquisition of residential solar developer Sungevity,following its Chapter 11 filing4/18/2017Energy ServicesGroupUtiligroupAcquisition of a provider of data management andsoftware to energy companies4/17/2017WiLAN4/5/2017ENGIE4/3/2017Drager Safetybentekk4/3/2017TBGTelventAcquisition of a provider of connected vehicle servicesfor consumers and ion Multiple(1)Value ( mm) Revenue 100 (2)EBITDANDNDSmart Grid 4364.4x13.3xAcquisition of a manufacturer of ultrasonic flow metersWater 239.2xNDAcquisition of the UK government backed green projectinvestorRenewables 2,194NMNMSolar 50NDNDEnergy EfficiencyNDNDNDInternational Acquisition of an industrial internet of things companyRoad Dynamics specializing in intelligent transportation systemsAdvancedTransportation 551.2x18.4xCompagnie du Acquisition of remaining 41% stake in the French windVentdeveloper and operatorWindNDNDND51% acquisition of a developer of gas measurementdevices for industrial applicationsEnergy EfficiencyNDNDNDAcquisition of an agricultural data businessEnergy Efficiency 9004.2x17.0xAsset TransactionsDealTarget / Transaction nableInvestmentsRiverstone,SunEdison106 MW Italian solar portfolioSolarNDNDND4/28/2017Apex CleanEnergyOptimumRenewables200 MW Iowa wind projectWindNDNDND4/26/2017Pattern EnergyGroup IncWind 269NDND4/21/2017NextEra Energy NextEra Energy250 MW wind project in ColoradoPartnersResourcesWind 422NDNM320 MW wind project in WyomingWindNDNDND50 MW Coachell wind project in CaliforniaWindNDNDNDSolar / WindNDNDNDSolar 100NDNDSolar 158NDNDHeartland99 MW wind facility in IowaEnergy ern Energy324 MW wind project in New MexicoGroup LP4/19/2017Alterra 2017Ullico, Fiera,other investorsD.E. Shaw4/12/2017Canadian Solar4/10/2017Enel, DIF4/10/2017InterstatePower & Light4/4/2017Sonnedix GroupInterest in a 921 MW renewable energy portfolioShenzhenTwo solar farms in China, totaling 70 MWEnergy GroupReach SolarEnergyAcquisition of a 50% interest in a 138 MW solar projectin South Australia136 MW solar power assets in SpainSubsectorTransaction Multiple(1)Value ( mm) RevenueSource: FactSet, company announcements, GCA estimates, SEC filings and third party providers.(1)Transaction multiples represent LTM EV/Adj. EBITDA and LTM EV/Sales.(2)SiriusXM CFO confirmed the deal to be slightly north of 100mm.Denotes GCA transactionEBITDAGCA / 2
Selected Recent Sustainable Technology &Infrastructure Capital Raise TransactionsCorporate TransactionsAmountDateCompanyTransaction DescriptionMicrovastProvider of battery systems for electric vehicles andlarge-scale power grid applications 4004/19/2017UnisunSolar developer in China. ENGIE owns 30% of esDeveloper of LIDAR technology for autonomousdriving 36AdvancedCanvas Ventures, GVA Capital, 1517 FundTransportation4/13/2017CloudCarCloud service provider for connected car companies 16AdvancedPassport Capital, DCM VenturesTransportation4/12/2017ActilityProvider of products and services for machine-tomachine (M2M) and smart grid applications 754/11/2017MaxwellTechnologiesManufacturer of ultracapacitors and other energystorage technologies 474/10/2017AgrisomaDeveloper of a non-food industrial oilseed withapplications in the biofuel industry 154/8/2017OtonomoDeveloper of software to connect autonomous carswith each other and with digital infrastructures andexchange data in real time 254/7/2017UptakeDeveloper of analytics and predictive software toincrease safety and enhance performance 504/5/2017PelotonTechnologyDeveloper of vehicle-to-vehicle communicationsystems for truck fleets 604/20/2017Raised ( mm)SubsectorSelected Disclosed InvestorsCDH Investments, National Venture Capital, CITICEnergy StorageSecuritiesSolarSmart GridENGIECreadev, Robert Bosch, Inmarsat, Idinvest Partners, BPIFrance, Ginko Ventures, KPN, Orange Digital Ventures,Swisscom, FoxconnEnergy Storage SDIC Fund ManagementAgTechGroupe Lune Rouge, Cycle Capital Management, BDCVenture CapitalAdvancedDelphi GrowthIntel Capital, Omnitracs, Denso, Nokia Growth Partners,AdvancedCastrol innoVentures, Lockheed Martin, UPS StrategicTransportation Enterprise Fund, Volvo Group Venture Capital, Mitsui,Schlumberger, Sandhill Angels, US Venture PartnersAsset TransactionsAmountDateCompany4/28/2017Esco n Solar4/25/2017Atlantic Energias Loan for development of 12 wind farms in Brazil,Renovaveistotaling 207 MW4/20/2017Octopus Energy Refinancing of a 400mm bridge facility tied to aInvestments522 MW UK solar portfolio4/20/2017NTRTransaction DescriptionRaised ( mm)Subsector 170SolarANZ Bank, Bank of Tokyo-Mitsubishi UFJ, Westpac 97SolarPrudential Financial 217WindBrazil Development Bank 624SolarBanca IMI, Barclays, BNP Paribas, La Caixa, Royal Bank ofScotland and Santander 71WindMUFG 179SolarKfW, Al Barid Bank, Attijariwafa Bank 53WindKfW Ipex-Bank, Caisse d’Epargne 105GeothermalNDSolarSociete Generale, MLAs, Helaba, SMBC, BPI France 20SolarNational Australia Bank, Industrial and Commercial Bank ofChina, Australian Renewable Energy AgencyNordLink HVDC subsea connector between Norwayand Germany 380Smart GridLoan for construction of interstate transmissionsystems for solar power projects 175SolarDebt financing of 142 MW Ross River solar projectin Queensland, AustraliaDebt financing of a 92 MW solar project in NorthCarolinaLoan for 29 MW wind farm in EnglandMoroccan Agency Financing of the 170 MW NOOR solar facilities in4/19/2017for Solar Energy MoroccoLoan for two wind farms located in the Picardie andChampagne-Ardenne regions in France, which are apart of a 170 MW portfolio4/12/2017Neoen4/12/2017Zorlu EnergyFinancing package for a 165 MW capacityexpansion4/12/2017EDF EnergiesNouvelles,DiamondGeneratingRefinanced a 111 MW portfolio of three solarfacilities in France4/10/2017Beijing Jingneng Refinancing of the Gullen Range solar project inClean EnergyNew South Wales4/4/2017TenneT4/7/2017Grid Corp. ofIndiaSource: FactSet, company announcements, GCA estimates, SEC filings and third party providers.Selected Disclosed InvestorsEuropean Bank for Reconstruction and Development,Akbank, Turkiye Is Bankasi and Turkiye Sinai KalkinmaBankasiEuropean Investment BankAsian Development BankGCA / 3
Comparable Companies Trading AnalysisDiversified Industrials and PowerInfrastructureCompanyPrice as of4/28/2017Price as a %of 52 WkHighMarketValue( mm)Enterprise(1)Value( mm) 252,466 121,810 95,338 99,973 59,974 33,384 34,285 57,841 54,198 39,022 46,777 33,929 38,885 22,280 20,235 17,216 12,279 8,954 5,540 6,974 302,519 144,009 113,889 106,400 88,960 78,557 72,080 68,993 53,144 53,042 49,125 41,504 38,844 27,392 19,565 18,178 15,500 7,833 7,577 6,704EV as a Multiple of(2)EBITDA2017E2018E(3)Price/ Earnings2017E2018ENet Debt/2017EEBITDADebt/EVDiversified IndustrialsDiversified IndustrialsGESiemensUnited anaherABBJohnson ControlsSchneiderEaton CorpEmersonRoper TechnologiesRockwellLegrandDoverOMRONHitachiAlstom 28.99 131.60 118.99 131.14 102.26 144,000 2,404 83.33CHF24.36 41.57 72.50 75.64 60.28 218.70 157.35 59.43 78.88 4,665 2,871 9%23.1%Energy InfrastructurePrimary Equipment and Power ElectronicsTyco Electronics 77.37DeltaNT 170.00Sensata 41.18NGK 2,381Fuji 611.00Yaskawa 2,129LSIS 50,800SPX 24.0697.1%94.7%90.9%92.4%89.5%92.8%96.6%85.5% 27,468 14,636 7,047 6,997 4,092 5,094 1,339 1,029 30,647 13,626 9,858 6,810 5,477 5,191 1,566 1,286MeanMedianEPC and ServicesGrupo ACSAccionaAECOMFluorJacobsQuantaMasTecAmec Foster WheelerDycom IndustriesStantecBalfour BeattyPrimorisBilfingerTeam, Inc.Mistras Group 34.03 75.74 34.21 51.32 54.92 35.44 44.15 5.43 105.66C 35.03 2.92 22.97 39.88 26.90 95.1%97.5%78.7%97.3%67.8%85.0% 11,661 4,723 5,313 7,171 6,649 5,265 3,647 2,740 3,320 2,925 2,604 1,182 1,920 802 643MeanMedian 14,559 11,046 8,907 6,928 6,368 5,748 4,642 4,116 4,050 3,511 2,874 1,308 1,253 1,123 727Source: FactSet, SEC filings and third party providers. Values in U.S. Dollars. Share prices shown in local currencies.(1)Enterprise Value Market Value of Equity Debt Preferred Equity Minority Interest - Investments in Affiliates - Cash and Marketable Securities.(2)2017 and 2018 EBITDA Multiples exclude multiples over 35x.(3)2017 and 2018 Price/Earnings Multiples exclude multiples over 50x.GCA / 4
Comparable Companies Trading AnalysisEnergy TechnologyCompanyPrice as of4/28/2017Price as a %of 52 WkHighMarketValue( mm)EnterpriseValue (1)( mm)EV as a Multiple ofEBITDA (2)2017E2018EPrice/ Earnings (3)2017E2018ENet Debt/2017EEBITDADebt/EVEnergy TechnologySmart Grid SolutionsAMETEKKeysightItronMueller IndustriesESCO TechnologiesBadger MeterSmart Metering SystemsSMASilver Spring NetworksEnerNOCUtilitywiseEnphase 57.20 37.43 64.85 32.04 58.85 39.75 5.52 23.76 11.41 5.65 1.43 2.2%70.5%44.1% 13,157 6,421 2,506 1,846 1,514 1,157 639 898 606 172 145 100 14,781 6,617 2,696 2,240 1,642 1,184 759 523 487 188 157 116MeanMedianEnergy StorageTeslaPanasonicBYDSamsung SDIEnerSysBallardPlug PowerMaxwell TechnologiesFuelCell EnergyHydrogenicsUltralife 314.07 1,331HK 45.85 137,500 83.11C 4.47 2.24 6.10 1.15C 10.19 5.7%90.2% 51,224 29,280 19,032 8,395 3,609 571 475 199 49 93 85 57,469 28,825 24,441 7,572 3,784 504 496 173 144 97 74MeanMedianLED LightingAcuity BrandsHubbellOSRAMUniversal Display ulseDialightRevolution LightingEnergy Focus 176.10 113.13 61.49 89.35kr365.50 21.88NT 30.00 19.15 33.00 21.08 9.93 8.85 99.7%89.0%96.5%38.1% 7,765 6,227 6,653 4,206 1,591 2,129 1,085 907 1,339 538 418 185 36 7,658 6,842 6,232 3,870 1,696 1,690 1,181 1,036 996 526 407 229 20MeanMedianEnergy/Facilities ManagementEMCORABMCarillionMITIEAmerescoWilldan 65.74 43.19 2.23 2.10 6.45 28.3789.5%95.9%73.8%71.4%96.3%78.0% 3,894 2,405 1,239 976 293 243MeanMedian 4,009 2,668 1,499 1,319 427 rce: FactSet, SEC filings and third party providers. Values in U.S. Dollars. Share prices shown in local currencies.(1)Enterprise Value Market Value of Equity Debt Preferred Equity Minority Interest - Investments in Affiliates - Cash and Marketable Securities.(2)2017 and 2018 EBITDA Multiples exclude multiples over 35x.(3)2017 and 2018 Price/Earnings Multiples exclude multiples over 50x.GCA / 5
Comparable Companies Trading AnalysisRenewablesCompanyPrice as of4/28/2017Price as a %of 52 WkHighMarketValue( mm)Enterprise(1)Value( mm)EV as a Multiple of(2)EBITDA2017E2018E(3)Price/ Earnings2017E2018ENet Debt/2017EEBITDADebt/EVRenewablesIntegrated PV and PV ManufacturingHanwhaSunPowerCanadian SolarYingli Green EnergyFirst SolarJA SolarReneSolaSolarWorld 39,950 6.94 13.30 2.66 29.55 7.01 2.43 3.4497.9%31.6%67.7%51.0%49.7%79.3%33.6%41.0% 2,986 962 769 48 3,081 333 49 56 15,595 2,552 2,203 1,865 1,271 722 538 363MeanMedianSolar DevelopmentAbengoaSunrunVivint SolarScatec SolarEtrion .03 5.29 3.00kr38.90C .313.2%62.6%73.9%91.1%76.5% 32 554 331 469 76 11,346 1,789 1,247 1,002 264MeanMedianIPPsEDPAESNRGNorthland PowerBoralexAtlantic PowerAlterra Power 3.03 11.31 16.90C 24.13C 20.89C 3.44C 4.7490.4%84.9%88.6%96.0%95.6%93.7%63.2% 12,065 7,457 5,342 3,045 1,158 288 202 35,111 29,227 23,538 7,750 2,184 1,348 504MeanMedianWind and OtherVestasXinjiang GoldwindGamesaSuzlonOrmatSinovelNordexTPI Compositeskr588.00HK 11.34 19.84 20.65 39.50 1.76 13.84 19.6599.3%83.4%98.2%96.5%92.8%58.9%48.6%84.3% 19,074 3,989 5,981 1,613 1,557 1,539 1,462 663MeanMedian 15,068 6,303 5,150 3,425 2,138 1,560 1,450 x17.7x15.4x16.1x2.8x3.1x28.4%22.9%Source: FactSet, SEC filings and third party providers. Values in U.S. Dollars. Share prices shown in local currencies.(1)Enterprise Value Market Value of Equity Debt Preferred Equity Minority Interest - Investments in Affiliates - Cash and Marketable Securities.(2)2017 and 2018 EBITDA Multiples exclude multiples over 35x.(3)2017 and 2018 Price/Earnings Multiples exclude multiples over 50x.GCA / 6
Comparable Companies Trading AnalysisYieldCosCompanyPrice as of4/28/2017Price as a %of 52 WkHighMarketValue( mm)Enterprise(1)Value( mm)EV as a Multiple of(2)EBITDA2017E2018E(3)Price/ Earnings2017E2018ECurrentYieldDebt/EVYieldCosNorth American YieldCosBrookfield RenewablesNextEra Energy PartnersNRG YieldAtlantica YieldTerraForm PowerPattern EnergyTransAlta RenewablesInnergex8point3C 41.67 34.65 17.34 20.84 12.59 22.02C 15.59C 13.94 12.3698.7%99.1%97.5%91.1%85.7%87.6%95.9%88.2%71.3% 9,036 5,401 3,193 2,089 1,353 1,929 2,852 1,105 977 27,759 9,473 8,938 7,391 6,791 4,271 3,629 3,081 1,500MeanMedianEuropean YieldCosSaeta YieldRenewables InfrastructureGreencoat UK WindNextEnergy Solar FundBluefield Solar IncomeJohn Laing EnvironmentalForesight Solar 9.07 1.09 1.26 1.14 1.15 1.10 .9296.0%97.1%99.9%99.6%99.8%99.4%92.9% 740 1,321 925 673 550 484 62 1,909 1,302 1,019 671 518 479 57MeanMedianOther International YieldCosTerraForm Global 4.7596.0% 564 1,637MeanMedianMLPsGreen PlainsEnviva 23.00 29.1577.1%95.3%MeanMedian 889 767 1,712 3.5x13.5x4.7%4.7%49.1%49.1%Source: FactSet, SEC filings and third party providers. Values in U.S. Dollars. Share prices shown in local currencies.(1)Enterprise Value Market Value of Equity Debt Preferred Equity Minority Interest - Investments in Affiliates - Cash and Marketable Securities.(2)2017 and 2018 EBITDA Multiples exclude multiples over 35x.(3)2017 and 2018 Price/Earnings Multiples exclude multiples over 50x.GCA / 7
Comparable Companies Trading AnalysisAgTech and Building ProductsCompanyPrice as of4/28/2017Price as a %of 52 WkHighMarketValue( mm)Enterprise(1)Value( mm)EV as a Multiple of(2)EBITDA2017E2018E(3)Price/ Earnings2017E2018ENet Debt/2017EEBITDADebt/EVAgTechLarge Crop / Life mBunge LimitedMosaicAlico 116.61CHF462.40 45.75C 128.12 79.03 26.93 29.9599.4%99.4%95.6%87.2%95.6%78.4%91.7% 51,169 43,004 26,108 12,947 11,094 9,453 250 58,063 45,145 31,532 17,443 14,356 12,636 468MeanMedianIrrigation / EquipmentDeereCNH IndustrialKubotaMahindra & MahindraToroAGCOValmontJainRaven IndustriesLindsay 111.61 11.10 1,753 1,335 64.92 63.99 152.35 112.00 31.00 96.5% 35,553 15,114 19,519 12,885 6,984 5,084 3,437 821 1,119 923 65,791 34,611 25,904 19,520 7,164 6,751 3,755 1,411 1,068 %20.6%Building, Products & MaterialsMulti-IndustryCRHSaint-GobainMascoOwens CorningBeacon Roofing SupplyArmstrong World IndustriesGriffon CorporationSimpson ManufacturingGibraltar 36.32 49.55 37.02 60.85 49.57 46.75 24.00 41.71 39.2598.6%98.1%98.5%96.9%95.1%97.4%88.4%86.2%81.7% 30,472 29,962 11,823 6,809 2,978 2,517 1,134 1,988 1,240 36,660 36,414 14,148 9,002 4,007 3,246 2,047 1,820 1,279MeanMedianSustainable Products/MaterialsKingspanCabot CorporationHeadwatersTrexQuanexDIRTT Environmental SolutionsAspen Aerogels 31.94 60.19 23.76 73.19 20.40C 6.62 4.06100.0%98.1%99.0%93.6%93.2%88.1%60.5% 6,217 3,743 1,779 2,152 702 411 95MeanMedian 6,745 4,592 2,462 2,133 961 357 77Source: FactSet, SEC filings and third party providers. Values in U.S. Dollars. Share prices shown in local currencies.(1)Enterprise Value Market Value of Equity Debt Preferred Equity Minority Interest - Investments in Affiliates - Cash and Marketable Securities.(2)2017 and 2018 EBITDA Multiples exclude multiples over 35x.(3)2017 and 2018 Price/Earnings Multiples exclude multiples over 50x.GCA / 8
Comparable Companies Trading AnalysisWaterCompanyPrice as of4/28/2017Price as a %of 52 WkHighMarketValue( mm)EnterpriseValue (1)( mm)EV as a Multiple ofEBITDA (2)2017E2018EPrice/ Earnings (3)2017E2018ENet Debt/2017EEBITDADebt/EVWaterEfficiency / ProcessPentairFlowserveRexnordItronWatts WaterCITIC EnvirotechBadger MeterLindsayCalgon CarbonThermon GroupAquaVenture HoldingsWabagPure TechnologiesC 64.51 50.87 24.40 64.85 62.20S .79 39.75 86.86 14.55 20.50 18.37 670.60C 3.7%69.8%91.0%69.5% 8,598 6,638 2,524 2,506 2,127 1,265 1,157 923 738 661 485 328 180 11,737 7,862 3,721 2,696 2,443 1,814 1,184 940 926 671 533 347 176MeanMedianMonitoring & ComplianceEcolabXylemWatts WaterHyfluxMueller Water ProductsSelect Energy ServicesAegionLayne 129.09 51.41 62.20S .56 11.25 15.37 22.82 7.9799.7%93.5%87.5%87.4%79.2%92.9%85.5%69.8% 37,443 9,238 2,127 312 1,825 752 771 158 43,827 11,315 2,443 2,073 1,954 1,021 1,015 251MeanMedianHeating & CoolingA.O. SmithLennoxAAONUponorComfort Systems USA 53.88 165.39 36.65 17.39 36.7098.6%95.6%97.1%99.4%92.5% 9,346 7,058 1,929 1,386 1,368 8,993 8,113 1,885 1,628 1,338MeanMedianDistributionAmerican Water WorksSUEZVeoliaSevern TrentAqua AmericaAmerican States WaterSJWConnecticut Water ServiceMiddlesex Water CompanyYork WaterArtesian 79.76 15.09 18.99 23.25 33.09 44.52 48.84 53.67 38.12 37.50 94.1%95.1% 14,176 9,296 10,699 7,090 5,876 1,630 1,001 608 621 482 350MeanMedian 21,263 21,243 20,960 13,353 7,767 2,041 1,427 842 773 563 34.5%28.0%Source: FactSet, SEC filings and third party providers. Values in U.S. Dollars. Share prices shown in local currencies.(1)Enterprise Value Market Value of Equity Debt Preferred Equity Minority Interest - Investments in Affiliates - Cash and Marketable Securities.(2)2017 and 2018 EBITDA Multiples exclude multiples over 35x.(3)2017 and 2018 Price/Earnings Multiples exclude multiples over 50x.GCA / 9
Comparable Companies Trading AnalysisAir and Environmental Services, IndustrialBiotechnology and Advanced TransportationCompanyPrice as of4/28/2017Price as a %of 52 WkHighMarketValue( mm)EnterpriseValue (1)( mm)EV as a Multiple ofEBITDA (2)2017E2018EPrice/ Earnings (3)2017E2018ENet Debt/2017EEBITDADebt/EVAir and Environmental ServicesSolid WasteWaste ManagementRepublic ServicesWaste ConnectionsCovantaAdvanced Disposal ServicesCasella 72.78 62.99 92.02 14.55 23.78 15.0597.6%98.3%98.1%84.5%98.7%99.5% 32,164 21,296 16,112 1,906 2,095 630 41,197 28,980 19,840 4,600 4,017 1,134MeanMedianSpecialty WasteStericycleClean HarborsDarling IngredientsUS EcologyHeritage-Crystal CleanNewalta 85.34 58.11 15.13 47.15 15.05C 2.0568.6%97.7%95.0%87.3%89.9%70.7% 7,276 3,324 2,492 1,028 346 132 10,193 4,655 4,231 1,290 374 367MeanMedianPollution ControlDonaldsonCalgon CarbonCECOAdvanced Emissions Solutions 46.28 14.55 11.29 9.4097.1%77.4%75.9%76.7% 6,114 738 391 207 6,397 926 477 4.0%50.8
D.E. Shaw Interest in a 921 MW renewable energy portfolio Solar / Wind ND ND ND 4/12/2017 Canadian Solar Shenzhen Energy Group Two solar farms in China, totaling 70 MW Solar 100 ND ND 4/10/2017 Enel, DIF Reach Solar Energy Acquisition of a 50% interest in a 138 MW solar project in South Australia Solar 158 ND ND 4/10/2017 Interstate Power & Light