Transcription
Deloitte’s 10 commandments forEffective Dashboard Design
The 10 commandmentsFollow the following rules to create an effective and user friendly dashboard123What’s your point?Chart choice can make or break the comprehension45Use 1 color and 50 shades of another colorEase of use may be invisible, but its absence sureisn’tGood DesignCleanliness makes it easier to see the details678Location, location, locationDo not overload your dashboardSpend time on your text – not only thecharts10 9Moving to Mobile First
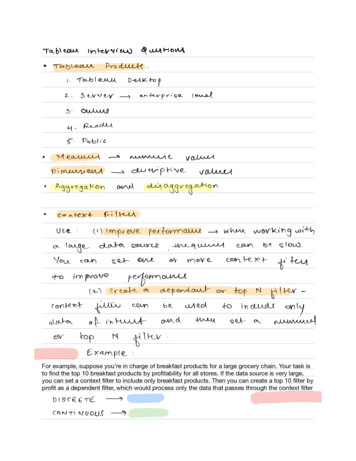
What’s your pointKnow the message or goal that you want to getacross before thinking about the framework orchart typeThe most important question to ask yourself before buildinga dashboard is “What’s your point?”Chart choice can make or break thecomprehensionThe most well-suited chart type is set by themessage it has to conveyAll charts are trying to demonstrate one of four possibleeventualities: What is the message that the dashboard as a whole should convey? Relationship What should people remember / have learned after using it? Comparison Composition DistributionExample: Chart showing the absolute Actual & Budget values“Asking the most important questionsharpens the thinking and the messagingsurrounding the data and, in doing so,reveals the best way to visualize the data“”“Example: Bar Chart showing all categoriesThe right chart for your data and messagewill make for a much more interesting andinfluential chart that will tell the storyalmost by itself“”
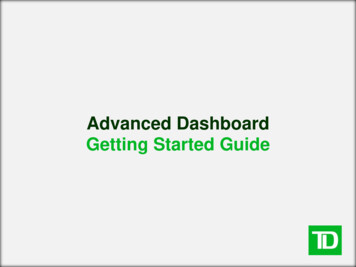
Location, location, locationUse 50 Shades of Grey & 1 ColorMake sure every element on the page is aligned toan underlying gridDesign your dashboard in grey tones and use onecolor to draw attentionAll elements of a dashboard should adhere to an underlying,invisible, grid structure A grid is a structure made up of a series of straight guidelines. It divides the page into a set of identical columnsNothing screams unprofessionalism like a badly aligned dashboardThere are several reasons why the excessive use of colors isharmful for understanding a dashboard Most dashboards feature red for bad and green for good.However, 10% of the male population is color blind and cannot seethe difference.Your eyes bounce around not knowing where the important informationis“Proper alignment will make dashboardsvisually more appealing, easier for users toscan over a page, and sub-consciouslyalso offers a calmer reading experience“”“Focus on creating a dashboard that drawsattention intuitively to the areas that needit most, not that the house style colors orstoplight palette are implemented“”
Cleanliness makes it easier to see thedetailsRemove all redundant or obsolete elements from theDo not overload your dashboardDesigning a dashboard aims at telling a story. A simple, clearand accurate presentation of data is required for directingattention to the information that tells that story.A common misperception is that more information leads to moreadded value. In fact dashboards were invented to provide at aglance insights and serve as a solution to information overload, not torecreate this overload.pageRemove all redundant or obsolete elements from thepageExample: overloaded dashboardExample: messy table design“To find signals in data,“”we must learn to reduce the noise“Perfection is achieved not when there isnothing more to add, but when there isnothing left to take away“”
Ease of use may be invisible, but its absencesure isn’tSpend time on your text – not only thechartsDon’t make your user think. An intuitive design is vital forusers to effectively use your dashboard!A dashboard with well executed typography will look more professional, neater and better organizedDo not underestimate the difference a good userinterface design can makeMost underestimate the power that good typesettinghas on the effectiveness of a dashboardAnd the golden rule: Make sure to test your design withvolunteers. Someone taking a fresh look at your design canspot things you didn’t even consider.What is the user question this page is answering?Wrong choice of two fonts; the difference is hard to tell“One should aim not at being possible tounderstand, but at being impossible tomisunderstand“”“Typography is the use of type to advocate,communicate, celebrate, educate,elaborate, illuminate, and disseminate.Along the way, the words and pagesbecome art“”
Moving to Mobile FirstGood DesignAlways keep in mind that your dashboard may beviewed on a wide range of devicesFollow the rules set out by the companies that ruledesign space – don’t try to reinvent the wheelyourselfResponsive design is an approach aimed at providing anoptimal viewing and interaction experience across a widerange of devices, from desktop monitors to smartphonescreensBy using popular design styles you can simply create tight,consistent, clean, and minimalistic dashboards without having toreinvent the wheel yourselfNon responsive design will only show a small section of thedashboard“The web’s moved beyond the desktop,and it’s not looking back“”No consistency in the design and too bright and to much differentcolors“The details are not the details.They make the design.“”
Contact detailsFeel free to contact us to learn more about dashboard designAlfredo Maria Garibaldiagaribaldi@deloitte.itDaniele Bobbadbobba@deloitte.itMarco Leanimleani@deloitte.itGiuseppe Ficaragficara@deloitte.it
Deloitte refers to one or more of Deloitte Touche Tohmatsu Limited, a UK private company limited by guarantee (“DTTL”), its network of member firms, and their related entities. DTTL and each of its member firms are legallyseparate and independent entities. DTTL (also referred to as “Deloitte Global”) does not provide services to clients. Please see www.deloitte.nl/about for a more detailed description of DTTL and its member firms.Deloitte provides audit, consulting, financial advisory, risk management, tax and related services to public and private clients spanning multiple industries. With a globally connected network of member firms in more than 150countries and territories, Deloitte brings world-class capabilities and high-quality service to clients, delivering the insights they need to address their most complex business challenges. Deloitte’s more than 220,000 professionalsare committed to making an impact that matters.This communication contains general information only, and none of Deloitte Touche Tohmatsu Limited, its member firms, or their related entities (collectively, the “Deloitte network”) is, by means of this communication,rendering professional advice or services. No entity in the Deloitte network shall be responsible for any loss whatsoever sustained by any person who relies on this communication. 2016 Deloitte Italy
Design your dashboard in grey tones and use one color to draw attention There are several reasons why the excessive use of colors is harmful for understanding a dashboard Most dashboards feature red for bad and green for good. However, 10% of the male population is color blind and cannot see the difference. “ “” Proper alignment will make dashboards visually more appealing, easier .