Transcription
Pervasive Hurdles to Effective Dashboard DesignStephen FewVisual Business Intelligence NewsletterJanuary 2007Most dashboard software cannot produce dashboards that demonstrate the effective visualdesign standards that I advocate. These products usually fail due to one or more of thefollowing three problems:1. Important dashboard display media (display widgets) are not provided2. Display media are poorly designed for dashboard communication3. Display media cannot be positioned on the dashboard and sized as neededI believe that it is accurate to say, in fact, that most dashboard software still suffers from allthree of these problems. Some vendors are currently only rushing to address is the first ofthese three problems by adding display media that are particularly useful for dashboardcommunication. This effort, however, is usually restricted to the most obvious omissions,such as sparklines and bullet graphs, rather than stepping back and thoughtfully asking whatnew display media or alterations to existing media would improve dashboards.Few vendors have taken the time to address the second and third problems. They churn outnew meters and gauges like they’re candy (and most of them are), but they rarely take thetime to design the visual appearance and functionality of these display media in a way thatproduces the clearest, richest, and most efficient communication possible. Most dashboardproducts also remain locked into a rigid layout structure that prevents the flexible placementand sizing of items (charts, text, icons, etc.) that is required to produce a dense informationdisplay that can be rapidly monitored.Allow me to more precisely explain the nature of each of these problems.Missing Dashboard Display MediaDashboards are used to rapidly monitor what’s going on. Displays that are used for rapidmonitoring must be designed in particular ways, which differ from the design requirements ofother forms of information display, such as PowerPoint presentations and printed reports. Forinstance, dashboard display media must present measures of what’s going on, usually in thecontext of some comparison, such as a target, to express performance, and do so in a waythat can be perceived and understood at a glance, even when surrounded by a dense arrayof other information.This usually requires graphical media, which must often be displayed in a small amount ofspace. Many of the graphs that we have used for years work quite well on dashboards,including bar and line graphs, but there is a need for new display media as well. EdwardPerceptual EdgePervasive Hurdles to Effective Dashboard DesignPage 1
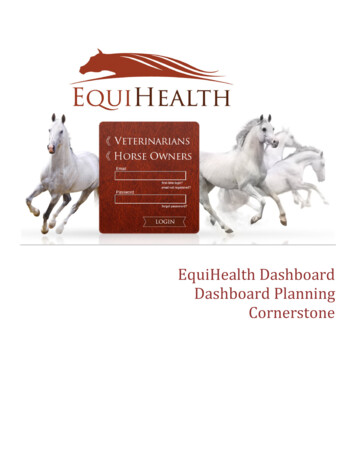
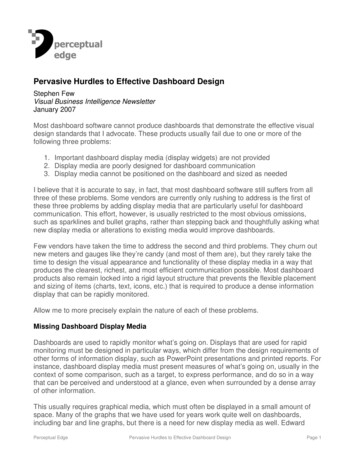
Tufte’s sparklines and my bullet graphs are two such media, but are certainly not the onlypossible candidates. The problem is, most dashboard vendors still haven’t picked the lowhanging fruit—sparklines and bullet graphs—let alone taken the time to consider what elsemight be useful. Vendors have the opportunity to pay attention to how their customers areusing their products and to recognize when information cannot be displayed with any of theexisting media that they offer.Poorly Designed Display MediaMost dashboard software features display media that “look marvelous” but communicatepoorly. If vendors invested as much time in designing display media that actually work asthey invest in designing cute photo-realistic widgets that look like thermometers or automobiledashboard gauges, they would have much more to offer. They need to slow down and takethe time needed to consider how dashboard display media are used and to test theireffectiveness. No value is gained by making dashboard display media look like somethingthat they are not, especially when the result is cluttered with visual decoration that distractsfrom the data. If the information that people need is obscured by visual fluff, the dashboardfails.Look at this dashboard by Axiom Systems:Figure 1: A dashboard for monitoring orders, designed by Axiom Systems.Enormous effort was dedicated to the creation of display widgets that look like controls thatyou might find on an old electronic control board, such as one for mixing sound. Most of themeasures were designed to look like LED (light-emitting diode) meters, with tall stacks ofgreen, yellow, or red light horizontal bands of light set in a framework of burnished metal. OldPerceptual EdgePervasive Hurdles to Effective Dashboard DesignPage 2
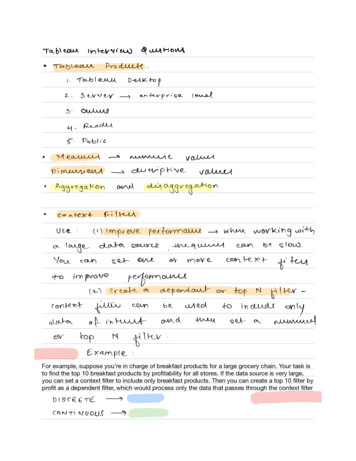
audio mixers used LED meters because that was the state of the art, the best that technologycould offer at the time, but a computer screen is capable of displays that are light yearsbeyond and much easier to read than LED meters.Look at this pie chart that was created for a dashboard using Business Objects’ productCrystal Xcelsius. Notice how the simulated reflection of light on the surface of the piechanges the colors, making it impossible to determine which slice corresponds to which itemin the legend. If you don’t believe me, give it a try.Figure 2: The lighting effects that are built intothis display widget undermine its effectiveness.When light reflects off the shiny surface of an object in the real world, making it hard to seeand painful to look at, we find it annoying. Why would we ever want to duplicate this effect ona dashboard? Yet a great deal of effort went into making this effect available in CrystalXcelsius.I’ve also found that many dashboard display media are much too rigid in design, includingelements that tailor them for specific types of information and interaction, which cannot beturned off. For instance, consider a line graph that adds to what’s usual the following set ofattributes: A slider control that allows you to move forward or backward through time such thatonly a portion of the full set of data is visible at any particular momentA print button that causes the line graph to be printedAn expand button that causes the line graph to open in a separate window as a largerversion of the same graphLarge data points to mark each value along each lineA drop-down listbox that contains the items of a categorical variable, such as regions,which is used to filter the data based on the item that is selectedAssuming that the graph is well designed, this set of controls and attributes might workperfectly well for a particular set of circumstances that match its features, but what if youdon’t want the slider control or the print button or one of the other features, yet there is noway to turn them off? I’ve seen huge (and I mean huge!) libraries of dashboard displaywidgets that are nothing more than slightly different, specialized variations of normal bargraphs, line graphs, and so on, which cannot be altered in any way. Developers are forced tofind the one widget that does what’s needed for a particular piece of information, trudgingthrough an extensive library searching for it, often resulting in the frustrating conclusion thatwhat’s needed isn’t available, and the widget that would do the job if only one or two itemsPerceptual EdgePervasive Hurdles to Effective Dashboard DesignPage 3
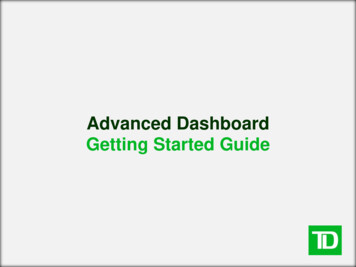
could be turned off or slightly altered allows none of the necessary changes. Only a few welldesigned display media, each endowed with useful features and functions (which can beturned on or off), along with visual attributes that can easily be altered, would provide a muchmore powerful and effective library of display media than the huge and confusing librariesthat vendors promote with such pride.Inflexible LayoutOne of the greatest challenges of dashboard design involves displaying a large amount ofinformation in a small amount of space without creating a cluttered mess. To work,dashboard content must be organized in a way that reflects the nature of the information andthat supports efficient and meaningful monitoring. Information cannot be placed justanywhere on the dashboard, nor can sections of the display be sized simply to fit theavailable space. Items that relate to one another should usually be positioned close to oneanother. Important items should often appear larger, thus more visually prominent, than lessimportant items. Items that ought to be scanned in a particular order ought to be arranged ina manner that supports that sequence of visual attention. In other words, you usually need agreat deal of flexibility in where items are placed and sized to design an effective dashboard.Unfortunately, I’ve found that most dashboard products restrict layout to a grid arrangement.Some are extremely restrictive, requiring a symmetrical arrangement of panels, such as thefour panel arrangement in Figure 3. (Note: Corda Technologies’ CenterView software doesnot restrict layout to the rigid grid that you see in this old example.)Figure 3: This dashboard was designed to fit into a rigid grid offour symmetrical panels using software by Corda Technologies.Perceptual EdgePervasive Hurdles to Effective Dashboard DesignPage 4
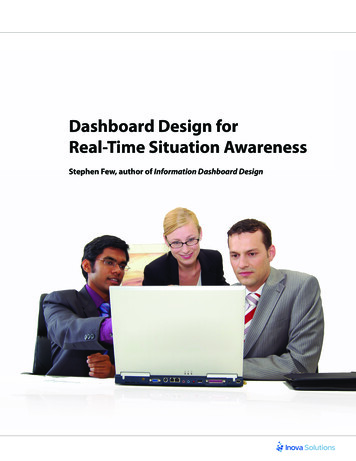
Even when the grid supports more panels, such as shown in Figure 4, it still doesn’t affordthe flexibility that is often necessary avoid compromises in design that undermineeffectiveness.Figure 4: The dashboard by Celequest also appears to conform to a grid layout, which in this case is morecomplex than the layout of Figure #3, but nevertheless still too restrictive for effective dashboard design.Many dashboard vendors promote a self-serve approach to dashboard design, advertisingthe ease with which business people can throw together their own dashboards. Using a rigidgrid system of layout does make it easier for people who lack design skills to place a fewdisplay widgets on the screen. Unfortunately, while this approach may be appropriate forportals, which serve as conduits to information and tasks, and require less design expertiseto serve their purpose, a dashboard, which is used to monitor what’s going on, does requiredesign expertise to work effectively. I suspect the reason that most dashboard products usethe rigid grid layout, however, has less to do with the self-serve model and more to do withthe fact that it is much easier to provide grid layout functionality than the flexible layoutfunctionality that is needed. The TeleSales Dashboard example in Figure 5 from my bookInformation Dashboard Design would be difficult to reproduce with most dashboard products,despite its simplicity, because its layout doesn’t fit into a rigid grid.Perceptual EdgePervasive Hurdles to Effective Dashboard DesignPage 5
Figure 5: This dashboard, which I created for my book Information Dashboard Design, was not restricted bya rigid grid, which allowed me to position and size items as necessary to best arrange the information.Surprisingly, it is actually possible to achieve the layout flexibility that I’m advocating withMicrosoft Excel, a product that we think of as being quite rigid with it tabular layout model, ifyou happen to know some of the tricks that lie under the covers. Charley Kyd’s bookDashboard Reporting with Excel is a good source for learning the dashboard design tricksthat can turn Excel into a viable dashboard platform. Add to this the sparklines and bulletgraphs that are provided by Excel add-in products such as MicroCharts from BonaVistaSystems, and Excel can be used to create dashboard designs that would be impossible withmost dashboard products. I’m not saying that Excel is an ideal platform for dashboards. Itcertainly doesn’t provide all of the functionality that a good dashboard product ought toinclude (for example, great data connectivity), but it is a good alternative for now to many ofthe dashboard products that work poorly, despite their high price tags.It is probably only a matter of time before many of the dedicated dashboard products bridgethe gap that currently exists between what’s needed and what they can do. In the meantime,I’ll keep on preaching the same message to the vendors: take the time to understand what’sneeded and give us products that really work.Perceptual EdgePervasive Hurdles to Effective Dashboard DesignPage 6
About the AuthorStephen Few has worked for over 20 years as an IT innovator, consultant, and teacher.Today, as Principal of the consultancy Perceptual Edge, Stephen focuses on datavisualization for analyzing and communicating quantitative business information. He providestraining and consulting services, writes the monthly Visual Business Intelligence Newsletter,speaks frequently at conferences, and teaches in the MBA program at the University ofCalifornia, Berkeley. He is the author of two books: Show Me the Numbers: Designing Tablesand Graphs to Enlighten and Information Dashboard Design: The Effective VisualCommunication of Data. You can learn more about Stephen’s work and access an entirelibrary of articles at www.perceptualedge.com. Between articles, you can read Stephen’sthoughts on the industry in his blog.Perceptual EdgePervasive Hurdles to Effective Dashboard DesignPage 7
Most dashboard software cannot produce dashboards that demonstrate the effective visual design standards that I advocate. These products usually fail due to one or more of the following three problems: 1. Important dashboard display media (display widgets) are not provided 2. Display