Transcription
Issues in Informing Science and Information TechnologyVolume 12, 2015Cite as: Avancena, A. T., & Nishihara, A. (2015). Usability and pedagogical assessment of an algorithm learning tool:A case study for an introductory programming course for high school. Issues in Informing Science and InformationTechnology, 12, 21-43. Retrieved from 7.pdfUsability and Pedagogical Assessmentof an Algorithm Learning Tool:A Case Study for an Introductory ProgrammingCourse for High SchoolAimee Theresa Avancena and Akinori NishiharaTokyo Institute of Technology, Tokyo, Japanaimeetheresa@gmail.com aki@cradle.titech.ac.jpAbstractAn algorithm learning tool was developed for an introductory computer science class in a specialized science and technology high school in Japan. The tool presents lessons and simple visualizations that aim to facilitate teaching and learning of fundamental algorithms. Written tests and anevaluation questionnaire were designed and implemented along with the learning tool among theparticipants. The tool’s effect on the learning performance of the students was examined. Thedifferences of the two types of visualizations offered by the tool, one with more input and controloptions and the other with fewer options, were analyzed. Based on the evaluation questionnaire,the scales with which the tool can be assessed according to its usability and pedagogical effectiveness were identified. After using the algorithm learning tool there was an increase in the posttest scores of the students, and those who used the visualization with more input and control options had higher scores compared to those who used the one with limited options. The learningobjectives used to evaluate the tool correlated with the test performance of the students. Properties comprised of learning objectives, algorithm visualization characteristics, and interface assessment are proposed to be incorporated in evaluating an algorithm learning tool for novicelearners.Keywords: K12-Computer Science Education, Fundamental Algorithms, Algorithm Visualization, Learning Tool Evaluation, Questionnaire ValidationIntroductionResearch on K-12 computer science education has recently gained focus as computer science hasbecome a regular part of the curriculum in several secondary schools and is now considered essential as any of the traditional sciences. Efforts to promote such studies are being done bygroups such as the ACM (Association ofMaterial published as part of this publication, either on-line orComputing Machinery) and the Comin print, is copyrighted by the Informing Science Institute.puter Science Teachers AssociationPermission to make digital or paper copy of part or all of these(CSTA, 2005). In a curriculum report ofworks for personal or classroom use is granted without feeprovided that the copies are not made or distributed for profitACM, it was suggested that a goodor commercial advantage AND that copies 1) bear this noticefoundation on algorithms and their imin full and 2) give the full citation on the first page. It is perplementation is necessary in order tomissible to abstract these works so long as credit is given. Togain programming skills and to learncopy in all other cases or to republish or to post on a server orto redistribute to lists requires specific permission and paymentmore advanced computer science conof a fee. Contact Publisher@InformingScience.org to requestcepts (ACM, 2001). And in a study thatredistribution permission.
Usability and Pedagogical Assessment of an Algorithm Learning Toolproposed a classification of research works on computer science education, one category is ontools that assist teaching, learning, and assessing programming skills (Sheard, Simon, Hamilton,& Lonnberg, 2009).In relation to these, the study presented in this article aims to facilitate learning of algorithmsamong the students of an introductory computer science course through an algorithm learningtool. The first objective is to determine if the tool has an effect on the learning performance of thestudents. Another objective is to determine whether a visualization tool with more input optionsand control has more effects on learning compared to one which offers less input and control options. Along with these goals is the need to determine the scales and items for evaluating an algorithm learning tool in terms of its usability design and pedagogical effectiveness that is appropriate for novice learners. Hence, an evaluation questionnaire for the learning tool was designed andwas conducted among the participants. This study would also like to find out if there is a relationship between the design properties incorporated in the algorithm learning tool and the performance of the students in the written tests in algorithms. This is in line with the plan to build amodel that incorporates design properties of an algorithm learning tool with visualization andlearning performance.The next section of this paper presents related studies, particularly, on Algorithm Visualization.The third section describes the algorithm learning tool. The fourth and fifth sections present theresearch design and the results and discussions, respectively. These are followed by the sectionson conclusion and future and suggested research plans.Related WorkThe learning tool presented in this paper uses the concept of Algorithm Visualization or AV,which is a technology that incorporates graphics and animation of algorithms. The algorithm process is simulated through graphical images that can be controlled by the user (Shaffer et al.,2010). AV is considered to be a subclass of software visualization which includes the development and evaluation of methods for representing software graphically, its structure, execution,and evolution (Diehl, 2007).There is a widespread belief that Algorithm Visualization helps improve computer science education, according to previous surveys (Naps et al, 2002). This is related to the primary objective ofAV, which is to aid computer science students to understand algorithms better (Hundhausen,Douglas, & Stasko, 2002). Studies have shown that visualizations and animations of algorithmsand data structures are incorporated in the curriculum of introductory computer science as theseare considered fundamental topics in CS education (Shaffer et al., 2010).Overview of History of AVDepiction of algorithms using graphical illustrations began in the 1960s but it was the Sorting outSorting video created by Ron Baecker that commenced research in AV technology (Baecker &Price, 1998; Stasko, Hundhausen, Fincher, & Petre, 2004). A number of AV tools were developedsince then and were unofficially classified as either pre-Java or post-Java AVs (Shaffer, et al.,2010). Pre-Java AVs came as packages with pre-generated visualizations. Some of the moreknown pre-Java AVs are: (1) BALSA (Brown ALgorithm Simulator and Animator) (Brown &Sedgewick, 1984); (2) TANGO (Stasko, 1990); and (3) POLKA (Parallel program-focused Object-oriented Low Key Animation) (Stasko & Kraemer, 1993).Post-Java AVs, on the other hand, are distributed as collections of AVs that are platform independent. The more popular ones are: (1) ANIMAL (A New Interactive Modeler for Animationsin Lectures) (Rößling, Schüler, & Freisleben, 2000); (2) JAWAA (Java And Web-based Algorithm Animation) (Pierson & Rodger, 1998); (3) JHAV E (Java-Hosted Algorithm Visualization22
Avancena & NishiharaEnvironment)-another Java-based system and runs on a client-server environment (Naps, Eagan,& Norton, 2000); and (4) TRAKLA2-a project of the Software Visualization Group at HelsinkiUniversity of Technology (Korhonen, Malmi, & Silvasti, 2003).More comprehensive reports of existing and non-accessible AVs are available (Saraiya, 2002;Saraiya, Shaffer, McCrickard, & North, 2004). The Algorithm Visualization (AlgoViz) Portal(http://algoviz.org) created by Virginia Tech University is also a good resource on AVs and haslinks to existing AV systems.The aforementioned AV systems are mostly highly sophisticated and are used by university students. Other visualization projects have been tried among younger learners but instead of AV,these systems employed program visualization (PV). AV and PV are considered distinct as theformer deals more with the abstract descriptions of programs or algorithms while the latter aimsto improve understanding of actual program implementation (Price, Baecker, & Small, 1998).A PV system that was designed to teach Java programming to high school students is Jeliot 2000(Ben-Bassat Levy, Ben-Ari, & Uronen, 2003). Jeliot 3, an extension of Jeliot 2000, provides visualization of the source code and a generated animation of the program’s behavior. It is intendedto visualize the basic features of the Java programming language in introductory programmingcourses (Moreno, Myller, Ben-Ari, & Sutinen, 2004).Another PV system, VILLE, was created for an introductory programming course at the University of Turku in Finland. Providing features such as language independency, parallel execution of aprogram in two different languages, and capability to define new languages, VILLE gives learners an environment to study actual program execution. The study that implemented VILLE focused on the tool’s effectiveness on learning basic programming concepts. Results indicate thatthe tool was beneficial for novice learners without programming background (Rajala, Laakso,Kaila, & Salako, 2008).A recent study which incorporates both Algorithm and Program Visualizations was conducted byOsman and Elmusharaf (2014). They developed a visualized learning environment where the visualization engine was embedded within the program script instead of an external visualizer. Theirresults indicated that the system was effective in enhancing the performance of college studentsdoing a course in data structures (Osman & Elmusharaf, 2014).Pedagogical Effectiveness of AVMost of the research works on pre-Java AVs were focused on introducing innovative featuressuch as displays, specification techniques and interaction techniques. However, in the mid-1990sresearch on AV shifted to its educational contribution (Saraiya, 2002; Saraiya et al., 2004). Sincethen, the impact of AV on learning has been a topic of several studies in computer science education (Grissom, McNally, & Naps, 2003).A meta-study by the group of Hundhausen (Hundhausen et al, 2002) analyzed twenty-four (24)experimental studies on Algorithm Visualization and proposed a taxonomy of scenarios of use ofAV in computer science education enumerated below. Each of these scenarios distinctively describes an educational use of AV technology.1. Lectures. Computer science instructors both in high school and college have used AV toillustrate algorithm operations in a lecture (Brown, 1988).2. Assignments. Teachers give students assignments that require the students to constructtheir own visualizations of the algorithms under study (Stasko, 1997).3. Class discussion. The students present visualizations they constructed to their classmatesand instructor for feedback and discussion.23
Usability and Pedagogical Assessment of an Algorithm Learning Tool4. Laboratories. The laboratory exercises which incorporate AV allow the students to explore algorithms and data structures (Naps, 1990).5. Study. Students taking up computer science courses use AV to study algorithms at theirown pace and at any given time. They either use their own visualizations, those constructed by others or by interactive AV software.6. Office hours. This is the consultation period set by college professors and teaching assistants in which students seek help or ask questions. The instructors may use AV to detecterrors in the students’ programs or use AV to answer students’ questions.7. Tests. Some tests may include questions where a snapshot of the algorithm animation isused and the students need to identify the algorithm (Brown, 1988).Experiments were also carried out to validate the effectiveness of AV as an instructional material(Grissom et al., 2003). These studies present varying results from “no significance” to positiveeducational impact (Shaffer, Cooper, & Edwards, 2007). Studies that showed positive impact ofAV systems focus on the features that make them effective (Rößling, 2009).A study identified four features that can improve the educational effectiveness of AV: (1) Narrative contents and textual explanations for better understanding of the graphical depictions, (2)Feedback on student’s actions to reinforce right or wrong answers for AVs that ask students topredict next steps in the algorithm, (3) Extra time to use AV for tasks that cannot be animated, (4)Advanced features such as display of algorithm behaviors, interfaces to manipulate visualizations,integrated development environments (Urquiza-Fuentes & Velázquez-Iturbide, 2009). Anotherstudy proposed some key features as characteristics of a good AV: ease of use, appropriate feedback, state changes, window management, multiple views, user control, canned examples anddata input, and pseudocode (Saraiya, 2002).Furthermore, studies have shown that a visualization that allows more control of the simulationand supports student interaction and active learning is found to be more helpful and effective(Naps et al., 2002; Saraiya, 2002; Saraiya et al., 2004). Student “engagement” then is a factorconsidered in order to make AV educationally effective (Naps et al., 2002) and that the mannerwith which the students use visualization is deemed more important than the visualizations themselves (Hundhausen et al., 2002). An “engagement” taxonomy was even identified in the workinggroup “Improving the Educational Impact of Algorithm Visualization.” This taxonomy can serveas a framework for research works that aim to determine the pedagogical effectives of AV(Rößling & Naps, 2002). The said taxonomy is comprised of six categories:1. No viewing - no algorithm visualization is used, just plain instruction2. Viewing - several visual representations of the algorithm being studied are available forviewing3. Responding - questions related to the visualization displayed by the system need to be answered by the learners4. Changing - modifications of the visualization, such as setting different input values to testvarious cases, are allowed5. Constructing - users are able to create their own visualization of the algorithm6. Presenting - students are required to present visualization to an audience for feedback anddiscussionThe algorithm learning tool reported in this paper incorporates simple Algorithm Visualizationand is specifically intended for high school students. A number of features mentioned above as24
Avancena & Nishiharawell as the unique characteristics incorporated in the design of the AV created for this study arediscussed in the section on the algorithm learning tool.Evaluation of Algorithm VisualizationWith the role AV plays in computer science education comes the need for its proper evaluation.The features and functions that researchers have been including in AV design have to be assessedif they are pedagogically effective. Studies on AV tests and evaluations have used learning taxonomies such as (the revised) Bloom's Taxonomy and the SOLO Taxonomy in order to explainthe cognitive capacities of learners and to assess whether using AV has an effect on the learningoutcome (Lee & Rößling, 2010).Together with the goal of developing pedagogically beneficial features of AV, Lee and Rößling(2010) proposed that AV can be assessed according to the three properties with which medialearning instruments are usually evaluated:1. Symbol system - refers to texts, graphics, sounds, and animations2. Interactivity - deals with user input engagement3. Didactic structure – refers to pedagogical-based system designAmong the three properties, the third needs more investigation according to Lee and Rößling(2010). They then proposed the Categories of Algorithm Learning Objective or CALO to serve asa pedagogical framework for designing and structuring AV. CALO can be used as a set of objectives for exam items and as a self-evaluating tool for learners in order to measure performancebased on expected learning goals. CALO is based on the seven non-hierarchical learning objectives normally used in CS education (Lee & Rößling, 2010). These objectives include:1. Descriptive - discerning and describing algorithms2. Demonstrative - demonstrating algorithms with graphics or objects3. Decoding - following and tracking algorithms4. Coding - reproducing learned algorithms5. Evaluative - analyzing, comparing, and evaluating algorithms that solve the same set ofproblems6. Appropriative - writing a complete program; evoking, extending, or modifying learned algorithms to solve a given problem7. Originative - developing own algorithms to solve unfamiliar problems (Lee & Rößling,2010).The proponents of CALO invite researchers to adapt these categories in their own studies. Theysuggest that AV researchers may consider what features and functions can be incorporated intoAV to support learners’ skills based on those categories.Another study that looked into the assessment of algorithm visualization is that of UrquizaFuentes and Velázquez-Iturbide (2009), which focused on evaluations that yielded positive results.They classified program and algorithm visualizations systems according to two general criteria inorder to facilitate evaluation, abstraction level and implementation level. The aforementionedstudy considered the evaluation of systems that belong to the first criterion (abstraction level).The evaluations it conducted were mainly on interactive software systems so usability was considered using the following methodologies:25
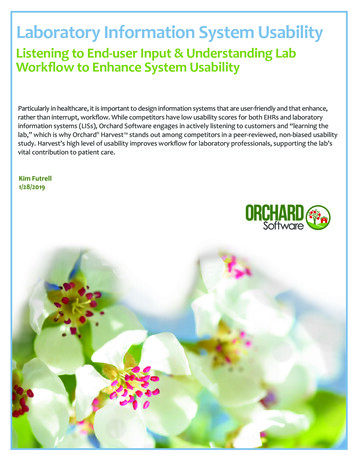
Usability and Pedagogical Assessment of an Algorithm Learning Tool1. Informal evaluations. The students are normally asked about their opinion after using asystem.2. Heuristic evaluations. Experts are the ones who usually perform these evaluations.3. Query techniques. Questionnaires are used when asking students about their opinion ondifferent aspects of the system. Evaluators have partial control of the environment and thetasks performed by students.4. Observational studies. Information is gathered observing how students use the system.5. Controlled experiments. The evaluators have considerable control of the environment, thestudents and the tasks they perform. This kind of evaluation also provides informationabout effectiveness, ease of use, efficiency, and other interesting issues on top of the students’ opinions.( Urquiza-Fuentes & Velázquez-Iturbide, 2009)As usability is considered as an important aspect of interactive systems such as Algorithm Visualization tools, this research used query technique and controlled experiment in the evaluation ofthe algorithm learning tool. Moreover, the Categories of Algorithm Learning Objectives wereused in formulating items for the learning tool’s evaluation questionnaire and the written test onalgorithms. The development of the evaluation questionnaire and the written tests will be furtherdiscussed in the Research Design section.Algorithm Learning ToolThe main material developed for this research is an algorithm learning tool which incorporatesAlgorithm Visualization. The features of the algorithm learning tool were specifically designed tosuit high school students in an introductory computer science class. The tool has two main parts:lecture notes and visualizations. Unlike other visualizations that target university level CS, thelearning tool presented in this paper focuses on four basic algorithms: Linear Search, BinarySearch, Bubble Sort, and Selection Sort. These algorithms, except for Bubble Sort, are consideredessential in introductory computer science courses (ACM, 2013). However, those four were chosen because they are included in the curriculum of the high school where the tool was implemented. Moreover, the original goal for creating the learning tool is to have an instructional and review material for the student participants who are in a special computer science course track forhigh school. The other algorithms included in the school’s curriculum may be incorporated infuture improvements or extension of the learning tool.The learning tool provides lecture notes with descriptions, pseudocode, and illustrations of thealgorithms that are designed for novice learners. The lecture notes, which has texts both in English and Japanese, include descriptions, pseudocode, and simple illustrations of the algorithms.Part of the screenshot of the lecture notes on the Linear Search algorithm is shown in Figure 1.For the visualization of the algorithms, some principles of Algorithm Visualization were applied.A list of the tool’s features include: “textual contents, appropriate feedback, extra time to use AVfor non-animated tasks, input and control menus for the animation, display of algorithm behaviors,variable state changes, ease of use, user control, canned examples and data input, and pseudocodedisplay”, all of which were mentioned in previous studies as characteristics of a good AV (Saraiya, 2002; Urquiza-Fuentes & Velázquez-Iturbide, 2009).26
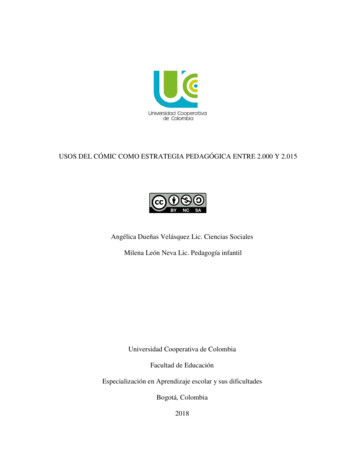
Avancena & NishiharaFigure 1. Screenshot of the lecture notes section of the learning toolIn order to examine if certain levels of engagement would affect the learning performance of thestudents, two types of visualizations are offered by the learning tool: AlgoVis1 – allows moreinput options and control and AlgoVis2 – has limited input options and control. However, bothAlgovis1 and Algovis2 share most of the major features of the visualization. These features areenumerated below.a. Input and Control Panel. This is the menu and control area where the user can set the options for the algorithm visualization and run or stop the code simulation. AlgoVis1 allowsusers to select the algorithm to visualize, set the size of the array used in the animation, assign array values, and choose the speed and manner of simulation. The user can set thespeed from 1 to 10 (slowest to fastest) where 1 is approximately 1 second and 10 is 1/10 ofa second per step. Algorithm animation can run step-by-step by marking the checkbox“Step-by-step” or by choosing the “Step-by-step” option from the list. The size of the array used in the simulation can be from 2 to 15 elements. The values of each element maybe entered by the user or be randomly assigned by the computer. When all the optionshave been set, the “Create Array” button can be clicked to instantiate the array. The searchkey needed for Linear and Binary Search algorithms is entered into the box of the samename. Corresponding buttons are provided for running and terminating the algorithm visualization. A next button is used for the “Step-by-step” execution of the algorithm. Usersof AlgoVis2 can only select the algorithm to simulate and choose from five data sets withpre-assigned values. “Step-by-step” algorithm simulation is not allowed in AlgoVis2.The aforementioned features employ the “viewing” and “changing” levels of the taxonomy of learner engagement proposed by Naps et al. (2002). Screenshots of the input andcontrol panels of the two visualization types are shown in Figure 2.27
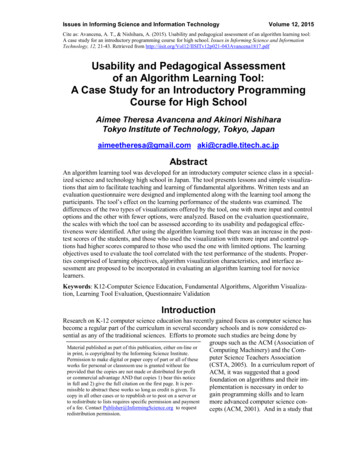
Usability and Pedagogical Assessment of an Algorithm Learning ToolFigure 2. Input and control panels of the algorithm learning toolb. Algorithm Simulation Field. This is the main part of the visualization where the data arrayused to depict search and sort algorithms are shown. This part is almost similar for bothAlgoVis1 and AlgoVis2. The only difference is the height of the array elements. For AlgoVis2 the elements are of the same height while for AlgoVis1, the elements vary inheight depending on the assigned numerical values.c. Pseudocode Display. A C-like code of the algorithm being simulated is displayed and thecode is traced during simulation by highlighting each line.d. Variable Display. The changes in the local variables of the algorithm are shown here.e. Message Box. A description of the line of code being executed is displayed on this box.AlgoVis1 provides more feedback to the user compared to AlgoVis2.The last four features of the two types of visualization are shown in Figures 3 and 4, for AlgoVis1and AlgoVis2, respectively.Figure 3. Screenshot of linear search visualization using AlgoVis128
Avancena & NishiharaFigure 4. Screenshot of linear search visualization using AlgoVis2Research DesignThe algorithm learning tool with algorithm visualization was implemented with the main objective of determining its effects on the learning performance of the students of introductory computer science for high school. In relation to this, suggested evaluation properties for AVs wereused to assess the learning tool. Through these evaluation properties, the objective is to determineif the features of the learning tool can help improve learning performance. In particular, CALO orthe Categories of Algorithm Learning Objectives was incorporated in the design of the tool’sevaluation questionnaire and the written test on algorithms which were also developed for thisstudy. The effect of the algorithm learning tool on the student performance was measured throughthe written pretest and posttest on algorithms.The scores of the students in the written tests on algorithms and their response to the evaluationquestionnaire were considered in the analysis. And in order to evaluate the design of the algorithm learning tool and to assess its usability and pedagogical aspects, the questions below wereformulated. The answers to these questions are presented in the next section.1. Is there an improvement in the learning performance of students after using the algorithmlearning tool?2. Is there a difference in the learning improvement between the group that had more inputand control options of the algorithm visualization and the group with limited options?3. Are the scales and items chosen for the questionnaire appropriate for evaluating the algorithm learning tool?4. How can the questionnaire be validated and improved to better assess the effects of thetool on the learning performance of the students?For questions 1 and 2, the corresponding null hypotheses are that the algorithm learning tool hasno effect on the learning performance of the students and that there is no difference on the learning effects of the two types of visualizations used by the two groups. Questions 3 and 4 pertain tothe questionnaire specifically designed for this study. The said questionnaire was used for evalu-29
Usability and Pedagogical Assessment of an Algorithm Learning Toolating the learning tool’s usability and pedagogical effectiveness. The subsections below givemore details on the design and implementation of the learning tool and the evaluation instruments.MethodsThe study presented in this paper may be considered as a case study because it is focused on asingle group of subjects. However, the experiment could only be conducted once due to time constraints and availability of the participants. Experimental method was used to compare the pretestand posttest scores (dependent variables) of the treatment group (Group A) and the control group(Group B) based on the AV type they used, AlgoVis1 or AlgoVis2, respectively (independentvariable).To find out if there is a general increase in the learning performance of all the students after usingthe learning tool, paired-samples t-test was conducted to compare the scores of the students in thepretest and posttest. In order to determine the differences in the learning effects between the visualization with more input options and control and the one with limited options, independentsamples t-test was conducted to compare the pretest, posttest and gain scores between Group Aand Group B.The students’ responses to the evaluation questionnaire on the usability and pedagogical effectiveness of algorithm learning tool were also examined. The internal consistency of the questionnaire was checked using Cronbach’s Alpha reliability test in order to determine if the questionnaire scales and items are appropriate.The evaluation questionnaire used in the implementation of the learning tool has already undergone a revision after an initial testing of the learning tool conducted one year before. In order tocontinue the process of questionnaire revision and validation, exploratory and confirmatory factoranalyses were performed. This method is based on the two-step model building proposed by Byrne (2001). The first step is to construct a measurement model and test it to determine if the itemsare good indicators of their corresponding factors or properties with which the algorithm learningtool is evaluated. The second step is to build a structural model to check the relationships betweenthe evaluation properties and the learning performance of the students, which, in this case, is theposttest score. The steps followed are similar to the work done in developing a science motivationquestionnaire by Glynn, Brickman, Armstrong, & Taasoobshirazi (2011).ParticipantsStudents from TokyoTech High School of Science and Technology were asked to participate inthe study. These students belong to the Information Systems course track, which offers a specialcomputer science curriculum. At TokyoTech High, students get to choose a specific science andtechnology or engineering track at the end of their first year and they pursue this until they graduate. This scheme is done in order to help them select and prepare for a major in the university.In selecting the target participants, non-probability purposive sampling was used (Patton, 1990)because the focus of the study is on high school students who are in an introductory computerscience course. The sample size is then limited to the actual number of students who belong toClass 2015 of the Information System course track. Ther
since then and were unofficially classified as either pre-Java or post-Java AVs (Shaffer, et al., 2010). Pre-Java AVs came as packages with pre-generated visualizations. . analyzed twenty-four (24) experimental studies on Algorithm Visualization and proposed a taxonomy of scenarios of use of AV in computer science education enumerated below .