Transcription
EHR Usability Test Report of SRS EHR 10.xReport based on ISO/IEC 25062:2006 Common Industry Format for Usability Test ReportsSRS EHR v10.xDate of Usability Test: 12/7/17Date of Report:12/7/17Report Prepared By: Harika Prabhakar, Product Owner, SRS Health201-746-7732hprabhakar@srs-health.com155 Chestnut Ridge Road, Montvale NJ, 07645Table of ContentsEXECUTIVE SUMMARY . 3INTRODUCTION . 4METHOD . 5SRS User Centered Design Process . 5PARTICIPANTS . 6STUDY DESIGN. 7TEST LOCATION . 8TEST ENVIRONMENT . 8TEST FORMS AND TOOLS . 8PARTICIPANT INSTRUCTIONS . 9USABILITY METRICS . 9RESULTS . 11DATA ANALYSIS AND REPORTING . 11DISCUSSION OF THE FINDINGS . 11EFFECTIVENESS . 11EFFICIENCY . 12SATISFACTION . 121
MAJOR FINDINGS . 13AREAS FOR IMPROVEMENT . 14APPENDICES . 15Appendix 1: SAMPLE RECRUITING SCREENER. 16Appendix 2: PARTICIPANT DEMOGRAPHICS . 17Appendix 3: NON-DISCLOSURE AGREEMENT AND INFORMED CONSENT FORM . 19Appendix 4: EXAMPLE MODERATOR’S GUIDE . 21Appendix 5: SYSTEM USABILITY SCALE QUESTIONNAIRE . 292
EXECUTIVE SUMMARYA usability test of SRS EHR v10.x Ambulatory EHR was conducted on 12/7/17 in the offices of PrincetonOrthopaedic Associates, P.A. at 11 Center Drive Monroe Twp, NJ 09931 by SRSHealth. The purpose ofthis test was to test and validate the usability of the current user interface, and provide evidence ofusability in the SRS EHR, the EHR Under Test (EHRUT). During the usability test, 10 clinical and practicestaff matching the target demographic criteria served as participants and used the EHRUT in simulated,but representative tasks.This study collected performance data on one task typically conducted on an EHR:§ 170.315(a)(9) Clinical Decision SupportDuring the 15 minute one-on-one usability test, each participant was greeted by the administrator andasked to review and sign an informed consent/release form (included in Appendix 3); they were instructedthat they could withdraw at any time. Some participants had prior experience with the EHR. Theadministrator introduced the test, and instructed participants to complete a series of tasks (given one at atime) using the EHRUT. During the testing, the administrator timed the test and, along with the datalogger, recorded user performance data on paper and electronically. The administrator did not give theparticipant assistance in how to complete the task.Participant screens were recorded for subsequent analysis. The following types of data were collected foreach participant: Number of tasks successfully completed within the allotted time without assistance Time to complete the tasks Number and types of errors Path deviations Participant’s verbalizations Participant’s satisfaction ratings of the systemAll participant data was de-identified – no correspondence could be made from the identity of theparticipant to the data collected. Following the conclusion of the testing, participants were asked tocomplete a post-test questionnaire. Various recommended metrics, in accordance with the examples setforth in the NIST Guide to the Processes Approach for Improving the Usability of Electronic HealthRecords, were used to evaluate the usability of the EHRUT. Following is a summary of the performanceand rating data collected on the SRS EHR.3
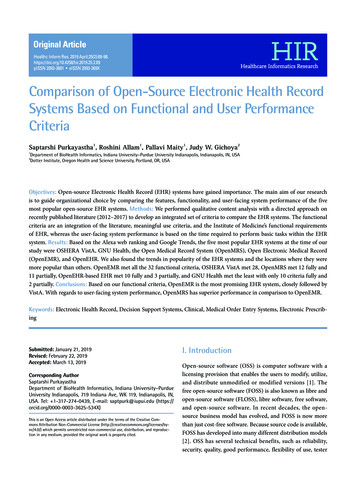
iationTaskTimeTaskRatings#% ofsuccessDeviations(Observed/ Optimal)Deviations(Observed/ Optimal)Time(Seconds)Rating(1 Easy)MeasureTaskClinical Decision Support Measures ConfigurationClinical Decision Support using TOC/DDRCDS Medication ListCDS Problem List and Medication Allergy ListCDS Lab tests and values/resultsLinked Referential CDS and CDS Vitals 1090%0.911.02911.51080%0.911.06165.31.7The results from the System Usability Scale scored the subjective satisfaction with the system based onperformance with these tasks to be: 85.5In addition to the performance data, the following qualitative observations were made:- Major findingsThe test participants were also happy to see that that clinical decision support rules were more medicallyrelevant and tied directly to clinical quality measures. This linkage will lead to more meaningful alertsappearing inside the EHR which in turn will make physicians more likely to review them. The participantsbelieved the inclusion of the new linked referential information would prove to be useful while reviewingthe patient chart. In addition, the users believed the automatic triggering of the CDS alerts upon importingkey clinical data into the patient chart was extremely valuable especially in cases where alert wasdisplayed based on clinical data from a different specialty.- Areas for improvementThe EHR supports a number of CDS alerts and on the admin screen a more apparent visualdifferentiation between the selected vs. unselected CDS alerts would be useful in progressing quicklythrough the selection process.INTRODUCTIONThe EHRUT tested for this study was SRS EHR v10.x. It is designed to present medical information tohealthcare providers in an outpatient ambulatory environment. The SRS EHR consists of various modulesand interfaces design to capture, display, and modify patient clinical data. The usability testing attemptedto represent realistic exercises and conditions.The purpose of this study was to test and validate the usability of the current user interface, and provideevidence of usability in the EHR Under Test (EHRUT). To this end, measures of effectiveness, efficiency4
and user satisfaction, such as time on task, user satisfaction, and deviation from optimal paths, werecaptured during the usability testing.METHODSRS User Centered Design ProcessSRSsoft designed and implemented its own UCD process based upon the ISO 9241-210 industrystandard. The SRS UCD process follows the same principles of human-centered design and fits in to ouroverall quality management system (QMS). The system involves users in the overall design and softwaredevelopment process. The design team includes individuals with skills spanning across multipledisciplines and with different perspectives. The team works to address the entire user experience througha deep understanding of the tasks and workflows required by end users. The process is iterative andrequirements are continually updated to better address the context of use, increase usability, and reduceuser error.The main steps of the process are: Understanding/stating the context of use for the function or module Business requirements are gathered from internal and client stakeholders. These stakeholders are kept up to date with product developments through “Feature team” meetings. Creating design solutions Business Analysis works with “Feature teams” to design several possible solutions andthrough further analysis with stakeholders the solution is refined. Creating user requirements Business analysis creates full requirements documents based on feedback from “Featureteams” Evaluating the solution Solution prototypes are created and vetted against the original understanding of thecontext of use. Performing user centered evaluations Formal summative user testing is performed and the analysis is sent back to the “featureteams”. The results are then used to drive future iterations of the product.The following tasks and modules were developed based on the SRS UCD design process:§ 170.315(a)(9) (Clinical decision support)5
PARTICIPANTSThe testing methods were in accordance with the SRS User Centered Design Process. A total of 10participants were tested on the EHRUT(s). Participants in the study included technicians, managers andPT staff from the orthopaedic specialties. In addition, participants had no direct connection to thedevelopment of or organization producing the EHRUT(s). Participants were not from the testing orsupplier organization. Participants were given the opportunity to have the same orientation and level oftraining as the actual end users would have received.For the test purposes, end-user characteristics were identified and translated into a recruitment screenerused to solicit potential participants; an example of a screener is provided in Appendix 1.Recruited participants had a mix of backgrounds and demographic characteristics conforming to therecruitment screener. The following is a table of participants by characteristics, including demographics,professional experience, computing experience and user needs for assistive technology. Participantnames were replaced with Participant IDs randomly generated from the demographics collection tool sothat an individual’s data cannot be tied back to individual identities.IDGenderAgeEHR Experience(Years)Occupation/RoleCDS ModuleExperience1 188980004Female50-59Manager10Beginner2 189157620Female70-79Clerical2Beginner3 189157638Female20-29Billing Rep1Beginner4 189158003Female50-59Billing Office7Beginner5 189183182Female50-59PT Aide2Beginner6 189240589Female30-3910Beginner7 189242966Male30-390Beginner8 189253210Female50-59Physical TherapyFront DeskCoordinatorIT SystemsSpecialistManager2Beginner9 ician2Moderate10 189680942Ten participants (matching the demographics in the section on Participants) were recruited and tenparticipated in the usability test.Participants were scheduled for 15 minute sessions with 5 minutes in between each session for debriefby the administrator and data logger, and to reset systems to proper test conditions. A spreadsheet wasused to keep track of the participants, and included each participant’s demographic characteristics.6
STUDY DESIGNOverall, the objective of this test was to uncover areas where the application performed well – that is,effectively, efficiently, and with satisfaction – and areas where the application failed to meet the needs ofthe participants. The data from this test may serve as a baseline for future tests with an updated versionof the same EHR and/or comparison with other EHRs provided the same tasks are used. In short, thistesting serves as both a means to record or benchmark current usability, but also to identify areas whereimprovements must be made.During the usability test, participants interacted with one EHR. Each participant used the system in thesame room of the two testing locations, and was provided with the same instructions. The system wasevaluated for effectiveness, efficiency and satisfaction as defined by measures collected and analyzed foreach participant: Number of tasks successfully completed within the allotted time without assistance Time to complete the tasks Number and types of errors Path deviations Participant’s verbalizations (comments) Participant’s satisfaction ratings of the systemAdditional information about the various measures can be found in Section 3.9 on Usability Metrics.TASKSA number of tasks were constructed that would be realistic and representative of the kinds of activities auser might do with this EHR, including:1. Clinical Decision Support:a. Clinical Decision Support Measures Configurationb. Clinical Decision Support using TOC/DDRc. CDS Medication Listd. CDS Problem List and Medication Allergy Liste. CDS Lab tests and values/resultsf. Linked Referential CDS and CDS Vitals SignsTasks were selected based on their frequency of use, criticality of function, and those that may be mosttroublesome for users.PROCEDURESUpon arrival, participants were greeted; their identity was verified and matched with a name on theparticipant schedule. Participants were then assigned a participant ID. Each participant reviewed andsigned an informed consent and release form (See Appendix 3). A representative from the test teamwitnessed the participant’s signature.To ensure that the test ran smoothly, two staff members participated in this test, the usabilityadministrator and the data logger.The administrator moderated the session including administering instructions and tasks. Theadministrator also monitored task times, obtained post-task rating data, and took notes on participantcomments. A second person served as the data logger and took notes on task success, path deviations,number and type of errors, and comments.7
Participants were instructed to perform the tasks (see specific instructions below): As quickly as possible making as few errors Without assistance; administrators were allowed to give immaterial guidance and clarification on tasks,but not instructions on use. Without using a think aloud technique.For each task, the participants were given a written copy of the task. Task timing began once theadministrator finished reading the question. The task time was stopped once the participant indicated theyhad successfully completed the task. Scoring is discussed below in Section 3.9.Following the session, the administrator gave the participant the post-test questionnaire (the SystemUsability Scale, see Appendix 5) and thanked each individual for their participation.Participants' demographic information, task success rate, time on task, errors, deviations, verbalresponses, and post-test questionnaire were recorded into a spreadsheet.TEST LOCATIONThe tests were performed in the exam room where the EHRUT would typically be deployed and used inproduction. Only the participant, the administrator and the data logger were in the test room. To ensurethat the environment was comfortable for users, noise levels were kept to a minimum with the ambienttemperature within a normal range. All of the safety instruction and evacuation procedures were valid, inplace, and visible to the participants.TEST ENVIRONMENTThe EHRUT would be typically be used in a healthcare office or facility. In this instance, the testing wasconducted in an examination room on a computer where interactions with the EHRUT would typically takeplace in real world office scenarios. For testing, the computer used a Windows PC running windows 7with a standard mouse and keyboard.The SRS EHR v10.x system was viewed on a 22 inch vertical monitor in portrait mode. The applicationwas set up by the SRSSoft according to standard operating procedure for client/server installation. Theapplication itself was running on a Windows 2008 Server using a Demo/Training SQL database on a LANconnection. Technically, the system performance (i.e., response time) was representative to what actualusers would experience in a field implementation. Additionally, participants were instructed not to changeany of the default system settings (such as control of font size).TEST FORMS AND TOOLSDuring the usability test, various documents and instruments were used, including:1. Informed Consent2. Moderator’s Guide3. Post-test QuestionnaireExamples of these documents can be found in Appendices 3-5 respectively. The Moderator’s Guide wasdevised so as to be able to capture required data.The participant’s interaction with the EHRUT was captured and recorded digitally with goto meetingscreen capture software running on the test machine.8
PARTICIPANT INSTRUCTIONSThe administrator reads the following instructions aloud to the each participant (also see the fullmoderator’s guide in Appendix 4):Thank you for participating in this study. Our session today will last about 20 minutes. During that timeyou will take a look at an early prototype of SRS EHR v10.x.I will ask you to complete a few tasks using this system and answer some questions. We are interested inhow easy (or how difficult) this system is to use, what in it would be useful to you, and how we couldimprove it. You will be asked to complete these tasks on your own trying to do them as quickly aspossible with the fewest possible errors or deviations. Please do not do anything more than asked. If youget lost or have difficulty I cannot answer help you with anything to do with the system.Please save your detailed comments until the end of a task or the end of the session as a whole when wecan discuss freely. Since this is a test system some of the data may not make sense as it is placeholderdata. We are recording the screen of our session today for our internal use only.Do you have any questions or concerns?Following the procedural instructions, participants were shown the EHR. Once this task was complete, theadministrator gave the following instructions:For each task, I will read the description to you and say “Begin.” At that point, please perform thetask and say “Done” once you believe you have successfully completed the task. I would like to requestthat you not talk aloud or verbalize while you are doing the tasks. I will ask you your impressions aboutthe task once you are done.Participants were then given ten tasks to complete. Tasks are listed in the moderator’s guide in Appendix4.USABILITY METRICSAccording to the NIST Guide to the Processes Approach for Improving the Usability of Electronic HealthRecords, EHRs should support a process that provides a high level of usability for all users. The goal isfor users to interact with the system effectively, efficiently, and with an acceptable level of satisfaction. Tothis end, metrics for effectiveness, efficiency and user satisfaction were captured during the usabilitytesting. The goals of the test were to assess:1. Effectiveness of SRS EHR v10.x by measuring participant success rates and errors2. Efficiency of SRS EHR v10.x by measuring the average task time and path deviations3. Satisfaction with SRS EHR v10.x by measuring ease of use ratingsDATA SCORINGThe following table (Table 1) details how tasks were scored, errors evaluated, and the time data analyzedMeasuresEffectiveness:Task SuccessRationale and ScoringA task was counted as a “Success” if the participant was able to achieve the correctoutcome, without assistance, within the time allotted on a per task basis.The total number of successes were calculated for each task and then divided by9
the total number of times that task was attempted. The results are provided as apercentage.Task times were recorded for successes. Observed task times divided by theoptimal time for each task is a measure of optimal efficiency and was recorded.Optimal task performance time, as benchmarked by expert performance underrealistic conditions, is recorded when constructing tasks. Target task times used fortask times in the Moderator’s Guide were defined by taking multiple measures ofoptimal performance and multiplying each time by a factor of 1.5. This factor allowssome time buffer, as participants are presumably not trained to expert performance.Thus, if expert performance on a task was [x] seconds then optimal task timeperformance was [x * 1.5] seconds. The ratio of reported time to optimal time wasaggregated across tasks and reported with mean.Effectiveness:Task FailuresIf the participant abandoned the task, did not reach the correct answer or performedit incorrectly, or reached the end of the allotted time before successful completion,the task was counted as a “Failures.” No task times were taken for errors.On a qualitative level, an enumeration of errors and error types was collected and isdescribed in the narrative section below.Efficiency:Task DeviationsThe participant’s path through the application was recorded. Deviations occur if theparticipant, for example, went to a wrong screen, clicked on an incorrect menu item,opened an incorrect module, or interacted incorrectly with an on-screen control. Thispath was compared to the optimal path. The number of steps in the observed path isdivided by the number of optimal steps to provide a ratio of path deviation.Optimal paths were recorded in the moderator guide. Task deviations are discussedfurther in the qualitative sections.Efficiency:Task TimeSatisfaction:Task Rating:Each task was timed from when the administrator said “Begin” until the participantsaid, “Done.” If he or she failed to say “Done,” the time was stopped when theparticipant stopped performing the task. Only task times for tasks that weresuccessfully completed were included in the average task time analysis. Averagetime per task was calculated for each task.Participant’s subjective impression of the ease of use of the application wasmeasured by administering both a simple post-task question as well as a postsession questionnaire.After each task, the participant was asked to rate “Overall, this task was:” on a scaleof 1 (Very Easy) to 5 (Very Difficult). These data are averaged across participants.Common convention is that average ratings for systems judged easy to use shouldbe 3.3 or below.To measure participants’ confidence in and likeability of the SRS EHR v10.x overall,the testing team administered the System Usability Scale (SUS) post-testquestionnaire. Questions included, “I thought the system was easy to use” and “Iwould imagine that most people would learn to use this system very quickly.” Seefull System Usability Score questionnaire in Appendix 5.Table 1. Details of how observed data were scored.10
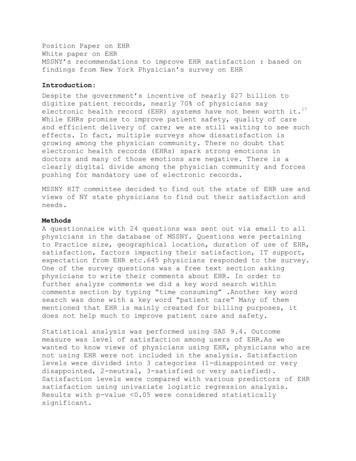
RESULTSDATA ANALYSIS AND REPORTINGThe results of the usability test were calculated according to the methods specified in the Usability Metricssection above. Participants who failed to follow session and task instructions had their data excluded fromthe analyses.There were a few minor issues which may have affected data collection. The task descriptions and theterminology used could have contributed to some hesitation on the part of the user when completingtasks. Efforts were made to use descriptions and terminology which would be familiar to users; however,some users still may have experienced some confusion.The usability testing results for the EHRUT are detailed below (see Table DeviationTaskTimeTaskRatings#% ofsuccessDeviations(Observed/ Optimal)Deviations(Observed/ Optimal)Time(Seconds)Rating(1 Easy)MeasureTaskClinical Decision Support Measures ConfigurationClinical Decision Support using TOC/DDRCDS Medication ListCDS Problem List and Medication Allergy ListCDS Lab tests and values/resultsLinked Referential CDS and CDS Vitals 1090%0.911.02911.51080%0.911.06165.31.7Table 2.Usability Testing ResultsThe results from the SUS (System Usability Scale) scored the subjective satisfaction with the systembased on performance with these tasks to be: 85.5 Broadly interpreted, scores under 60 representsystems with poor usability; scores over 80 would be considered above average.1DISCUSSION OF THE FINDINGSEFFECTIVENESS1See Tullis, T. & Albert, W. (2008). Measuring the User Experience. Burlington, MA: Morgan Kaufman (p.149).11
Based on the findings, most users were quite effective at using the EHRUT. The average number offailures per task was 1.1, but the “errors” were primarily due to the user timing out before the task couldbe completed. Some users spent additional time making sure that they reviewed the alert and informationon the popped out hyperlink which contributed to timing out on the task, and ultimately, failure on the task.However, making certain that data is entered correctly contributes to an overall goal of this project patient safety.Most test participants were quite effective and showed very few, if any path deviations. The durationtaken to complete the task can be attributed to the fact that this is a feature on the application on whichthe test participants were not trained. It would be interesting to measure effectiveness once again aftertraining has been completed once the EHRUT has been deployed to the customers and to observe ifusers continue to follow an optimal path.Risk Prone ErrorsWhen discussing errors, it is important to note which tasks are more likely to result in errors and whattypes of errors are most likely to cause patient safety issues. Tasks which do not alter the patient’s recordbut simply display information to the user are less likely to lead to errors.Below is a prioritized list of tasks in the order of the associated risk and with a rating of the risk (1-3,where 1 is a low risk and 3 is a high risk)TaskRiskLevelCDS Problem List and Medication Allergy List3Clinical Decision Support using TOC/DDR2CDS Lab tests and values/results2Clinical Decision Support Measures Configuration1CDS Medication List1Linked Referential CDS and CDS Vitals Signs1EFFICIENCYA few users were unable to complete the tasks in what was deemed a “reasonable” amount of time.Users who failed to complete the task within the maximum amount of time, as determined for each taskprior to testing, had their data excluded for efficiency measures.The average deviations ratios (observed path / optimal path) in the group tested were close to 1.0 forusers who could complete the task. Even users who were unable to complete a task in time weregenerally on the correct path and rarely deviated into a different area of the software. Thus, we concludethat users were relatively efficient when completing the tasks set before them.SATISFACTIONThe results from the SUS (System Usability Scale) scored the subjective satisfaction with the systembased on performance with these tasks to be: 85.5. Verbal feedback as well as task ratings conclude that12
there is a high level of comfort and overall satisfaction with the system. Specifically, users stated that thesystem is “simple and intuitive,” “user friendly,” and “organized logically.” These statements, along withother participant verbalizations, suggest a high level of usability within the system.There are of course some areas of improvement, which are discussed below, but even so the averagetask ease of use rating was between 1.0 and 2.2 for each task. As set forth in the data scoring section,average ratings for systems judged easy to use should be 3.3 or below. Hence, a major finding of thistesting was that the modules tested are very easy to use.MAJOR FINDINGSThe test participants were also happy to see that that clinical decision support rules were more medicallyrelevant and tied directly to CQM measures. This link will lead to more meaningful alerts appearing insidethe EHR, which in turn will make physicians more likely to review them. The participants believed theinclusion of the new linked referential information would prove to be useful while reviewing the patientchart.13
AREAS FOR IMPROVEMENTGenerally, the feedback was very positive, but there are some areas where usability could be improved.One major takeaway from this process is that gathering user feedback earlier in the development processas well as working with less advanced/beginner users rather than super users could improve usability andoverall safety.Users noted they would also benefit from a clear listing of the patient data which caused a clinicaldecision message to appear. No user wanted the system to immediately generate a popup and interrupttheir work every time a new alert was generated. The EHR supports a number of CDS alerts and on theadmin screen a more apparent visual diff
of the same EHR and/or comparison with other EHRs provided the same tasks are used. In short, this testing serves as both a means to record or benchmark current usability, but also to identify areas where improvements must be made. During the usability test, participants interacted with one EHR. Each participant used the system in the