Transcription
National ElectricityTransmission SystemPerformance Report2016 – 2017Report to the Gas and ElectricityMarkets Authority
National Electricity Transmission SystemPerformance Report 2016 – 2017Report to the Gas and Electricity Markets Authority
ContentsIntroduction Page 6Section One – National Electricity Transmission System Page 7Availability Annual System AvailabilityWinter Peak System AvailabilityMonthly System AvailabilityPage 8Security Number of Loss of Supply IncidentsEstimated Unsupplied EnergyPage 10Quality of Service Voltage ExcursionsFrequency ExcursionsFrequency Standard DeviationPage 13Section Two – National Grid Electricity Transmission System Page 15Availability Annual System AvailabilityWinter Peak System AvailabilityMonthly System AvailabilityMonthly Planned & Unplanned UnavailabilityPage 16Security Number of Loss of Supply IncidentsEstimated Unsupplied EnergyLoss of Supply Incident DetailsPage 18Section Three – Scottish Power Transmission System Page 21Availability Annual System AvailabilityWinter Peak System AvailabilityMonthly System AvailabilityMonthly Planned & Unplanned UnavailabilityPage 22Security Number of Loss of Supply IncidentsEstimated Unsupplied EnergyLoss of Supply Incident DetailsPage 24
Section Four – Scottish Hydro Electric Transmission System Page 27Availability Annual System AvailabilityWinter Peak System AvailabilityMonthly System AvailabilityMonthly Planned & Unplanned UnavailabilityPage 28Security Number of Loss of Supply IncidentsEstimated Unsupplied EnergyLoss of Supply Incident DetailsPage 30Section Five – Interconnectors Page 33England – France Interconnector Annual AvailabilityMonthly UnavailabilityOutagesPage 33England – Netherlands Interconnector Annual AvailabilityMonthly UnavailabilityOutagesPage 37Section Six – Offshore Systems Page 39Annual Availability Annual System AvailabilityWinter Peak System AvailabilityMonthly UnavailabilityMonthly Planned & Unplanned System UnavailabilityPage 40Glossary of Terms Page 47
IntroductionThe electricity transmission networks in Great Britain are owned by National GridElectricity Transmission plc (NGET) in England and Wales, SP Transmission plc(SPT) in South and Central Scotland and Scottish Hydro Electric Transmissionplc (SHE Transmission) in the North of Scotland. These three networks form theOnshore Transmission System. The Offshore Transmission networks are ownedby Transmission Capital (TC), Blue Transmission Investments Limited (BT), GreaterGabbard OFTO Ltd, Gwynt-Y-Mor OFTO Ltd, Thanet OFTO Ltd, Humber GatewayOFTO Ltd and West of Duddon Sands Transmission plc (WoDS). The NationalElectricity Transmission System (NETS) is comprised of the Onshore and OffshoreTransmission System.In addition to its role as the TransmissionOwner in England and Wales, NGET becamethe Great Britain System Operator (GBSO) on1 April 2005, and subsequently on 24th June2009, National Electricity Transmission SystemOperator (NETSO) which includes the OffshoreTransmission System.In accordance with Standard Licence ConditionC17 (Transmission System Security, Standardand Quality of Service) of its TransmissionLicence, NGET, as NETSO, is required bythe Gas and Electricity Markets Authority, toreport National Electricity Transmission Systemperformance in terms of availability, systemsecurity and the quality of service.The Onshore and Offshore TransmissionSystem broadly comprises circuits operatingat 400, 275 and 132kV. The formal definitionof the National Electricity Transmission Systemis contained in the NETS Grid Code and NETSSecurity and Quality of Supply Standard (NETSSQSS). The fully interconnected transmissionsystem provides a consistently high quality ofsupply and also allows for the efficient bulktransfer of power from remote generation todemand centres.Information relating to SP Transmission plc,Scottish Hydro Electric Transmission plc, TCRobin Rigg OFTO Limited, TC Barrow OFTOLimited, TC Gunfleet Sands OFTO Limited,TC Ormonde OFTO Limited, TC Lincs OFTOLimited, TC Westermost Rough OFTO Limited,BT Walney 1 Limited, BT Walney 2 Limited, BTSheringham Shoal Limited, BT London ArrayLimited, Greater Gabbard OFTO Ltd*, Gwynt-YMor OFTO Ltd*, Thanet OFTO Ltd*, HumberGateway OFTO Ltd* and West of DuddonSands Transmission plc have been provided bythe Transmission Owners in accordance withLicence Condition D3 (Transmission SystemSecurity Standard and Quality of Service) oftheir Transmission Licences.When considering the performance of theScottish transmission networks it should berecognised that this can be influenced by boththe Scottish Transmission Owners and theNETSO.The National Electricity TransmissionSystem is connected via interconnectors totransmission systems in France, Northern andSouthern Ireland and The Netherlands. TheNorthern Ireland Interconnector is regulatedby the Northern Ireland Regulator (NIAUR)and Southern Ireland is regulated by theCommission for Energy Regulation (CER) whichboth fall outside the scope of this report.Information relating to the InterconnexionFrance – Angleterre (IFA) has been provided byNational Grid Interconnectors Limited (NGIC)in accordance with Licence Condition D5(Transmission System Security Standard andQuality of Service) of the NGIC TransmissionLicence.Information relating to the Interconnectorbetween England and the Netherlands (BritNedDevelopment Limited – “BritNed”) has beenprovided by National Grid in conjunction withTenneT due to the joint ownership of theequipment.* G reater Gabbard OFTO Ltd, Gwynt-Y-Mor OFTO Ltd, Thanet OFTO Ltd and Humber Gateway OFTO Ltd are operated by Balfour Beatty PowerTransmission & Distribution (BB) on behalf of the respective owners.6NATIONAL ELECTRICITY TRANSMISSION SYSTEM Performance Report 2016 – 2017
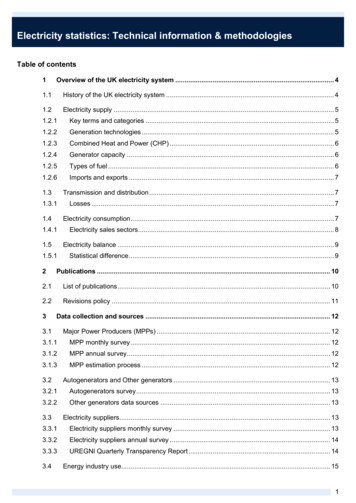
Section OneNational Electricity Transmission System(GB Network)England – Netherlands InterconnectorWest of Duddon SandsWestermost RoughHumber GatewayReliability of SupplyThe Overall Reliability of Supply forthe National Electricity TransmissionSystem during 2016 -17 was:99.999962%compared with 99.999993% in2015-16 and 99.99987% in 2014-15.England – France InterconnectorNATIONAL ELECTRICITY TRANSMISSION SYSTEM Performance Report 2016 – 2017 7
AvailabilityThe definitions and criteria for system availability can be found in the Glossary of Terms at theend of this report.National Electricity Transmission System performance is monitored by reporting variations inAnnual System Availability, Winter Peak System Availability and Monthly System Availability.Capenhurst Substation8NATIONAL ELECTRICITY TRANSMISSION SYSTEM Performance Report 2016 – 2017
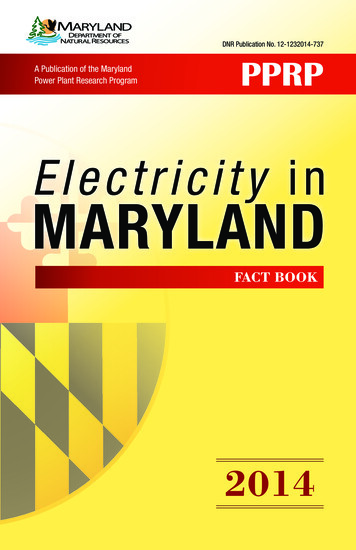
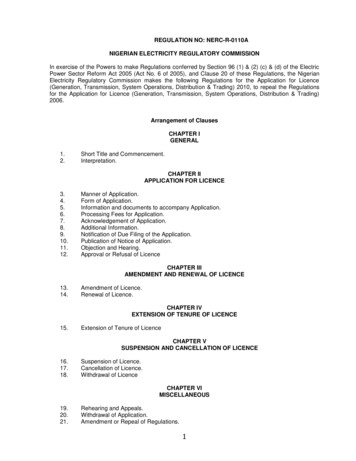
% Annual System Availability10099Percentage 2014-1597.152015-1696.462016-1796.712016-2017% Winter Peak System Availability10099Percentage 14-20152015-20162016-2017Percentage Availability% Monthly System 2012-13 2013-14 2014-15 2015-16 5195.31MAR2016-2017Annual System AvailabilityAnnual System Availability of the National ElectricityTransmission System for 2016-2017 was:94.31%NATIONAL ELECTRICITY TRANSMISSION SYSTEM Performance Report 2016 – 2017 9
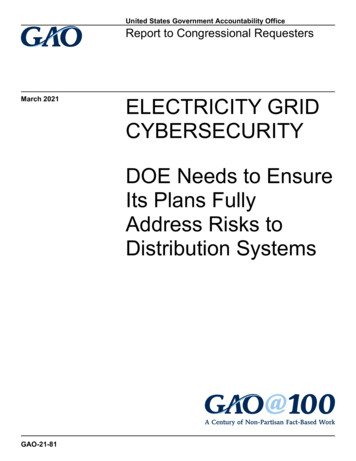
SecurityThe definitions and criteria for system security can be found in the Glossary of Terms at theend of this report.System performance is monitored by the Estimated Unsupplied Energy from the NationalElectricity Transmission System for each incident.During 2016 -17 there were 596 NETS events where transmission circuits were disconnectedeither automatically or by urgent manual switching. The vast majority of these events hadno impact on electricity users with only 29 resulting in loss of supplies to customers.1000900Number of Events8007006005002012-13 2013-14 2014-15 2015-16 5SPT2015-2016SHETGBElectricity National Control Centre, UK10NATIONAL ELECTRICITY TRANSMISSION SYSTEM Performance Report 2016 – SHET133160199104109GB614748760604596
Number of Loss of Supply IncidentsThe chart shows the annual comparison of the numbers of Loss of Supply Incidents that occurredwithin the National Electricity Transmission System. The chart separates the TNRI (2005 – 2013)and ENS (2013 to date) schemes for clarification.6055Number of Incidents50454035302520152012-13 2013-14 2014-15 2015-16 -2017ENSIncentivisedNon-IncentivisedTotal Estimated Unsupplied EnergyThe chart shows the annual comparison of the Estimated Unsupplied Energy for Loss of SupplyIncidents that occurs within the National Electricity Transmission System.1000MWh9008007006005004003002012-13 2013-14 2014-15 2015-16 tivisedNon-IncentivisedTotal EstimatedUnsupplied EnergyThe total Estimated Unsupplied Energyfrom the National Electricity TransmissionSystem during 2016-17 was:105.01 MWhNATIONAL ELECTRICITY TRANSMISSION SYSTEM Performance Report 2016 – 2017 11
Traffic Lights, LondonQuality of ServiceQuality of service is measured with reference to system Voltage and Frequency. The criteria forreportable Voltage and Frequency Excursions can be found in the Glossary of Terms at the end ofthis report.Voltage ExcursionsDuring 2016 -17 there were zero reportable Voltage Excursions within the National ElectricityTransmission System.The chart below summarises the reportable Voltage Excursions that have occurred on theNational Electricity Transmission System within England and Wales.109Number of Excursions872012-13 2013-14 2014-15 2015-16 2016-2017YearNumber of NGET Excursions12Number of SPT ExcursionsNumber of SHETL ExcursionsNATIONAL ELECTRICITY TRANSMISSION SYSTEM Performance Report 2016 – 2017Number ofNGETExcursions10600Number ofSPTExcursions00000Numberof SHETLExcursions00000
Frequency ExcursionsDuring 2016 -17 there has been no reportable Frequency Excursion within the National ElectricityTransmission System.The last reported Frequency Excursion was in 2008 - 09 reporting period.Frequency Standard DeviationThe chart below displays the recorded Frequency Standard Deviation from 50Hz on a weeklybasis for the year 2016 -17.0.100.09Standard Deviation 37383940414243444546474849505152WeeksSolar Panels and Wind TurbinesNATIONAL ELECTRICITY TRANSMISSION SYSTEM Performance Report 2016 – 2017 13
A Linesman’s Line of Sight14NATIONAL ELECTRICITY TRANSMISSION SYSTEM Performance Report 2016 – 2017
Section TwoNGET System(England & Wales Network)System DescriptionThe NGET network operates at 400, 275and 132kV supplying electricity to Englandand Wales with a maximum demand of45.7GW. The system covers an area ofapproximately 151,000 square kilometres,in accordance with the standards laid downin the Transmission Licence. It is connectedto the SP Transmission System to theNorth and three HVDC Interconnectors toSouthern Ireland, France and theNetherlands.There are 51 large power stations totalling46.6GW of generation capacity connectedto the England and Wales transmissionsystem. There are 12 Distribution Networksconnected to the NGET system via131.5GVA of installed transformer capacityand a small number of directly connectedcustomers such as steelworks.The Transmission System consists of14,176 kilometres of overhead line and 653kilometres of underground transmissioncable routes interconnecting over 300substations.NATIONAL ELECTRICITY TRANSMISSION SYSTEM Performance Report 2016 – 2017 15
AvailabilityThe definitions and criteria for system availability can be found in the Glossary of Termsat the end of this report.System performance is monitored by reporting variations in Annual System Availability,Winter Peak System Availability and Monthly System Availability. There is also a breakdownof Planned and Unplanned System Unavailability.Percentage Availability% Annual System 32016-2017Percentage Availability% Winter Peak System 20132013-20142014-20152015-20162016-2017Percentage Availability% Monthly System 016-2017NATIONAL ELECTRICITY TRANSMISSION SYSTEM Performance Report 2016 – 2017FEBMAR2012-13 2013-14 2014-15 2015-16 8194.76
Planned and Unplanned System UnavailabilityThe table and the chart show the monthly variation in Planned and Unplanned System Unavailability.Unavailability is defined as (100 – Availability) %10UserSystemMaintenance UnplannedConnection ConstructionPercentage r876543210APRMAYJUNJULAUGUser ConnectionSEPOCTSystem 887.788.325.443.573.524.535.24MARUnplanned400kV Substation, Elstree, WatfordNATIONAL ELECTRICITY TRANSMISSION SYSTEM Performance Report 2016 – 2017 17
SecurityThe definitions and criteria for system security can be found in the Glossary of Termsat the end of this report.System performance is monitored by the Estimated Unsupplied Energy from the NGETTransmission System for each incident.During 2016 -17 there were 379 NGET system events where transmission circuits weredisconnected either automatically or by urgent manual switching. The vast majority ofthese events had no impact on electricity users with only 7 resulting in loss of suppliesto customers.Safety Training at Staythorpe18NATIONAL ELECTRICITY TRANSMISSION SYSTEM Performance Report 2016 – 2017
Number of Loss of Supply IncidentsThe chart shows the annual comparison of the numbers of Loss of Supply Incidents that occurredwithin the NGET Transmission System.Number of Incidents16141210862012-13 2013-14 2014-15 2015-16 IncentivisedNon-IncentivisedTotal Estimated Unsupplied EnergyThe chart shows the annual comparison of the Estimated Unsupplied Energy for Loss of SupplyIncidents that occurs within the NGET Transmission System.200MWh1501002012-13 2013-14 2014-15 2015-16 1.500.871.110.0082.492016-2017ENSIncentivisedTotal EstimatedUnsupplied EnergyThe total Estimated Unsupplied Energyfrom the NGET Transmission Systemduring 2016 -17 was:89.26 MWhNon-IncentivisedReliability of SupplyThe Overall Reliability of Supply for theNGET Transmission System during2016 -17 was:99.999964%compared with 99.999998% in 2015 -16and 99.999996% in 2014 -15.NATIONAL ELECTRICITY TRANSMISSION SYSTEM Performance Report 2016 – 2017 19
Loss of Supply Incident DetailsNGET Loss of Supply Incidents – IncentivisedIncident Date, Time & LocationMW LostMinsMWh Unsupplied0.03.30.015 September 2016 11:55hrs at Rassau 132kV substationThe Walham 400kV mesh circuit breakers opened, consequently off-loading the WalhamRassau circuit resulting in a loss of supply at Rassau 132kV substation. Demand was restoredin stages.87.55.05.17†16 September 2016 04:58 at Tynemouth 11kV substationThe Blyth - South Shields – Tynemouth 275kV circuit tripped due to reported lightning activityin the area. This resulted in a loss of supply of 2.88MW at Tynemouth 11kV substation for33 minutes and 17 seconds.2.933.31.6020 November 2016 09:36 at Frodsham 400kV substationSGT9 at Frodsham 400kV substation offloaded, resulting in a loss of supply to Network Rail for2 hours 2 minutes and 6 seconds.0.0122.10.023 February 2017 10:13hrs at Frodsham 400kV substationAll circuit breakers at Frodsham 400kV substation tripped consequently disconnecting NetworkRail feeders to Crewe for 39 minutes.0.039.00.07 June 2016 17:04 at Leighton Buzzard 25 kV substationThe Cowley – Leighton Buzzard – Sundon 400kV circuit tripped due to a lightning strike,disconnecting Leighton Buzzard 25kV substation for 3 minutes and 16 seconds.Total6.77 MWhNGET Loss of Supply Incidents – Non-IncentivisedIncident Date, Time & LocationMW LostMinsMWh Unsupplied23 June 2016 01:48 at Redbridge 33kV substationBarking-Redbridge 1 & 2 275kV double circuit tripped, offloading Redbridge SGT1 and SGT2,resulting in a 42 second loss of supply at Redbridge 33kV substation.50.00.70.5823 February 2017 10:13 SPEN Ineos Chlor’s industrial demand at Frodsham 400kV substationAll circuit breakers at Frodsham 400kV substation tripped consequently disconnecting SPEN(DNO) feeder to Ineos Chlor chemical plant for 4 hours and 46 seconds.20.25240.881.2615 September 2016 11:55hrs at Rassau 132kV substationThe Walham 400kV mesh circuit breakers opened, consequently off-loading the WalhamRassau circuit resulting in a loss of supply at Rassau 132kV substation. Demand was restoredin stages.--0.65†Total† During the incident 0.65MWh demand were restored within 3 minutes and thus this amount of demand was non-incentivised.Deeside Substation20NATIONAL ELECTRICITY TRANSMISSION SYSTEM Performance Report 2016 – 201782.49 MWh
Section ThreeSP Transmission SystemSystem DescriptionThe SPTL Transmission System comprisesapproximately 4,000 circuit kilometres ofoverhead line and cable and 147 substationsoperating at 400, 275 and 132kV supplyingapproximately 2 million customers and coveringan area of 22,951 square kilometres. It isconnected to the SHE Transmission System tothe north, the NGET Transmission System to thesouth and the Northern Ireland TransmissionSystem via an HVDC interconnector.There are 9 major demand customerssupplied directly from the SP TransmissionSystem with the majority of the load beingtaken by approximately 2 million customersconnected to the SP Distribution System via14.2 GVA of installed transformer capacity.Over 7.3GW of generation capacity wasconnected to the SPTL Transmission Systemin 2016-17, including twenty one large powerstations. In 2016-17 the maximum recordeddemand on the network was 3.79GW.NATIONAL ELECTRICITY TRANSMISSION SYSTEM Performance Report 2016 – 2017 21
AvailabilityThe definitions and criteria for system availability can be found in the Glossary of Termsat the end of this report.System performance is monitored by reporting variations in Annual System Availability,Winter Peak System Availability and Monthly System Availability. There is also a breakdownof Planned and Unplanned System Unavailability.Percentage Availability% Annual System 22016-2017Percentage Availability% Winter Peak System 20132013-20142014-20152015-20162016-2017Percentage Availability% Monthly System 016-2017NATIONAL ELECTRICITY TRANSMISSION SYSTEM Performance Report 2016 – 2017FEBMAR2012-13 2013-14 2014-15 2015-16 4993.51
Planned and Unplanned System UnavailabilityThe table and the chart show the monthly variation in Planned and Unplanned System Unavailability.Unavailability is defined as (100 – Availability) %1098UserSystemMaintenance UnplannedConnection 543210APRMAYJUNJULUser ConnectionAUGSEPOCTSystem 7611.417.795.333.403.465.836.49MARUnplannedHeddon Tee Work to Increase Scottish Transfer CapacityNATIONAL ELECTRICITY TRANSMISSION SYSTEM Performance Report 2016 – 2017 23
SecurityThe definitions and criteria for system security can be found in the Glossary of Termsat the end of this report.System performance is monitored by the estimated unsupplied energy from the SPTransmission System for each incident.During 2016 -17 there were 108 SPT system events where transmission circuits weredisconnected either automatically or by urgent manual switching. The vast majority of theseevents had no impact on electricity users with only 14 resulting in loss of supply to customers.Work at Substation24NATIONAL ELECTRICITY TRANSMISSION SYSTEM Performance Report 2016 – 2017
Number of Loss of Supply IncidentsThe chart shows the annual comparison of the numbers of Loss of Supply Incidentsthat occurred within the SP Transmission System.2018Number of Incidents16141210862012-13 2013-14 2014-15 2015-16 ENSIncentivisedNon-IncentivisedTotal Estimated Unsupplied EnergyThe chart shows the annual comparison of the Estimated Unsupplied Energy, incentivised, forLoss of Supply Incidents that occur within the SP Transmission System.70MWh605040302012-13 2013-14 2014-15 2015-16 tal EstimatedUnsupplied EnergyThe total Estimated Unsupplied Energyfrom the SP Transmission Systemduring 2016 -17 was:11.35 MWhNon-IncentivisedReliability of SupplyThe Overall Reliability of Supply for the SPTransmission System during 2016 -17 was:99.999939%compared with 99.999920% in 2015 -16and 99.99998% in 2014 -15.NATIONAL ELECTRICITY TRANSMISSION SYSTEM Performance Report 2016 – 2017 25
Loss of Supply Incident DetailsSPT Loss of Supply Incidents – IncentivisedIncident Date, Time & LocationMWLostMinsMWhUnsupplied13 April 2016 09:21 at Coatbridge 33kV SubstationLVOC Protection operated at Coatbridge initiating the opening of SG1C Circuit Breaker,this resulted in supplies being lost to 17,187 customer for 7 minutes.25.873.015 July 2016 23:38 at Earlstoun 132kV SubstationProtection operation and auto-reclose on Glenlee/Tongland/Earlston 132kV circuit,switched 65 customers off for 5 minutes.0.150.0111 July 2016 20:44 at Dewar Place 275kV SubstationTransformer cooling protection operated on both Transformers tripping the circuitsand switching 61225 customers off for 5 minutes.70.055.9930 July 2016 04:25 at Tongland 132kV SubstationMain protection operated on Tongland/Glenlee 132kV circuit switched 11,927 customers off for 11 minutes.9.0111.3022 December 2016 16:38 at Hadyard Hill WindfarmOvercurrent protection at Maybole Circuit Breaker 320 operated taking wind farm off for 1 hour.1.0601.00Total11.31 MWhSPT Loss of Supply Incidents – Non-IncentivisedIncident Date, Time & LocationMWLostMinsMWhUnsupplied15 April 2016 09:13 at Markhill 275kV SubstationIntertrip receive from AREC wind farm on T1A circuit.0.02219700.014 July 2016 07:13 at Kilmarnock South 275kV SubstationA bird strike within the substation tripped SGT3 and switched 4819 customers off for 1 minute.2.310.0431 July 2016 06:06 at Whitelee Extension SubstationWhitelee Extension SGT3 circuit busbar protection operation on customers G3 Circuit Breaker, Grid SG3 tripped.Customer internal issue.0.000.09 September 2016 07:56 at Maybole 132kV SubstationMaybole CB 320 tripped open due to operation of the Maybole Load Management Scheme. This tripped off HadyardHill wind farm.0.0120.023 October 2016 18:44 at Coylton SubstationDersaloch wind farm Grid 1 CB tripped suspect 33kV VT fault or cable fault.0.014270.013 January 2016 01:54 at Galawhistle SubstationGalawhistle wind farm tripped after exceeding load restrictions.0.05920.023 February 2017 11:32 at Markhill 275kv SubstationProtection operation and auto reclose operation taking 4 wind farms off for 1 minute.0.010.023 February 2017 11:48 at Markhill 275kv SubstationProtection operation and auto reclose operation when SONI switched in DC link taking 4 wind farms off for 1 minute.0.010.023 February 2017 12:26 at Markhill 275kv SubstationCoylton/Auchencrosh/Mark Hill circuit switched out due to fault taking 4 wind farms off for 785 minute.0.07850.0Total26NATIONAL ELECTRICITY TRANSMISSION SYSTEM Performance Report 2016 – 20170.04 MWh
Section FourSHE Transmission SystemSystem DescriptionThe SHE Transmission System comprisesof 4,800 circuit kilometres of overhead lineand over 280 circuit kilometres ofunderground transmission cable routesinterconnecting 126 substations operatingat 400, 275 and 132kV. The system coversan area of approximately 55,000 squarekilometres or 24% of the Great Britain landmass. It is connected to the SPTransmission System to the South. In2016-17 the maximum recorded demandon the network was 1.54GW.There is over 6.61GW of generationcapacity in the SHE Transmission area and1 major customer supplied directly fromthe SHE Transmission System. The majorityof the load is taken by approximately 0.77million customers connected to theScottish Hydro Electric Power DistributionNetwork via 7.94GVA of installedtransformer capacity. There are 37 LargePower Stations directly connected to theSHE Transmission system.80% of these transmission assets form themain interconnected transmission systemwhilst the remaining 20% radially supply themore remote areas of the territory includingthe outlying islands. Some connections,mainly in the more remote areas, caninvolve non-standard connection or runningarrangements chosen by the customer.When considering 132kV systems astransmission voltages it should be bornein mind that amounts of powertransmitted at this voltage level aregenerally lower than at 275 and 400kVand as such may have lower securitystandards applied.NATIONAL ELECTRICITY TRANSMISSION SYSTEM Performance Report 2016 – 2017 27
AvailabilityThe definitions and criteria for system availability can be found in the Glossary of Termsat the end of this report.System performance is monitored by reporting variations in Annual System Availability,Winter Peak System Availability and Monthly System Availability. There is also a breakdownof Planned and Unplanned System Unavailability.Percentage Availability% Annual System 22016-2017Percentage Availability% Winter Peak System 20132013-20142014-20152015-20162016-2017Percentage Availability% Monthly System 016-2017NATIONAL ELECTRICITY TRANSMISSION SYSTEM Performance Report 2016 – 2017FEBMAR2012-13 2013-14 2014-15 2015-16 8198.58
Planned and Unplanned System UnavailabilityThe table and the chart show the monthly variation in Planned and Unplanned System Unavailability.Unavailability is defined as (100 – Availability) %10UserSystemMaintenance UnplannedConnection ConstructionPercentage r876543210APRMAYJUNJULUser ConnectionAUGSEPOCTSystem tion of Beauly - Denny RouteNATIONAL ELECTRICITY TRANSMISSION SYSTEM Performance Report 2016 – 2017 29
SecurityThe definitions and criteria for system security can be found in the Glossary of Termsat the end of this report.System performance is monitored by the Estimated Unsupplied Energy from the SHETransmission System for each incident.During 2016 -17 there were 109 SHE Transmission system events
NATIONAL ELECTRICITY TRANSMISSION SYSTEM Performance Report 2016 - 2017 7 Reliability of Supply The Overall Reliability of Supply for the National Electricity Transmission System during 2016-17 was: 99.999962% compared with 99.999993% in 2015-16 and 99.99987% in 2014-15. Westermost Rough West of Duddon Sands Humber Gateway Section One