Transcription
DNR Publication No. 12-1232014-737A Publication of the MarylandPower Plant Research ProgramPPRPElectricity inMARYLANDFACT BOOK2014
Martin O’Malley, GovernorAnthony G. Brown, lt. Governor“The Maryland Department of Natural Resources (DNR) seeksto preserve, protect, and enhance the living resources of the state.Working in partnership with the citizens of Maryland, this worthwhilegoal will become a reality. This publication provides information thatwill increase your understanding of how DNR strives to reach thatgoal through its many diverse programs.”Joseph P. Gill, SecretaryMaryland Department of Natural ResourcesThis document is available in alternative format uponrequest from a qualified individual with a disability.The facilities and services of the Maryland Department of NaturalResources are available to all without regard to race, color, religion,sex, sexual orientation, age, national origin, or physical or mentaldisability.
Table of ContentsMaryland’s Power Industry. 1Introduction. 1Electricity Sales in Maryland. 4Generation, Transmission, and Distribution. 7Maryland’s CPCN Process for Generation. 8Generation. 8Generation Resources in Maryland. 9Distributed Generation . 14PJM Capacity Market. 15Transmission. 16Distribution. 19Maryland’s Efforts to Improve Grid Resiliency. 21Renewable Energy and Energy Efficiency. 22Solar . 23Wind. 24Offshore Wind Energy . 24Energy Efficiency and Demand Response. 26Policy. 28Environmental Considerations. 28References for Additional Information. 31Maryland Agencies and Related Publications. 31
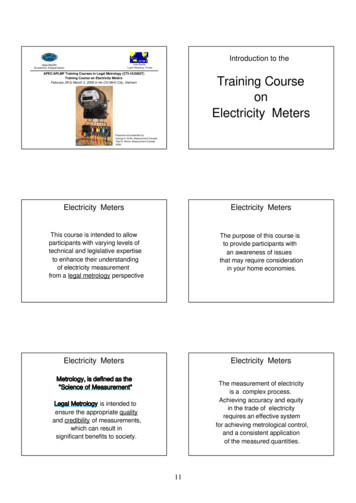
Maryland’s Power IndustryIntroductionMaryland’s electricity industry is functionally separated into three lines of business:generation and supply, transmission, and distribution (see Figure 1). While customersare billed for each of these three separate functions, most only receive oneconsolidated electric bill. The generation and supply of electricity is not regulated inMaryland, and prices are set by competitive wholesale and retail electricity markets.The distribution of electricity is a regulated monopoly function of local utilities andis therefore subject to price and quality-of-service regulation by the Maryland PublicService Commission (PSC). The high-voltage bulk electric transmission system is alsoa monopoly function and is regulated by the Federal Energy Regulatory Commission(FERC).Retail competition for power supply provides Maryland consumers with anopportunity to choose their own electricity suppliers. For more information aboutelectric choice, visit the Maryland PSC website (http://webapp.psc.state.md.us).Figure 1. Maryland’s Electricity MarketGeneration companies producepower to be sold in the wholesalemarketplace. Generation of electricity isa competitive industry in Maryland (i.e.,is not subject to price regulation). Retailpower supply to end-use customers isalso competitive, allowing consumers tochoose their own supplier.1Transmission is the high-voltage, longdistance movement of power, whiledistribution is the low-voltage, localdelivery of power.Transmission and distribution ofelectricity continue to be provided bylocal utilities within their variousfranchised service territories.Note on Terminology: The generating capacity of a power plant is the maximum amount of power itcan instantaneously supply to the grid and is measured in megawatts (MW). Electricity generation isthe amount of power supplied through time (energy) and is measured in megawatt-hours (MWh).
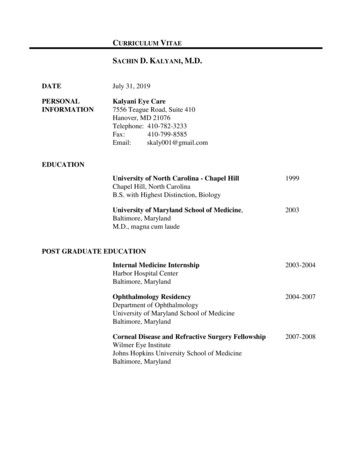
Maryland is part of PJM Interconnection (PJM), a regional transmission organization(RTO) that is responsible for balancing electricity demand and supply across theMid-Atlantic region.1 PJM administers the markets for energy, capacity, and ancillaryservices, but it does not direct the construction of new generation capacity. Asconditions change throughout the day, PJM tells generators when to send electricityout into the grid based on the electricity prices bid by the generators. The power plantsthat are the least expensive to run operate almost continuously in order to meet theminimum level of electricity that is demanded by a system, which is typically overnight.These plants are considered “base-load” generators. These base-load plants havetraditionally been coal and nuclear; however, natural gas has become increasingly morepredominant. While base-load generators are expensive to construct, they are relativelyinexpensive to operate, and they perform more efficiently and cost effectively whenrunning at a constant level. The typical level of demand that must be met by thesebase-load plants can be seen in the low-electricity demand hours of Figure 2.When consumers demand more electricity, the power plants with the ability to quickly sendelectricity out onto the grid to meet peak demand are put into operation. Peaking powertypically comes from smaller fossil fuel units. These units can be more expensive to operate,but they are relatively inexpensive to construct and can start up and shut down quickly.Intermediate or mid-merit plants—which can fill the gap between peak load and base loadgenerators—have become more prevalent in recent years. Intermediate plants typicallyprovide most or all of their energy during the day when energy demand increases, andFigure 2. Typical Load Profile3000Utility Company Load (MW)Total Generating Capacity2500ReserveMarginPeak Demand20001500Base Load10005000Midnight6 AM12 Noon6 PMMidnightHour of Day1For more information on regional transmission organizations, see the Transmission Section on page16; for more information on PJM specifically, see the PJM Interconnection callout box on page 3.2
they can either turn off or cycle to a low minimum run level at night so they can match thediurnal demand patterns. Although some coal plants can provide this capability, it is typicallynatural gas, oil, or hydropower plants that act as mid-merit plants.Another resource that PJM can utilize to meet peak demand is demand response (DR),which is achieved when customers voluntarily shut down some of their electricity-usingsystems, thereby reducing demand for electricity at that time (curtailment). In PJM,thousands of customers participating in DR programs are aggregated by curtailment serviceproviders to create significant savings during times of peak demand. Alternately, customerscan use distributed generation (DG) and use small, local generators to switch some localelectricity use to those generators.Retail end-use customers—including residential, commercial, and industrial customers—maypurchase electricity from licensed competitive suppliers (i.e., non-utility electricity suppliers)participating in Maryland’s retail electricity market. If a customer does not (or cannot)choose a competitive supplier, then that customer will be served by the regulated electricdistribution company under a tariff rate, which differs among the various customer classes.A residential or small commercial customer would be placed on the utility’s Standard OfferService rate. A larger customer, such as an industrial establishment, would be placed ona different rate, in which the price of energy varies hourly based on the zonal wholesalemarket for electricity.PJM InterconnectionPJM Interconnection, which serves Maryland and several nearby states, is one of eight regionaltransmission organizations and independent system operations with territory covering the UnitedStates. It is the largest regional transmission organization, serving more than 61 million people.PJM Transmission Zones3Source: Transmission Zone, hx.Legend
Electricity Sales in MarylandAt the beginning of 2009, only 2.8% of residential customers were being served bycompetitive suppliers (i.e., non-utility electricity suppliers), but by June 2014, 25% ofresidential customers had signed with competitive suppliers. By comparison, 34% ofsmall commercial and industrial (C&I) customers were receiving competitive supply,while the majority of medium-to-large C&I customers were already purchasing electricityfrom competitive suppliers. About 60% of medium C&I customers and 87% of large C&Icustomers had signed with competitive suppliers by June 2014.In 2013, Maryland’s electricity users consumed approximately 62 million megawatt-hours(MWh) of electricity. Figure 3 shows the percentage of state retail electric sales by customerclass. As shown in the figure, Maryland has a larger percentage of sales to residential andcommercial customers than the Untitled States as a whole. Recent reductions in electricityconsumption in Maryland have been outpacing those in the United States across all sectors.2In 2013, electricity supply (i.e., generation) accounted for approximately 62% of electricitycosts for Maryland’s residential customers, 68% for commercial customers, and 71% forindustrial customers. Transmission costs represented approximately 5% of the state’stotal costs for all customer classes. The remaining costs component (33% for residential,27% for commercial, and 24% for industrial) was related to distribution charges. Figures 4and 5 and Table 1 provide data on electricity rates in Maryland and the PJM region. Figure5 shows that Potomac Edison, which serves customers in Western Maryland, has lowerelectricity prices as compared to the rest of the State’s utilities. This price differential ismainly due to congestion between the western region of PJM, where abundant low-costgeneration is located, and PJM’s Mid-Atlantic region, where the large load centers arelocated.Figure 3. Distribution of Retail Electricity Sales in Maryland and the United States, 201360%50%Maryland40%United ansportationSource: U.S. Energy Information Administration.2Maryland Power Plant Research Project, Cumulative Environmental Impact Report-17.4
Maryland Electricity ImportsAlthough the exact percentage varies slightly from year to year, Maryland imported about 40% ofits electricity supply in the past two years. Maryland’s decreased level of in-state generation inrecent years, relative to the earlier parts of the decade, can be partially attributed to record lowprices for natural gas which have made imported electricity generated from gas more competitivethan in-state generation from coal. As discussed in the generation section, Maryland’s share ofgeneration capacity from natural gas is relatively small compared to the rest of the United States.Electricity (thousand MWh)Retail Sales(Consumption)Sales T&DLossesGenerationNetImportsPercentage ofSales 94943%Source: U.S. Energy Information Administration.Table 1. Typical Prices for Electric Service, 2013ResidentialCommercialIndustrialTypical usage billed (kWh/month)1,00010,00050,000Average per-kWh cost inMaryland (cents/kWh)13.311.110.7Average per-kWh cost in theMid-Atlantic (cents/kWh)15.513.88.6Average per-kWh cost in the U.S.(cents/kWh)12.410.56.9Source: Edison Electric Institute, Typical Bills and Average Rates Report.5
Figure 4. PJM Representative Peak and Off-Peak Wholesale Power Prices, 2013 70.00Off-Peak: 11 p.m. to 7 a.m. 60.00On-Peak: 7 a.m. to 11 p.m. 50.00 /MWh 40.00 30.00 20.00 unayMAprilJanuaryFebruaryMarch 0.00Source: Calculated from 2011 PJM hourly day-ahead locational marginal prices (LMPs) and hourly load data.Figure 5. Maryland Summer Electric Rates for Residential Standard OfferService Customers18161412Cents/kWh1086Potomac 0122013Note: Includes generation, transmission, and distribution charges.Source: Edison Electric Institute, Typical Bills and Average Rates Report.6
Generation, Transmission, and DistributionCurrently in Maryland, 45 power plants with generation capacities greater than 2megawatts (MW) are interconnected to the regional transmission grid. In aggregate,Maryland power plants represent more than 13,400 MW of operational capacity. Thelargest portion of Maryland’s generating capacity comes from fossil fuels, with theremainder attributed to nuclear and renewables. In Maryland, there are more than 2,000miles of transmission lines operating at voltages between 115 kilovolts and 500 kilovolts.There are 13 electric distribution utilities in Maryland serving about 2.5 million customeraccounts. About 90% of these customer accounts are served by Maryland’s four investor–owned utilities.Electricity Price Spikes during the January 2014 Polar VortexThe polar vortex is a high altitude low-pressure system that hovers over the Artic during winter (see figurebelow). From January 6–8, 2014, a polar vortex weather event brought prolonged, deep cold temperaturesto the entire PJM region. System operators had to contend with record-high electricity use and significantlyhigher than normal generator outages. Because of heating needs, PJM demand for electricity set a newwinter peak record of 141,846 MW the evening of January 7, but during the peak demand hour, 22% ofgeneration capacity—including coal, gas, and nuclear—was out of service. Although power supplies weremaintained without interruption, electricity prices increased significantly due to the generation shortage.On January 7, 2014, wholesale electricity prices in PJM exceeded 1,800 per MWh. This price was setby emergency DR offers, which meant that DR participants responded to calls for emergency energy andhigh prices to voluntarily curtail their use of electricity in exchange for curtailment payments. Due to theextreme weather during January 2014, the average wholesale electricity price in PJM was more than 110/MWh that month. By comparison, the average wholesale electricity price in PJM during January2013 was only about 35/MWh— approximately one-third of the January 2014 average.January 2014 polar vortex configurationSource: National Oceanic and Atmospheric Administration.7Typical polar vortex
GenerationIn states with restructured markets, such as Maryland, electricity is generated by powercompanies that are separate from the entities responsible for transporting and deliveringthe resource to end-use customers. In order for a power company to construct or modify agenerating facility (or transmission line) in Maryland, it must receive a Certificate of PublicConvenience and Necessity (CPCN) from the PSC prior to the start of construction.Maryland’s CPCN Process for GenerationAn approved CPCN constitutes permission to construct the facility and incorporatesseveral, but not all, additional permits required prior to construction (such as air qualityand water appropriation). Applications for a CPCN are reviewed before a Public UtilityLaw Judge in a formal adjudicatory process that includes written and oral testimony,cross examination, and the opportunity for full public participation. Parties to a CPCNlicensing case include the applicant, PSC Staff, the Office of People’s Counsel (actingon behalf of the Maryland ratepayers), and interveners such as Power Plant ResearchProgram (PPRP) (acting on behalf of the Department of Natural Resources (DNR) and sixother State agencies). Other groups, such as federal agencies and private environmentalorganizations, as well as individuals, also have a right to participate as interveners inthese hearings. The broad authority of the PSC allows for the comprehensive review ofall pertinent issues and was designed in 1971 to be a “one-stop shop” for power plantlicensing. In recent years, PPRP has been involved in numerous CPCN cases representingseveral thousand megawatts of potential generating capacity at existing facilities andgreen field sites (see Table 2).Table 2. Recent CPCNs for Generation in MarylandFacility NameChurch Hill SolarCove Point Natural GasCPV St. Charles Natural GasKeys Energy Center Natural GasMaryland SolarMattawoman Energy Center Natural GasOld Dominion Natural GasOneEnergy Cambridge SolarPerryman Natural GasRockfish SolarProposedSize (MW)CPCNStatusPSC edpending9314931892809297927293309327934891369351* More information regarding each application can be found by using the PSC’s case seach tool onits website http://webapp.psc.state.md.us.8
Generation Resources in MarylandThe largest new generation project recently issued a CPCN in the state is a 1,000 MWnatural gas power plant that Old Dominion Electric Cooperative (ODEC) is building inCecil County. In April 2013, ODEC asked the PSC for expedited approval of a CPCN forthe project so that it could bid into PJM’s May 2014 capacity auction (see page 15 fora description of PJM’s capacity market). The project, which is called the Wildcat Pointpower plant, was approved by the PSC in March 2014, began construction in late2014, and is expected to be online by June 2017.Figure 6. Power Plant Capacity (MW) and Generation (GWh) in Maryland by Fuel CategoryNuclear13.3%Renewables6.8%1.2% Other Fossil17.4% Natural Gas24.0% PetroleumFossil Fuel79.9%37.4% CoalNet Summer Generating Capacity in 2012(total equals 13,794 MW)Renewables8.8%0.4%Nuclear34.4%Fossil Fuel56.8%0.5% PetroleumOther Fossil5.5% Natural Gas50.4% CoalActual Generation in 2012(total equals 41,818 GWh)Source: U.S. Energy Information Administration.9
Coal is the primary fuel used to generate electricity in Maryland, with nuclear powerbeing the second-largest generation source. Maryland’s coal-fired power plantstypically supply about half of the state’s annual electricity generation, while powerfrom the state’s only nuclear plant—the dual-unit Calvert Cliffs facility—typicallysupplies about one-third of annual generation. Much of the remaining generationis supplied by natural-gas-fueled plants, hydropower plants, and other renewableresources (see Figure 6).Several major pipelines from the Gulf Coast region supply natural gas to Marylandmarkets. As shown in Figure 7, Maryland generates a larger portion of its electricityfrom coal and nuclear fuel than the United States as a whole, while natural gasis used to a larger extent by power plants in other areas of the country comparedto Maryland. This is expected to change in the coming years as older coal-firedgenerators are retired and new natural gas-fired generators, such as the ODEC plantdiscussed above, come online. Maryland has less renewable generation than theUnited States as a whole due to the geographic nature of the State. The heartlandof the United States has much better wind resources than Maryland, and there arelimited opportunities to utilize hydroelectric resources in Maryland.Figure 7. Electric Generation by Fuel Type for the United States, the PJM Region, andMaryland, 201350%45%40%44%44%United 10%8%5%7%1%0%1%4%1%4%2%1%3% 3% 3%0%CoalNuclearNatural Petroleum Hydropower WindGasOther**”Other” includes both fossil and renewable fuels, including: solar, blast furnace gas, biomass, methane,tired derived fuels, and other fuels not otherwise explicitly represented in the figure.Source: U.S. Energy Information Administration.Note: Totals may not add up to 100% due to independent rounding.10
Table 3. Operational Generating Capacity in Maryland ( 2 MW)Plant NameFuel TypeNameplateCapacity (MW)Warrior RunCoal229Deep CreekHydroelectric20CrisfieldEastern LandfillCalvert CliffsConowingoCriterion Wind ParkGould StreetMount Saint Mary'sNotch CliffPerrymanPhiladelphia RoadRiversideWestportHagerstownNewland ParkLandfillResource RecoveryFacility (RRF)OilLandfill GasNuclearHydroelectricWindNatural GasSolarNatural GasOil/Natural GasOilOil/Natural GasNatural GasSolar1031,82957270104161444048324412120Landfill Gas3Waste68Landfill Gas3OwnerIndependent Power ProducersAES EnterpriseBP Piney & DeepCreek, LLCCalpine CorporationEastern Landfill GasExelon GenerationFirst Solar, Inc.INGENCOMontgomery CountyNortheast MarylandWaste DisposalAuthorityGude & OaksLandfillsChalk PointDickersonNRG EnergyPanda EnergyPepco Energy ServicesPrince George's County11FedEx FieldSolar FacilityMorgantownViennaBrandywineNational Institutesof HealthBrown Station RoadCoal/Oil/Natural GasCoal/Oil/Natural Gas2,563930Solar2Coal/OilOilNatural Gas1,548183289Natural Gas23Landfill Gas6
OwnerGestamp WindRaven PowerHoldings, LLCFuel TypeNameplateCapacity il/Natural Gas11Oil/Natural Gas27Solar2Waste65OilOil/Biodiesel969Natural Gas770Solar5Natural Gas84Domino SugarOil/Natural Gas18Sparrows PointNatural Gas/BlastFurnace Gas120Wood4Coal65Natural Gas11Plant NameRoth RockWind FacilityBrandon ShoresC.P. CraneH.A. WagnerMillenniumHawkins PointSuez EnergyUniversity ofNorth AmericaMaryland –College ParkUniversity ofSunEdisonMaryland Eastern ShoreWheelabratorWheelabratorIncinerator (formerlyTechnologiesBRESCO)Publicly Owned Electric CompaniesTown of BerlinTown of BerlinEaston UtilitiesEastonOld Dominion ElectricRock SpringsCooperativeSouthern MarylandSMECO SolarElectric CooperativeChalk Point Turbine(SMECO)Self-GeneratorsAmerican SugarRefining Co.Hilco IndustrialMaryland Departmentof Public Safetyand CorrectionsNew PageSolo CupEastern CorrectionalInstitution (ECI)Cogeneration FacilityLuke MillSolo Cup –Owings Mills976Source: Maryland Power Plant Research Project, Cumulative Environmental Impact Report-17.12
DeepCreekConemaughAllegheny RidgePENNSYLVANIAWarrior RunHagerstownR.P. SmithBear CreekSusquehannaLocust RidgeEastonConowingoMuddy RunSafe HarborThree Mile IslandYork HavenBrunner IslandHoltwoodPeach BottomRock SpringsMount St. Mary'sDickersonNIHFedEx rlinUMESNJ OakSalemHope CreekJERSEYPilesgroveEdge MoorNEWHay RoadECIIndian RiverEViennaCalvert CliffsPanda-BrandywineSMECOChalk PointPossum th AnnaUniversity of MD - College ParkBenning RoadGude LandfillMontgomery County RRFSouthern Chesnut RidgeLuke MillCriterionMt. StormC.P. CraneMountaineerNotch CliffRoth RockFigure 8. Location of Power Plants In and Around MarylandHatfield's FerryHarrisonWEST VIRGINIAEastern LandfillRiversideSparrows PointH.A. WagnerSolo CupPhiladelphia RoadWestportGould StreetDominoWheelabratorBaltimoreMillenniumBrandon ShoresWoodMunicipal WasteWindSolarKey for Power Plant Fuel SourcesFossil FuelNuclearHydroelectricLandfill Gas13
Distributed GenerationIt is difficult to accurately estimate the total amount of DG in Maryland, as themajority of DG units are diesel-fired, emergency back-up generators. However, anincreasing share of this capacity comes from solar energy, which is predominantlygrid-tied for the purposes of net metering and generating solar renewable energycredits (SRECs) for sale or trade. Net metering is a billing mechanism that allowsDG owners to be credited for excess electricity that is added to the grid. In otherwords, under a net metering arrangement, a DG customer’s electric meter can runbackwards when the DG system is generating more electricity than the customer isconsuming. SRECs are used to comply with Maryland’s Renewable Energy PortfolioStandard (RPS), which is described on page 22.Onsite generators with capacity less than 1,500 kilowatts (kW) are not required toapply for a CPCN through the PSC. Certain generators, including most solar DG, thathave a capacity of 1,500 kW to 70 MW are eligible to seek a CPCN exemption. As ofthe end of 2013, a total of about 1,575 MW of generation capacity had been grantedCPCN exemptions in Maryland, including 61.8 MW of solar capacity and 190 MW ofonshore wind power. Under net-metering arrangements, 100 MW of solar DG and 1.3MW of small wind facilities had been installed in Maryland by mid-2013 (see Figure 9).Figure 9. Distributed Generation Capacity in Maryland, 20137%11%2%Petroleum, 1,142 MWSolar, 100 MW 1%80%Natural Gas, 150 MWBiomass*, 31 MWWind, 1.3 MW*Includes digester andlandfill gas unitsSource: Maryland Power Plant Research Project, Cumulative Environmental Impact Report-17.14
PJM Capacity MarketPJM operates a forward capacity market, in which an auction is conducted three yearsin advance of the need for generation capacity, where load serving entities (LSEs, forexample, Baltimore Gas and Electric) purchase supply-side and demand-side capacityresources.3 Each LSE is required to have available its share of the PJM system peak plusa reserve margin of an additional (approximately) 15% of peak load. This means thatthe system as a whole must always have more generation capacity available than whatis expected to be required to meet peak loads so that extra electricity generation can bebrought into use if needed, e.g., in the event of an unplanned outage of one or more largegenerating plants or extreme weather conditions.The current PJM capacity market is based on PJM’s Reliability Pricing Model (RPM),implemented in 2007 as a means to provide power plant developers with price signals toinfluence decisions on whether (and where) to construct new power plants and to provideowners of existing generation with price signals to influence decisions on whether to retireexisting plants. The RPM is an approach developed by PJM and used to provide a marketprice for capacity that is aligned with PJM’s assessment of the cost of new entry, i.e., thelevel of revenue that a power plant developer would require in order to make the decisionto develop peaking resources economically feasible. The approach also recognizes andaccommodates higher capacity prices when PJM is capacity short and lower prices whenexcess capacity exists.The RPM establishes capacity prices that are determined through an auction three yearsin advance of the need for generation capacity resources. The most recent auction, whichoccurred in May 2014 for the 2017/2018 delivery year (i.e., June 1, 2017 through May 31,2018), cleared 167,004 MW of unforced capacity in the PJM region.Fundamentally, capacity market prices are determined through the intersection of ademand curve and a supply curve (i.e., the equilibrium market clearing price):The Demand Curve–the downward sloping demand curve, referred to by PJM as theVariable Resource Requirement (VRR), is developed for the PJM region and also for thelocational delivery areas (LDAs). This curve is plotted on a graph with dollars per MW-dayon the vertical axis and MW of capacity (or percentage of reliability requirement) on thehorizontal axis.The Supply Curve–the supply curve is obtained by PJM through the capacity bids offeredby the capacity owners. Eligible capacity includes existing and new capacity, demand-sideresources (e.g., load response), and qualified transmission upgrades. The capacity offersfrom the auction are stacked (lowest cost to highest cost), resulting in an upward slopingsupply curve. The auction clearing price is determined by the intersection of the VRR andthe supply curve (the auction bids).3An LSE is any entity that (a) serves end-users located in PJM, and (b) is granted the authority or has an obligationpursuant to state or local law, regulation, or franchise to sell electric energy to end-users located in PJM.15
TransmissionThe transmission grid conveys electricity over a system of high-voltage electriclines that extend between electric generators and distribution companies. Propercoordination and planning of the transmission system is critical to maintainingelectric reliability and providing adequate power supplies at reasonable prices. Themap in Figure 10 illustrates the extent of Maryland’s existing transmission network.FERC regulates the transmission of electricity, natural gas, and oil in the UnitedStates. In regard to the electricity industry, FERC is responsible for regulating thetransmission system and wholesale sales of electricity, ensuring the reliability ofhigh-voltage transmission systems, and monitoring and investigating the energymarkets. For more information, visit FERC’s website (www.ferc.gov).Under Maryland regulations, an electric company that is planning to constructa transmission line greater than 69 kilovolts (kV) in Maryland must receive aCPCN from the PSC prior to the start of construction. The PSC considers impactson Maryland’s resources (e.g., land use impacts) and requires a thoroughenvironmental and socioeconomic impact evaluation as part of the CPCN approvalprocess for transmission projects in Maryland. Table 4 summarizes the recentprojects for which CPCN permits have been obtained.Table 4. Recent CPCNs for Transmission in MarylandLine NameDeveloper/OwnerSize(kV)ApproximateLength inMD (miles)Affected MDCountiesMonocacy-RinggoldCarroll ModificationPotomacEdison23013Northwest-Deer ParkBGE1153Conastone-GracetonChurch-DE/MDState LineBagley-GracetonChurch-Wye MillCecil to MD/DE State LineNortheastTransmission SystemBGE2302Washington,Frederick, CarrollBaltimore,CarrollHarfordDelmarva13811Queen Anne’sBGEDelmarva2301381426Harfor
Transmission and distribution of electricity continue to be provided by local utilities within their various franchised service territories. Maryland’s Power Industry Introduction Maryland’s electricity industry is functionally separated into three lines of business: generation and supply, transmission