Transcription
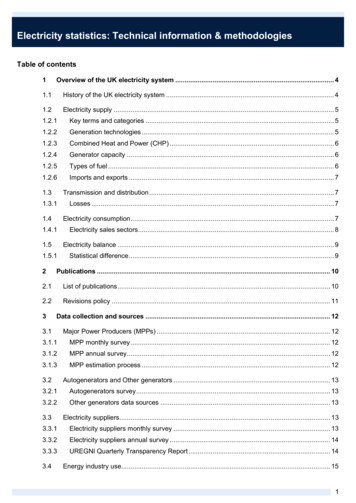
Electricity statistics: Technical information & methodologiesTable of contents1Overview of the UK electricity system . 4History of the UK electricity system . 4Electricity supply . 51.2.1Key terms and categories . 51.2.2Generation technologies . 51.2.3Combined Heat and Power (CHP) . 61.2.4Generator capacity . 61.2.5Types of fuel . 61.2.6Imports and exports . 7Transmission and distribution . 71.3.1Losses . 7Electricity consumption . 71.4.1Electricity sales sectors. 8Electricity balance . 91.5.12Statistical difference . 9Publications . 10List of publications . 10Revisions policy . 113Data collection and sources . 12Major Power Producers (MPPs) . 123.1.1MPP monthly survey . 123.1.2MPP annual survey . 123.1.3MPP estimation process . 12Autogenerators and Other generators . 133.2.1Autogenerators survey . 133.2.2Other generators data sources . 13Electricity suppliers. 133.3.1Electricity suppliers monthly survey . 133.3.2Electricity suppliers annual survey . 143.3.3UREGNI Quarterly Transparency Report . 14Energy industry use. 151
Transmission and distribution losses . 153.5.1Transmission losses . 153.5.2Electricity distributors . 15Imports and exports. 153.6.1National Grid . 153.6.2EirGrid . 15Other consumers . 153.7.14Electricity used in transport . 15Methodologies and table calculations. 17Fuel use . 174.1.1MPP fuel use . 174.1.2Autogenerators fuel use . 174.1.3Other generators fuel use . 174.1.4Basis for table figures . 18Electricity generation and supply . 184.2.1MPP Generation, own use and supply . 184.2.2Co-firing adjustments . 184.2.3Autogenerators and other generators generation . 184.2.4Autogenerators and other generators supply and own use . 194.2.5Autogenerators and other generators electricity available . 19Purchases and transfers. 19Storage . 194.4.1Pumped storage . 194.4.2Battery storage . 20Imports and exports. 204.5.1Net imports . 204.5.2Utilisation (Table 5.13) . 20Transmission and distribution losses . 20Electricity consumption . 204.7.1PDS sales data aggregation . 204.7.2PDS sales table calculations . 214.7.3Other generators’ consumption . 214.7.4Electricity used in transport . 22Energy industry use. 224.8.1Fuel production . 224.8.2Electricity used in generation . 222
Electricity balance . 224.9.1Statistical difference . 23Capacity . 234.10.1Capacity methodology . 234.10.2Capacity definitions . 234.10.3Capacity derating . 234.10.4Grid connections (Table 5.12) . 24Other DUKES calculations . 244.11.1Efficiency (Table 5.10) . 244.11.2Maximum load met (Table 5.10) . 244.11.3System load factor (Table 5.10) . 244.11.4Plant load factor (Table 5.10), . 244.11.5Carbon dioxide emissions per GWh supplied (Table 5.14) . 245Glossary . 263
1 Overview of the UK electricity systemThe UK electricity system broadly consists of the following distinct areas: electricity supply, transmission,distribution, and consumption. The Department for Business, Energy and Industrial Strategy (BEIS)’selectricity statistics cover all of these areas.History of the UK electricity systemThe following paragraphs describe developments in the UK electricity system from the 1990s to present day.The electricity market was privatised in 1990, at a time when seven generating companies in England andWales and 12 Regional Electricity Companies distributed and supplied electricity to customers. Over the nextdecade, competition was re-introduced to the markets in three phases. First, the upper tier of the non-domesticmarket (customers with a maximum demand of over 1 MW, comprising 30 per cent of the market) was openedto competition in March 1990. Next, the 100 kW to 1 MW tier (15 per cent of the market) was opened tocompetition in April 1994. Full competition for the remaining 55 per cent of the market was introduced instages between September 1998 and June 1999. The breakup of the nationalised companies immediatelyincreased market competitiveness, leading to an early peak in the number of market participants in 2004.However, the number of companies then fell until 2010 as companies either took over competitors or boughtadditional power stations to add to their portfolios. Since 2010, the market has continued to becomeincreasingly competitive.Before 2005, the electricity industries of Scotland, Northern Ireland and England and Wales operatedindependently, with interconnectors joining the grid systems together. In England and Wales, the National Gridowns and operates the high-voltage transmission networks. Initially the National Grid Company was owned bythe 12 privatised regional electricity companies but was floated on the Stock Exchange in 1995. In March2001, the means of trading electricity changed with the introduction of the New Electricity TradingArrangements (NETA). These arrangements were based on bi-lateral trading between generators, suppliers,traders, and customers, and were designed to be provide greater choice for market participant whilstmaintaining the operation of a secure and reliable electricity system. The system included forwards and futuresmarkets, a balancing mechanism to balance generation and supply, and a settlement process.In Scotland before 2005, two main companies (Scottish Power and Scottish and Southern Energy) covered thefull range of electricity provision - operating generation, transmission, distribution, and supply businesses.There were also several small independent hydro stations and generators operating fossil-fuelled stations,which sold their output to Scottish Power and Scottish and Southern Energy. From April 2005, the electricitysystem in Scotland was integrated with that in England and Wales under the British Electricity Trading andTransmission Arrangements (BETTA), introduced in the Energy Act 2004. This allowed the extension of NETAto Scotland and created a single GB transmission network operated by the National Grid.In April 2019, the National Grid legally split into the network operator, and the National Grid Electricity SystemsOperator (ESO) which is responsible for operating the GB balancing mechanism.In Northern Ireland, power procurement, transmission, distribution, and supply has been in the privateownership of Northern Ireland Electricity plc (NIE) since 1993. Generation is provided by three private sectorcompanies who own the four major power stations. In December 2001, a link for the transfer of electricitybetween Northern Ireland and Scotland’s grids was inaugurated. A link for the import and export of electricitybetween the grids of Northern Ireland and the Republic of Ireland was re-established in 1996. The two gridswere fully integrated on 1 November 2007, with a joint body SEMO (Single Electricity Market Operator) set upby SONI (System Operator for Northern Ireland) and EirGrid from the Republic of Ireland to oversee the newsingle market. In July 2012, an interconnector between the Republic of Ireland and Wales began operations.4
Electricity supplyElectricity supply (or electricity available) is equal to electricity generated (or produced) and net trade. BEISstatistics report generation as that produced by Major Power Producers plus transfers (or purchases) fromother generators. The definitions of different sources of generation in BEIS statistics are as follows:Major Power Producers (MPPs) are companies whose prime purpose is the generation of electricity. Somerenewable generators, with a smaller capacity portfolio, are excluded from this list. For a detailed description ofthe inclusion criteria for MPPs in BEIS statistics, see the MPP data collection section of this document. A list ofcurrent MPPs can be found in the Digest of UK Energy Statistics (DUKES) Table 5.11.Autogenerators are companies who produce electricity as part of their industrial or commercial activities, butwhose main business is not electricity generation. Most of the electricity produced by these schemes isconsumed on site, but some producers also transfer electricity to the public distribution system.Other generators refer to autogenerators, domestic generation, and smaller renewable electricity generators(e.g., small wind farms) who are not included as MPPs due to their comparatively small size.1.2.1Key terms and categoriesThe following categories are used to classify generation within BEIS statistics:Electricity vs energy. In common English usage, these two words are often used interchangeably. Withinelectricity statistics, only the term electricity is used and relates only to that specific form of energy. The energystatistics in Chapter 1 of DUKES and Energy Trends refer to a wider category of energy sources, including theuse of coal or gas for heating and the use of oil for transport.Generated and supplied make a distinction between the total amount generated by a plant and the amountsupplied to the grid. The difference between these is the plants’ own use i.e. the electricity needed in theprocess of generation (also called ‘used on works’). ‘Supplied’ in this context is different from the overallsupply referred to in the balances (which includes all generation and imports).Fossil fuels refer to fuels formed by natural processes, such as the decomposition of plant and animalbiomass, which cannot be replenished. They include coal, oil, and gas.Renewable refers to any form of generation that either does not use fuel to generate, such as solar, wind ortidal generation, or generation that uses fuels that can be replenished. Renewable fuels include plant biomass,animal biomass, biogas and renewable waste.Low carbon includes all forms of renewable generation, plus nuclear generation.Thermal generation is any generation where a fuel is burnt during the process of generation. This could befossil fuel such as coal or gas, or a renewable fuel such as plant biomass.Non-thermal generation is any generation that does not use fuel to generate, such as solar, wind or tidalgeneration.1.2.2Generation technologiesWithin BEIS statistics, generation is also broken down by type of technology used to produce electricity. Thetypes of technology referred to are as follows:Conventional steam stations burn fuel to convert water into steam, which then turns steam turbines andpowers a connected electrical generator.Nuclear stations are also steam stations, but nuclear fission is used to produce the heat needed for steam.5
Gas turbines use pressurised combustion gases from fuel burned in one or more combustion chambers toturn a series of bladed fan wheels and rotate the shaft on which they are mounted.Combined cycle gas turbine (CCGT) stations combine in the same plant gas turbines and steam turbines,enabling electricity to be produced at higher efficiencies. The gas turbine (usually fuelled by natural gas or oil)produces mechanical power (to drive the generator) and waste heat. The hot exhaust gases (waste heat) arefed to a boiler, where steam is raised at pressure to drive a conventional steam turbine.Natural flow hydro-electric stations use natural water flows to turn turbines.Pumped storage hydro-electric stations use electricity to pump water into a high-level reservoir. This wateris then released to generate electricity at peak times. Where the reservoir is open, the stations also generatesome natural flow electricity; this is included with natural flow generation. The amount of electricity used inpumping the water uphill is greater than that generated as the water flows downhill through the turbines.Therefore, net supply from pumped storage schemes across the year is negative.Solar generators use photovoltaic cells and modules to directly convert solar energy into electricity, usingboth direct and diffuse radiation.Wind farms use wind flows to turn turbines.Other stations include stations burning fuels such as landfill gas, sewage sludge, biomass, and waste.1.2.3Combined Heat and Power (CHP)Combined Heat and Power generation is a form of thermal generation where useable heat and power (usuallyelectricity) is generated in a simultaneous process. CHP can use a variety of fuels and generationtechnologies but include a way for the heat generated in the process to be captured and put to furtherproductive use, such as for industrial processes, hot water or space heating.Chapter 7 of DUKES covers CHP in more detail but is treated slightly differently. For Chapter 5 and within theelectricity balance, any electricity generated will be counted, but Chapter 7 focuses on ‘good quality’ CHP asdefined in the CHP Quality Assurance scheme. DUKES Table 5.15 shows the difference in generation andcapacity measured by both chapters.1.2.4Generator capacityGeneration technologies are described by their capacity, which is the maximum output a generator canproduce. Different measures of capacity are used for different generator technologies, and more informationabout these can be found in the capacity methodology.1.2.5Types of fuelElectricity generation is also broken down by fuel use, and the fuels reported by BEIS can be described usingbroad categories.Fossil fuels refer to fuels formed by natural processes, such as the decomposition of plant and animalbiomass, which cannot be replenished. They include coal, oil, and gas, which are burnt to create heat whichproduces steam to power turbines for electricity generation.Nuclear refers to the release of energy from splitting atoms into smaller atoms (nuclear fission).Bioenergy (also called thermal renewables) refer to any fuel used in generation that can be replenished.This includes plant biomass (e.g., wood, straw, husks from nut production), animal biomass (e.g., bones frommeat production), biogas (e.g., gas from sewage or anaerobic digestion) and renewable waste.Other fuels include the burning of non-renewable waste and industrial waste products (e.g. waste gases).6
Waste as a fuel uses waste from households and industry to power generators. The fuel use and generationfrom waste is split between the renewable ‘bioenergy’ category and the non-renewable ‘other fuels’ category.The split assumes that half of household waste counts as renewable. Other waste products will be splitdifferently, as detailed in the notes to Chapter 6.Non-thermal renewables are forms of generation where no fuels are not burnt in generation. This includesnatural water flows (hydro natural flow), solar, tidal, offshore and onshore wind. Non-thermal renewables donot burn fuel, but for comparison purposes we assume their fuel use is equal to their electricity output.1.2.6Imports and exportsThe final component of UK electricity supply is net imports (imports minus exports). Trade of electricity occursalong interconnectors with France, Ireland, Netherlands, and Belgium. Electricity can also be transferredbetween the separate electricity grids of England & Wales, Scotland, and Northern Ireland.Transmission and distributionOnce electricity is made available, it then is carried to final consumers through grid networks. BEIS statisticssplit this into supply via the Public Distribution System, and supply from other generators.Public Distribution System (PDS) is the separate grid systems in England and Wales, Scotland andNorthern Ireland which carries electricity from generators to final users. It consists of (1) transmissionnetworks: high voltage electricity wires which extend across GB and offshore waters, and (2) distributionnetworks: lower voltage electricity networks which carry electricity from the transmission grid to final users.1.3.1LossesLosses refer to electricity lost through the process of either transmission or distribution. They are reported aselectricity lost within the system as a percentage of electricity entering the system. Losses also include theft ofelectricity from the distribution network, which is reported as a fixed percentage of electricity entering thedistribution network. Further information can be found in the losses methodology.Electricity consumptionElectricity consumption measures the amount of electricity that is consumed by users. It is also calledelectricity demand, which must balance with supply. It includes electricity consumed in the process ofgeneration and electricity sold to industrial, commercial, domestic, and other users. Actual consumption data isnot immediately available as it is dependent on electricity meters being read and reported back to thesuppliers. Therefore, BEIS final consumption data is continuously revised over the course of a year, to reflectthe increased number of meter readings and availability of accurate data from electricity suppliers. Keyconsumption terms are:Major electricity suppliers are companies who supply electricity to consumers through the PDS and have amarket share of above 0.1%. Further information about electricity suppliers can be found in the electricitysuppliers data collection. Electricity can also be consumed by autogenerators, which use the electricity theyproduce on site.Total demand refers to electricity use by consumers across different sectors such as: industry, commercial,transport, agriculture, and public administration, as well as by the energy industry in the process of generation.Final consumption refers to consumption by end users, including all the categories above except for energyindustry use. Electricity final consumption data is reliant on estimates provided by electricity suppliers eachmonth.7
1.4.1Electricity sales sectorsThe classification of consumers into sectors according to their main business follows, as far as practicable, theStandard Industrial Classification (SIC2007). Definitions for which sales are included within each sectordefinition can be found below, and full definitions can be found in the most recent version of DUKES Annex Aparagraphs A.31 to A.42.Industrial sector use includes electricity used by for transformation and final consumption activities in the ironand steel, non-ferrous metals, chemical and mineral products industries. It also incorporates electricity usedfor mechanical or electrical engineering, construction, printing and publishing, and the manufacture of vehicles,textiles and clothing, food, drink, and tobacco. In some BEIS electricity tables, industrial consumption includesenergy industry use.Energy industry use includes electricity used on works by generators (e.g., the consumption of electricity inpower plants for lighting, compressors, cooling systems), as well as that consumed by pumped storagestations in pumping water to the reservoir.Commercial sector use includes electricity consumed by shops, offices, hotels, restaurants, as well as thatconsumed by telecommunications and public administration services. In some BEIS electricity tables,commercial consumption also includes transport sector use.Transport sector use includes electricity used by rail and light rail companies (both over and underground)for traction purposes, and electricity used by electric road vehicles.Domestic sector use includes electricity consumed by households, covering final consumption acrossprepayment and credit meters, and peak and off-peak tariff rates. Domestic sector consumption of electricityshows seasonal variation across the year, with colder weather leading to an increase in electricity use due tohigher demand for heating, and vice versa.Other sectors’ use includes all remaining electricity consumed, which does not fall into the preceding sectorclassifications. What is included in this category is variable across BEIS electricity tables, but includeselectricity use for agriculture and public lighting.8
Electricity balanceAn electricity balance presents the components of electricity supply and demand using a common unit, andplaces them alongside one another in a manner that shows the dependence of one on the other. BEISquarterly and annual publications include electricity balances, and it is based on these balances that otherstatistics are compiled. The components of an electricity balance are displayed in the diagram below.In the electricity system, the level of supply is dependent on current demand as electricity cannot be storedeconomically on a large-scale. Electricity suppliers forecast future demand, and then agree contracts to buy anamount of electricity from a specific generator at a specific future time. However, as forecasts can differ fromactual demand, the balance between supply and demand is ensured through the operation of a centralisedbalancing mechanism. This allows electricity generators and suppliers to be contracted to change their supplyor demand to match the current demand level.1.5.1Statistical differenceIn electricity statistics production, data collected on generation/supply do not match exactly with data collectedon consumption and losses. This results in a statistical difference between the total generation and demand,which is within /- 0.5%. This difference exists as data for each industry is collected from different sources,with varying restrictions on when accurate data becomes available.9
2 PublicationsBEIS publishes monthly, quarterly, and annual electricity statistics, within two statistical publications: EnergyTrends and the Digest of UK Energy Statistics (DUKES).List of publicationsEnergy Trends is published each month, and Chapter 5 contains monthly (published two months in arrears)electricity statistics and quarterly (published one quarter in arrears) statistics and balances. The tablespublished within Energy Trends are described below.Table numberContentType of data5.1Fuel used in electricity generation and electricity suppliedQuarterly5.2Supply and consumption of electricityQuarterly5.3Fuel used in electricity generation by major producersMonthly5.4Electricity production and availability from the public supply systemMonthly5.5Availability and consumption of electricityMonthly5.6Imports, exports, and transfers of electr
Electricity Statistics – data sources and methodologies 1. Introduction The UK’s electricity system is a large system, with the following distinct businesses: generation, transmission, distribution and supply. The Department for Business, Energy and Industrial Strategy (BEIS)’s electri