Transcription
SPSSin a nutshell:what do my numbers tell?1.SPSS & TerminologyTimothy YeungDMSS, Library14 Nov 2018SPSSƒƒƒƒLevels of MeasurementUndisputable order?Statistical Package for the Social SciencesThe latest version is SPSS 25Alternatives: SAS, Stata, R, MATLAB Easy to learn, user- friendly, less l statusYesEqual intervals?NoYes3Gender4* Including both interval and ratioSESLevel of studyHeightSalaries
p- valueGiven that the nullhypothesis is true,how is the probabilityof observing yoursample results?Effect SizeRejecting the nullhypothesis ifp 0.05 *Chi-SquareWhy effect size?Chi-Square: Cramer’s VH0: two variables areindependentƒ p is sensitive to sample sizeT-test: Cohen's dƒ p reveals only an existenceof effectANOVA: Ș²p 0.01 **p 0.001 ***T-test and ANOVACorrelation: rH0: no difference in meansCorrelationH0: zero populationcorrelation coefficient56The datasetƒhttps:/ / goo.gl/ 2qWS1RID2.SPSS in PracticeGender0 Male1 FemaleMajor1 EC Edu2 Primary Edu 3 HistorySalary (k)Happiness(6 point Likertscale)8HP1: You wake up energetic.HP2: You feel relaxed at home.HP3: HP4: 4 Physics5 Chemistry
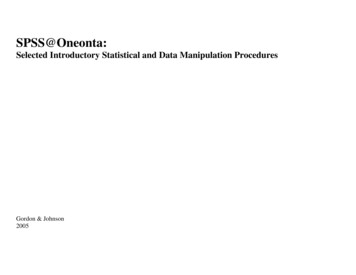
Descriptive StatisticsCreate new VariablesCentral TendencySpreadGraphƒ Meanƒ Quartilesƒ Bar chartƒ Medianƒ Varianceƒ Pie chartƒ Modeƒ Standard deviationƒ Histogramƒ Re- Categorization and Calculationƒ Major: 5 groups into 3 groupsƓ Education, History, Scienceƒ Happiness: total score of 4 questionsƓ SUM.4(HP1,HP2,HP3, )ƒ Transform ɦ Compute Variable / Recode intoDifferent VariablesAnalyze ɦ Descriptive Statistics ɦ Frequencies / Descriptives910“Choose the correct statistical testƒ https:/ / stats.idre.ucla.edu/ other/ multpkg/ whatstat/IV11DVAnalysis1 Nominal1 NominalChi- Square Independence Test1 Nominal/Ordinal (2 levels)1 ScaleIndependent- Samples T- test1 Nominal/Ordinal ( 2 levels) 1 ScaleANOVA1 ScalePearson Correlation1 Scale12Research Question 1Is there any relationshipbetween gender and fieldof study?
Which test?Chi- Square Independence Testƒ Gender and Major G3IVDVAnalysis1 Nominall1 NominalChi- Square Independence Test1 Nominal/ Ordinal (2 levels)1 ScaleIndependent- Samples T- test1 Nominal/ Ordinal ( 2 levels) 1 ScaleANOVA1 ScalePearson Correlation1 Scale1314“Chi- Square (cont.) 0.1 small 0.3 medium 0.5 largeƒ A significantigngnififificgniccant asassociationssos ciatioonn iss notednoteed betweenbetetweweeween gender andd fieldfielld of studystu15ƒ Analyze ɦ Descriptive Statistics ɦ Crosstabs(Ȥ(2)2) 54.627,54 62727 p .001,001001 V .354).354)3554) WhilWhile malel preferredfd tto studyt dScience, their female counterpart chose to study Education.16Research Question 2Is there gender differenceregarding happiness?
Which test?Independent- Samples T testƒ Gender and HappinesspIVDVDVAnalysis1 Nominall1 NominalNomChi- Square Independence Test1 Nominal/ Ordinal (2 levels)1 ScaleIndependent- Samples T- test1 Nominal/ Ordinal ( 2 levels) 1 ScaleANOVA1 ScalePearson Correlation1 Scale1718“T test (cont.) 0.2 small 0.5 medium 0.8 largeƒ AsAssumptionAssumssus mpmpttof equal variancesances holdsholdssƒ CCohen’sh ’ d 0.553 (Mean difference/erence/ ɰ((SDɰ((S(S 1 2 SD(SDD2 2 )/2))ƒ The result suggests that malee participantsparticipantticipanaanntst (M 14.15,144.15,5 , SD5,SD 3.282)19level of hahappinesess s tthan thehe femalefereported a significantly higherr levelhappinessparticipants (M 12.25, SD 3.569),3 569)9) t (42(429)2 529)5.632,632633 p .001,000 d .553ƒ Analyze ɦ Compare Means ɦ IndependentSamples T test20Research Question 3Do respondents withdifferent field of studyreport different level ofhappiness?
Which test?ANOVAƒ Major G3 and HappinessIVDVDVAnalysis1 Nominal1 NominalNomChi- Square Independence TestOrdin (2 levels)1 Nominal/ Ordinal1 ScaleIndependent- Samples T- testOrdin ( 2 levels) 1 Scale1 Nominal/ OrdinalANOVA1 ScalePearson Correlation1 Scaleƒ Analyze ɦ Compare Means ɦ One- Way ANOVA2122“ANONOVA (cont.) 0.01 small 0.06 medium 0.14 nionioon of equalequaal variancesvariances hovaholdsȘ²² 00.042.0420442 (SS( Sbetw(SSStotal)betweenbebeteen groups / SSANOVAVAA shshoshowsow s a main effect of field of study on level of happiness,iF(2(2,2 , 430430)0) 9.376,09301 Ș²² .042.042 PostP t hoch analysesld t majoringj i ini ScienceS ip .001,suggestt respondentsindicate a highest level of HP than the History major and Education major counterpart.24Research Question 4Is there relationshipbetween happiness andlevel of income?
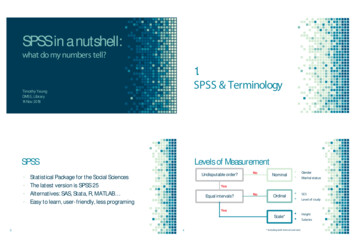
Which test?Pearson Correlationƒ Salary and HappinesspIVDVAnalysis1 Nominalminal1 NominalNChi- Square Independence Testminal/ OrdinalOr1 Nominal/(2 levels)Sc1 ScaleIndependent- Samples T- testminal/ OrdinalOrs) 1 Scale1 Nominal/( 2 levels)ScANOVAle1 ScalePearson Correlation1 ScScaleƒ Analyze ɦ Correlate ɦ Bivariate2526Correlation (cont.)Important!!!ƒ Always check if your data fulfill all assumptionsof analyses Ʋ0.1 small Ʋ0.3 medium Ʋ0.5 largeƒ27ƒ Don’t get caught up in statisticsPearson correlation was runun tooddetermineetereterrminee tthehe relationship between levelhof income and level of happiness.piinepinen ss. A significantlysignifiicccaan strong and positiveacorrelation was noted, r(417)17) .525,52525 p .001000128
Libraryƒ SPSS 25 are installed in L2 Academic Commonsand L4 MLCƒ Data Analysis Room:http:/ / library.hkbu.edu.hk/ forms/ dar.html3.Resources30Useful Websitesƒƒƒƒ31THANKS!https:/ / www.spss- tutorials.com/ basics/https:/ / statistics.laerd.com/https:/ / stats.idre.ucla.edu/http:/ / www.statisticshowto.com/Any questions?32Presentation template by SlidesCarnival
SPSS in a nutshell: what do my numbers tell? Timothy Yeung DMSS, Library 14 Nov 2018 1. SPSS & Terminology SPSS Statistical Package for the Social Sciences The latest version is SPSS 25 Alternatives: SAS, Stata, R, MATLAB Easy to learn, user-friendly, less programing 3 Levels of Measurement Gender Marital status 4 Nominal Scale* Ordinal