Transcription
Adopted June 2010Approved by EPA August 12, 2010Eight Total Maximum Daily Loadsfor Indicator Bacteria inGreens Bayou Above Tidaland TributariesSegments: 1016, 1016A, 1016B, 1016C, and 1016DAssessment Units: 1016 01, 1016 02, 1016 03, 1016A 02,1016A 03, 1016B 01, 1016C 01, and 1016D 01Prepared by theW ater Quality Planning Division, Office of W aterTEXAS COMMISSION ON ENVIRONMENTAL QUALITY
Eight Total Maximum Daily Loads for Indicator Bacteria in Greens Bayou Above Tidal and TributariesDistributed by theTotal Maximum Daily Load TeamTexas Commission on Environmental QualityMC-203P.O. Box 13087Austin, Texas 78711-3087TMDL project reports are available on the TCEQ Web site at: www.tceq.state.tx.us/implementation/water/tmdl/ The preparation of this report was financed in part through grants fromthe U.S. Environmental Protection Agency.This TMDL report is based in large part on the report titled“Technical Support Document: Indicator Bacteria Total Maximum Daily Loadsfor the Greens Bayou Watershed, Houston, Texas(1016 01, 1016 02, 1016 03, 1016A 02, 1016A 03, 1016B 01, 1016C 01, 1016D 01)”prepared by University of Houston and ParsonsTexas Commission on Environmental QualityiiAdopted June 2010
Eight Total Maximum Daily Loads for Indicator Bacteria in Greens Bayou Above Tidal and TributariesContentsExecutive Summary . 1Introduction . 2Problem Definition . 3Ambient Indicator Bacteria Concentrations . 4Watershed Overview . 4Endpoint Identification . 14Source Analysis . 14Regulated Sources . 14Wastewater Treatment Facilities. 14Sanitary Sewer Overflows . 15TPDES Regulated Storm Water . 15Illicit Discharges . 25Unregulated Sources . 25Wildlife and Unmanaged Animal Contributions . 26Non-Permitted Agricultural Activities and Domesticated Animals. 26Failing On-site Sewage Facilities. 26Domestic Pets . 28Bacteria Re-growth and Die-off . 30Linkage Analysis . 30Load Duration Curve Analysis . 30Load Duration Curve Results . 32Margin of Safety. 36Pollutant Load Allocation . 37Waste Load Allocation. 37Load Allocation . 43Allowance for Future Growth . 43TMDL Calculations . 45Seasonal Variation . 48Public Participation . 48Implementation and Reasonable Assurances . 48Implementation of the TMDL . 50References . 52FiguresFigure 1.Figure 2.Figure 3.Figure 4.Greens Bayou Above Tidal Watershed . 5Greens Bayou Above Tidal Watershed Land Use. 8Greens Bayou Above Tidal Watershed Precipitation Map . 10Greens Bayou Above Tidal Watershed Soil Types . 11Texas Commission on Environmental QualityiiiAdopted June 2010
Eight Total Maximum Daily Loads for Indicator Bacteria in Greens Bayou Above Tidal and TributariesFigure 5.Figure 6.Figure 7.Figure 8.Figure 9.Figure 10.Figure 11.Figure 12.Figure 13.Figure 14.Figure A-1.Figure A-2.Figure A-3.Figure A-4.Figure A-5.Figure A-6.Figure A-7.Figure A-8.Greens Bayou Above Tidal Watershed Sampling Locations andUSGS Gauge Locations . 13TPDES-Permitted Facilities in the TMDL Watershed. 21Sanitary Sewer Overflows in the TMDL Watershed . 23Areas without Sewers and Subdivisions with OSSFs in the TMDL Watershed . 27Load Duration Curve for Greens Bayou Above Tidal (1016 01, 1016 02) . 33Load Duration Curve for Greens Bayou Above Tidal (1016 03) . 33Load Duration Curve for Garners Bayou Above Tidal (1016A 02, 1016A 03). 34Load Duration Curve for Unnamed Tributary of Greens Bayou (1016B 01) . 35Load Duration Curve for Unnamed Tributary of Greens Bayou (1016C 01) . 35Load Duration Curve for Unnamed Tributary of Greens Bayou (1016D 01) . 36Allocation Loads for AU 1016 01 as a Function of Water Quality Criteria . 55Allocation Loads for AU 1016 02 as a Function of Water Quality Criteria . 56Allocation Loads for AU 1016 03 as a Function of Water Quality Criteria . 57Allocation Loads for AU 1016A 02 as a Function of Water Quality Criteria . 58Allocation Loads for AU 1016A 03 as a Function of Water Quality Criteria . 59Allocation Loads for AU 1016B 01 as a Function of Water Quality Criteria. 60Allocation Loads for AU 1016C 01 as a Function of Water Quality Criteria. 61Allocation Loads for AU 1016D 01 as a Function of Water Quality Criteria . 62TablesTable 1.Table 2.Table 3.Table 4.Table 5.Table 6.Table 7.Table 8.Table 9.Table 10.Table 11.Table 12.Table 13.Table 14.Table 15.Table 16.Table 17.Table 18.Table 19.TMDL Segments, Assessment Units, and First Year on 303(d) List . 3Historical Water Quality Data — February 1992 to March 2008 . 6Land Use Summaries. 7Average Rainfall for Each Assessment Unit Watershed. 9Characteristics of Soil Types within Greens Bayou Above Tidal Watershed. 12USGS Gauges in the Greens Bayou Above Tidal Watershed . 12WWTF Dischargers in the TMDL Watershed . 16Discharge Monitoring Report Data for Permitted Wastewater Discharges(January 1998-June 2007) . 22Sanitary Sewer Overflow Summary for the TMDL Watershed . 24Percent of MS4 Jurisdiction in the TMDL Watershed . 24Estimated Number of OSSFs and Fecal Coliform Load in the TMDL Watershed. 29Estimated Numbers of Pets in the TMDL Watershed . 29Estimated Fecal Coliform Daily Production by Pets (in Billion cfu) . 29Hydrologic Classification Scheme. 32Waste Load Allocations for TPDES-Permitted Facilities. 39Population Projection per Subwatershed . 44E. coli TMDL Summary Calculations for Greens Bayou Assessment Units . 46Final TMDL Allocations. 47Watersheds Included in Houston/Harris County Implementation Plan . 49Texas Commission on Environmental QualityivAdopted June 2010
Eight Total Maximum Daily Loads for Indicator Bacteria in Greens Bayou Above Tidal and TributariesList of WQMPWWTFAssessment UnitBest Management PracticeCoastal Change Analysis ProgramCode of Federal RegulationsColony-Forming UnitsCubic Feet per SecondDischarge Monitoring ReportEscherichia coliEnvironmental Protection AgencyFecal ColiformFlow Duration CurveGeographic Information SystemHarris County Flood Control DistrictHarris County Office of Homeland Security and Emergency ManagementHouston-Galveston Area CouncilLoad AllocationLoad Duration CurveMilliliterMillion Gallons per DayMargin of SafetyMost Probable NumberMunicipal Separate Storm Sewer SystemMunicipal Utility DistrictNew England Interstate Water Pollution Control CommissionNational Oceanic and Atmospheric AdministrationNational Pollutant Discharge Elimination SystemNonpoint SourceNatural Resources Conservation ServiceOnsite Sewage FacilitySanitary Sewer OverflowState Soil Geographic DatabaseStorm Water Pollution Prevention PlanTexas Commission on Environmental QualityTotal Maximum Daily LoadTexas Pollutant Discharge Elimination SystemUnited States Army Corps of EngineersUnited States Geological SurveyWaste Load AllocationWater Quality MonitoringWater Quality Management PlanWastewater Treatment FacilityTexas Commission on Environmental QualityvAdopted June 2010
Eight Total Maximum Daily Loads for Indicator Bacteria in Greens Bayou Above Tidal and TributariesTexas Commission on Environmental QualityviAdopted June 2010
Eight Total Maximum Daily Loads forIndicator Bacteria in Greens BayouAbove Tidal and TributariesExecutive SummaryThis document describes total maximum daily loads (TMDLs) for Greens Bayou AboveTidal and its tributaries, where concentrations of indicator bacteria exceed the criteria usedto evaluate attainment of the contact recreation use. The Texas Commission onEnvironmental Quality (TCEQ) first identified the impairments in the 1996 and 2002versions of the Texas Water Quality Inventory and 303(d) List.Greens Bayou is located in north central Harris County, about 10 miles north of the centralbusiness district of the City of Houston. The Greens Bayou non-tidal watershed drains anarea of about 140 square miles and encompasses the cities of Houston and Humble. Most ofthe watershed is highly developed, but some areas between U.S. Highway 59 and I-10remain undeveloped (HCFCD, 2008). There are about 200 miles of open streams within thewatershed.As described in the TCEQ’s “2004 Guidance for Assessing Texas Surface and FinishedDrinking Water Quality Data” (TCEQ 2004), the TCEQ requires a minimum of 10 samplesin order to assess support of the contact recreation use. Escherichia coli (E. coli) is thepreferred indicator bacteria for assessing the contact recreation use in freshwater. Fecalcoliform bacteria were the preferred indicator prior to 2000 and may be used when there isinsufficient E. coli data. For this project E. coli data were used for TMDL development. Thecriteria for assessing attainment of the contact recreation use are expressed as the number(“counts”) of indicator bacteria, typically given in most probable number (MPN—for E.coli) or colony-forming units (cfu—for fecal coliform) per hundred milliliters (100 mL) ofwater. These units are considered equivalent. For the E. coli indicator, the contact recreationuse is not supported when the geometric mean of all E. coli samples exceeds 126 MPN per100 milliliter (mL). The contact recreation use is also not supported if individual samplesexceed 394 MPN per 100 mL more than 25 percent of the time.The historical ambient water quality data for indicator bacteria (1992-2008) for 15 selectTCEQ water quality monitoring stations in the Greens Bayou Watershed were examined.Data collected prior to 2001 correspond to fecal coliform concentrations, while data for2001-2008 are primarily E. coli concentrations. All of the stations failed to meet waterquality criteria for E. coli. The geometric means of E. coli exceeded the standard and rangedfrom 243 MPN/100mL to 2,078 MPN/100mL.The most probable sources of indicator bacteria within the entire watershed are noncompliant wastewater treatment facility (WWTF) discharges, storm water runoff frompermitted storm sewer sources, sanitary sewer overflows, illicit discharges from stormsewers, failing on-site sewer facilities, and runoff from areas not covered by a permit.Texas Commission on Environmental Quality1Adopted June 2010
Eight Total Maximum Daily Loads for Indicator Bacteria in Greens Bayou Above Tidal and TributariesA load duration curve (LDC) analysis was used to quantify allowable pollutant loads andspecific TMDL allocations for point and nonpoint sources of indicator bacteria. The TMDLallocations are discussed in the “TMDL Calculations” section and are presented in Table 18.The waste load allocation (WLA) for WWTFs was established as the permitted flow timesone-half the geometric mean criterion for the indicator bacteria. Compliance with theseTMDLs is based on keeping the indicator bacteria concentrations in the selected watersbelow the limits that were set as criteria for the individual sites. Future growth of existing ornew point sources is not limited by these TMDLs as long as the sources do not causeindicator bacteria to exceed the limits. The assimilative capacity of streams increases as theamount of flow increases. Increases in flow allow for additional indicator bacteria loads ifthe concentrations are at or below the contact recreation standard. The TMDL calculationsin this report will guide determination of the assimilative capacity of each stream underchanging conditions, including future growth. Wastewater discharge facilities will beevaluated on a case-by-case basis.IntroductionSection 303(d) of the federal Clean Water Act requires all states to identify waters that donot meet, or are not expected to meet, applicable water quality standards. States mustdevelop a TMDL for each pollutant that contributes to the impairment of a listed waterbody. The TCEQ is responsible for ensuring that TMDLs are developed for impairedsurface waters in Texas.A TMDL is like a budget—it determines the amount of a particular pollutant that a waterbody can receive and still meet its applicable water quality standards. TMDLs are the bestpossible estimates of the assimilative capacity of the water body for a pollutant underconsideration. A TMDL is commonly expressed as a load with units of mass per period oftime, but may be expressed in other ways. TMDLs must also estimate how much thepollutant load must be reduced from current levels in order to achieve water qualitystandards.The TMDL Program is a major component of Texas’ overall process for managing thequality of its surface waters. The program addresses impaired or threatened streams,reservoirs, lakes, bays, and estuaries (water bodies) in, or bordering on, the state of Texas.The primary objective of the TMDL Program is to restore and maintain the beneficialuses—such as drinking water supply, recreation, support of aquatic life, or fishing—ofimpaired or threatened water bodies. This TMDL addresses impairments to the contactrecreation use due to exceedances of the indicator bacteria criteria in Greens Bayou AboveTidal, Garners Bayou, and three unnamed tributaries of Greens Bayou.Section 303(d) of the Clean Water Act and the implementing regulations of the U.S.Environmental Protection Agency (EPA) in Title 40 of the Code of Federal Regulations(CFR), Part 130 (40 CFR 130) describe the statutory and regulatory requirements foracceptable TMDLs. The EPA provides further direction in its Guidance for Water QualityBased Decisions: The TMDL Process (EPA 1991). This TMDL document has beenTexas Commission on Environmental Quality2Adopted June 2010
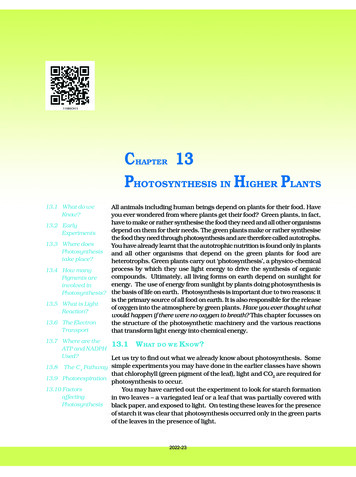
Eight Total Maximum Daily Loads for Indicator Bacteria in Greens Bayou Above Tidal and Tributariesprepared in accordance with those regulations and guidelines. The segments and assessmentunits (AUs) covered by this document were included in the 2008 303(d) list under category5a indicating that they are a priority for developing a TMDL.The TCEQ must consider certain elements in developing a TMDL. They are described inthe following sections of this report:§§§§§§§§§Problem DefinitionEndpoint IdentificationSource AnalysisLinkage AnalysisSeasonal VariationMargin of SafetyPollutant Load AllocationPublic ParticipationImplementation and Reasonable AssuranceThe commission adopted this document on June 2, 2010. Upon EPA approval, theseTMDLs will become an update to the state’s Water Quality Management Plan.Problem DefinitionThe TCEQ first identified the impairment to the contact recreation use for Greens BayouAbove Tidal in the 1996 Texas Water Quality Inventory and 303(d) List (1996 Inventoryand List), and Garners Bayou and three unnamed tributaries of Greens Bayou in the 2002Texas Water Quality Inventory and 303(d) List (2002 Inventory and List). All of thesesegments (Table 1) are freshwater bodies located in the northern metropolitan Houston area(Figure 1). In this document, the area that contains all of these segments will be referred toas the TMDL watershed.Table 1.SegmentNumberTMDL Segments, Assessment Units, and First Year on 303(d) ListFirst YearListedTypeAssessment UnitsGreens Bayou Above TidalFreshwater1016 01, 1016 02,1016 0319961016AGarners BayouFreshwater1016A 02,1016A 0320021016BUnnamed Tributary of Greens BayouFreshwater1016B 0120021016CUnnamed Tributary of Greens BayouFreshwater1016C 0120021016DUnnamed Tributary of Greens BayouFreshwater1016D 0120021016Segment NameThe standards for water quality are defined in the Texas Surface Water Quality Standards(TCEQ 2000). The specific uses assigned to the five segments included in this report areTexas Commission on Environmental Quality3Adopted June 2010
Eight Total Maximum Daily Loads for Indicator Bacteria in Greens Bayou Above Tidal and Tributariescontact recreation, aquatic life, general, and fish consumption. The criteria for assessingattainment of the contact recreation use are expressed as the number (“counts”) of indicatorbacteria, typically given in MPN (for E. coli) or cfu (for fecal coliform) per hundredmilliliters (100 mL) of water. These units are considered equivalent. The number may notexceed certain concentrations in a single sample, nor as a geometric mean of all samples.As described in the TCEQ’s “2004 Guidance for Assessing Texas Surface and FinishedDrinking Water Quality Data” (TCEQ 2004), the TCEQ requires a minimum of 10 samplesin order to assess support of the contact recreation use. E. coli for freshwater andEnterococci in tidal water are now the preferred indicator bacteria for assessing the contactrecreation use. Fecal coliform bacteria may be used when there is insufficient E. coli orEnterococci data, since fecal coliform was the preferred indicator prior to 2000. For thisproject E. coli data were used for data analysis and modeling to support TMDLdevelopment for Greens Bayou Above Tidal and its tributaries. Fecal coliform data are alsopresented for some sampling stations.For the E. coli indicator, if the minimum sample requirement is met, the contact recreationuse is not supported when:§§the geometric mean of all E. coli samples exceeds 126 MPN per 100 mL;and/or individual samples exceed 394 MPN per 100 mL more than 25 percent ofthe time.For the fecal coliform indicator, if the minimum sample requirement is met, the contactrecreation use is not supported when:§§the geometric mean of all fecal coliform samples exceeds 200 cfu per 100 mL;and/or individual samples exceed 400 cfu per 100 mL more than 25 percent of thetime.Ambient Indicator Bacteria ConcentrationsTable 2 summarizes the historical ambient water quality data for indicator bacteria (19922008) for select TCEQ water quality monitoring stations in the Greens Bayou Watershed.Data in Table 2 collected prior to 2001 correspond to fecal coliform concentrations, whiledata for 2001-2008 are primarily E. coli concentrations.Watershed OverviewGreens Bayou is located in north central Harris County, about 10 miles north of the centralbusiness district of the City of Houston. The Greens Bayou non-tidal watershed drains anarea of about 140 square miles and encompasses the cities of Houston and Humble. Thenon-tidal portion of the bayou flows across northern Harris County generally eastward fromits headwaters near Farm-to-Market 1960 for about 23 miles, and then turns at its confluencewith Garners Bayou and flows southward for about 7 miles to the confluence with Halls Bayou.The Harris County Flood Control District (HCFCD) has made channel improvementsTexas Commission on Environmental Quality4Adopted June 2010
Figure 1.Greens Bayou Above Tidal Watershed
Eight Total Maximum Daily Loads for Indicator Bacteria in Greens Bayou Above Tidal and TributariesTable 2.Historical Water Quality Data — February 1992 to March 2008NumberofSamplesNumber ofSamplesExceedingSingle SampleCriteria% ation1016 1016 021016 011016A 031016A 021016B 011016C 011016D 011137111376165891659016676SingleSampleCriteriaEC: E. coli in MPN/100mL, FC: Fecal Coliform in cfu/100mLTexas Commission on Environmental Quality6Adopted June 2010
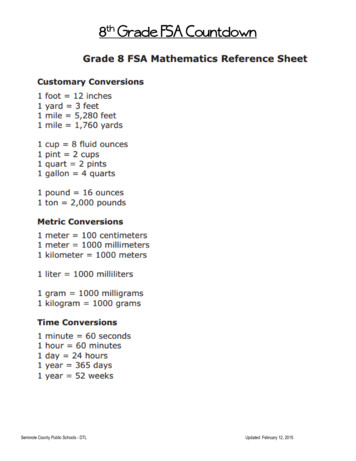
Eight Total Maximum Daily Loads for Indicator Bacteria in Greens Bayou Above Tidal and Tributariesupstream of U.S. Highway 90 (U.S. Army Corps of Engineers [USACE], 2005). Most of thewatershed is highly developed, but some areas between U.S. Highway 59 and I-10 remainundeveloped (HCFCD, 2008). There are about 200 miles of open streams within the watershed.Table 3 summarizes the acreages and the corresponding percentages of the land usecategories for the contributing watershed associated with each respective segment in theGreens Bayou watershed. The land use/land cover data were derived from the NationalOceanic and Atmospheric Administration’s (NOAA) Coastal Services Center. The specificland use/land cover data files were derived from the Coastal Change Analysis Program (CCAP), Texas 2005 Land Cover Data (NOAA 2007). The land use categories are displayedin Figure 2. The total acreage of each segment in Table 3 corresponds to the watersheddelineation in Figure 2. The predominant land use category in this watershed is developedland (between 44% and 85%) followed by woody land (between 10% and 31%). Openwater and bare/transitional land account for less than 2 percent of the subwatersheds.Table 3.Land Use SummariesSegment /Assessment Unit ID1016a1016Ab1016B 011016C 011016D 01Percent Developed Land5652448563Percent Cultivated Land0.00.00.00.00.0Percent Pasture/Hay3.03.21.21.90.4Percent Grassland/Herbaceous Land4.12.81.11.93.7Percent Woody Land2531261023Percent Open Water0.30.40.10.00.1Percent Wetland10.69.7281.89.0Percent Bare/Transitional .7000Acres Pasture/Hay1752698337613Acres Grassland/Herbaceous Land23815973079133Acres of Woody Land14,4176,795697387820Acres of Open 0.058,40421,6972,6984,0433,556Aggregated Land Use CategoryAcres of Developed LandAcres Cultivated LandAcres of WetlandAcres of Bare/Transitional LandWatershed Area (acres)abAUs 1016 01, 1016 02, and 1016 03AUs 1016A 02 and 1016A 03Texas Commission on Environmental Quality7Adopted June 2010
Figure 2.Greens Bayou Above Tidal Watershed Land Use
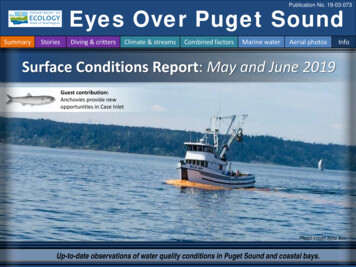
Eight Total Maximum Daily Loads for Indicator Bacteria in Greens Bayou Above Tidal and TributariesThe climate of the region is subtropical humid, with hot and humid summers and mild winters(U.S. Army Corps of Engineers [USACE] 1985). The average maximum daytime temperaturein the summer is 93 degrees Fahrenheit ( F), while the temperature averages between 39 and61 F during the winter. Summer rainfall is dominated by subtropical convection, winterrainfall by frontal storms, and fall and spring by combinations of these two (Burian andShepherd 2005). The 100-year floodplain encompasses about 22 percent of the drainage areaof the watershed, approximately 31 square miles (HCFCD 2008).There are 10 rain gauges located within the watershed (Figure 3). The gauges are maintainedby the Harris County Office of Homeland Security and Emergency Management (HCOEM).The Greens Bayou Above Tidal watershed experiences frequent rainfall events, with annualprecipitation totals of approximately 50 inches. Monthly rainfall totals are consistentthroughout the year. High intensity rainfall often causes localized street flooding andoccasional out-of-bank conditions. The watershed is located near the Gulf coast, and is subjectto extreme weather between June 1 and November 30 every year, although the chance oftropical weather declines dramatically in October. As a result, an extensive conveyance systemfor storm water has been developed throughout the area. Figure 3 shows average annualrainfall across the Greens Bayou watershed. This figure was developed by using data from 148HCOEM rain gauges located across Harris, Fort Bend, and Galveston Counties to estimaterainfall values at unobserved locations throughout the remainder of the watershed. Averagevalues by subwatershed are summarized in Table 4. These average values were used tosupport the development of flow duration curves.The State Soil Geographic Database (STATSGO) (National Resources Conservation Service[NRCS] 1994) information was used to characterize soil in the Greens Bayou Watershed. Thesoil types that dominate the watershed are primarily from the Clodine, Aldine, and Wockleysoil series (Figure 4). The distribution and attributes of the three soil series found in the GreensBayou watershed are listed in Table 5. All soil types in the watershed are somewhat poorlydrained, thus contributing to high runoff rates. The topography of the area is characteristic ofthe Texas Gulf Coastal Plains. The streambed has an average slope of about 0.07 percent (3.7feet per mile). Elevations in the watershed vary from about 123 feet above mean sea level nearthe headwaters to about 8 feet above mean sea level at the mouth of Greens Bayou (USACE2005).Table 4.Average Rainfall for Each Assessment Unit WatershedSegment/Assessment UnitAnnualAverage(Inches)1016 01, 1016 02, 1016 0350.31016A 02, 1016A 349.11016B 0154.61016C 0151.81016D 0149.1Texas Commission on Environmental Quality9Adopted June 2010
Figure 3.Greens Bayou Above Tidal Watershed Precipitation Map
Figure 4.Greens Bayou Above Tidal Watershed Soil Types
Eight Total Maximum Daily Loads for Indicator Bacteria in Greens Bayou Above Tidal and TributariesStream flow data is key information when conducting water quality assessments. The U.S.Geological Survey (USGS) operates flow gauges at four locations along Greens Bayou tomeasure flow and gauge heights. The period of
Eight Total Maximum Daily Loads for Indicator Bacteria in Greens Bayou Above Tidal and Tributaries Texas Commission on Environmental Quality ii Adopted June 2010