Transcription
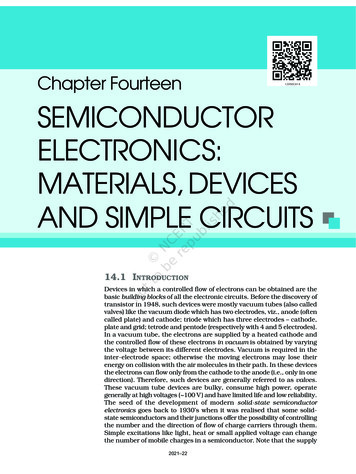
Semiconductor Optoelectronics (Farhan Rana, Cornell University)Chapter 2Semiconductor Heterostructures2.1 IntroductionMost interesting semiconductor devices usually have two or more different kinds of semiconductors. Inthis handout we will consider four different kinds of commonly encountered heterostructures:a)b)c)d)pn heterojunction diodenn heterojunctionspp heterojunctionsQuantum wells, quantum wires, and quantum dots2.2 A pn Heterojunction DiodeConsider a junction of a p-doped semiconductor (semiconductor 1) with an n-doped semiconductor(semiconductor 2). The two semiconductors are not necessarily the same, e.g. 1 could be AlGaAs and 2could be GaAs. We assume that 1 has a wider band gap than 2. The band diagrams of 1 and 2 bythemselves are shown below.Vacuumlevelq 1Ec1q 2Ec2Ef2Eg1Eg2Ef1Ev2Ev12.2.1 Electron Affinity Rule and Band Alignment:How does one figure out the relative alignment of the bands at the junction of two differentsemiconductors? For example, in the Figure above how do we know whether the conduction band edge ofsemiconductor 2 should be above or below the conduction band edge of semiconductor 1? The answercan be obtained if one measures all band energies with respect to one value. This value is provided by thevacuum level (shown by the dashed line in the Figure above). The vacuum level is the energy of a freeelectron (an electron outside the semiconductor) which is at rest with respect to the semiconductor. Theelectron affinity, denoted by (units: eV), of a semiconductor is the energy required to move an electronfrom the conduction band bottom to the vacuum level and is a material constant. The electron affinity rulefor band alignment says that at a heterojunction between different semiconductors the relative alignmentof bands is dictated by their electron affinities, as shown in the Figure above. The electron affinity ruleimplies that the conduction band offset at a heterojunction interface is equal to the difference in the
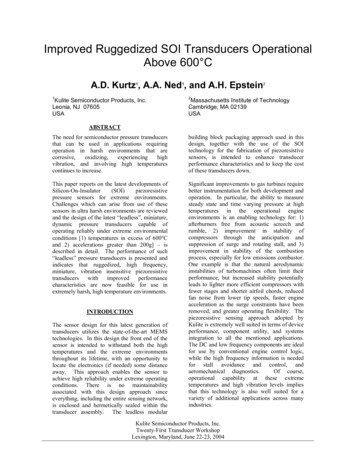
Semiconductor Optoelectronics (Farhan Rana, Cornell University)electron affinities between the two semiconductors. This is shown in the band diagram below. Accordingto the electron affinity rule the conduction band offset Ec is given as, Ec q 2 1 The valence band offset is then, Ev E g1 E g 2 Ec E g Ec Note that, Ec Ev E gEc1Vacuumlevelq 1q 2 EcEg1Ef1Ev1Ec2Ef2Eg2Ev2 EvDepending upon the difference between 1 and 2 we could have type I, type II, or type IIIheterojunction interfaces, as shown below.q 1q 1q 2Type I interfaceq 2Type II interface(Staggered gaps)q 2q 1Type III interface(Broken gaps)
Semiconductor Optoelectronics (Farhan Rana, Cornell University)The affinity rule does not always work well. The reason is that it attempts to use a bulk property ofsemiconductors to predict what happens at the interfaces and there is no good reason it should work in thefirst place. Usually, the conduction band offsets E c at interfaces are determined experimentally.Now we get back to the pn heterojunction and assume that:i)We have a type I interfaceii)The conduction band offset E c is known.iii)The doping in semiconductor 1 is p-type and equal to Na and the doping in semiconductor 2is n-type and equal to Nd and all dopants are ionized.The resulting band alignment is shown below:Vacuumlevelq 1Ec1q 2 EcEc2Ef2Eg1Eg2Ef1Ev1 Ev Ev2x2.2.2 A pn Heterojunction Diode in Thermal Equilibrium:Clearly the situation shown above in the Figure is not a correct description at equilibrium; the Fermi levelis not flat and constant throughout the structure. Let us see how this equilibrium gets established when ajunction is formed. There are more electrons in the region x 0 (where n n no N d ) than in the regionx 0n2(where n n po i 1 ). Similarly, there are more holes in the regionNax 0(wheren2p p po N a ) than in the region x 0 (where p pno i 2 ). Consequently, electrons will diffuseNdfrom the n-side into the p-side and holes will diffuse from the p-side into the n-side. Electrons on the nside are contributed by the ionized donor atoms. When some of the electrons near the interface diffuseinto the p-side, they leave behind positively changed donor atoms. Similarly, when the holes near theinterface diffuse into the n-side, they leave behind negatively changed acceptor atoms. As the electronand holes diffuse, a net positive charge density appears on the right side of the interface ( x 0 ) and a netnegative charge density appears on the left side of the interface ( x 0 ) . This situation is shown below.The charged regions are called depletion regions because they are depleted of the majority carriers. As aresult of the charge densities on both sides of the interface, an electric field is generated that points in thenegative x-direction (from the donor atoms to the acceptor atoms). The drift components of the electronand hole currents due to the electric field are in direction opposite to the electron and hole diffusivecurrents, respectively. As more electrons and holes diffuse, the strength of the electric field increases untilthe drift components of the electron and hole currents are exactly equal and opposite to their respectivediffusive components. When this has happened the junction is in equilibrium.
Semiconductor Optoelectronics (Farhan Rana, Cornell University)-1 (p-doped)-xp - 2 (n-doped)xn xRecalling that electrostatic potentials need to be added to the energies in band diagrams, the equilibriumband diagram looks like as shown below. Note that band bending that occurs inside the depletion regionsreflecting the presence of an electric field and a corresponding electrostatic potential. Also note that theFermi level in equilibrium is flat and constant throughout the device. The vacuum level also bends inresponse to the electric field, as shown.q 1Ec1VacuumlevelEg1 Ecq 2Ec2EfEfEv1Eg2 Ev-xp Ev2xnxBand bending implies an electric field and, therefore, a potential difference across the junction. This“built-in” potential Vbi can be found as follows. If we look at the “raw” band alignment (i.e. beforeconsidering any band bending) qV bi must the difference in the Fermi levels on the two sides of thejunction. This is because the bands need to band by this much so that the Fermi level is constant and flatthroughout the device in equilibrium.qV bi E f 2 E f 1Since, N N E f 2 E c 2 KT ln d E v 1 E f 1 KT ln a Nv 1 Nc 2
Semiconductor Optoelectronics (Farhan Rana, Cornell University)Adding these equations we get, N N qVbi E f 2 E f 1 E c 2 E v 1 KT ln a d N c 2 Nv1 N N qVbi E g1 E c KT ln a d N c 2 Nv1 N N E g 2 E v KT ln a d . N c 2 Nv 1 2.2.3 The Depletion Approximation:From the band diagram, one can see that the majority carrier concentrations in the depletion regions onboth sides of the junction are going to be small because the difference between the Fermi level and theband edges becomes large. The depletion approximation assumes that the majority carrier concentration isexactly zero in the depletion regions of thicknesses x p and x n on the p-side and n-side of the junction,respectively. It is a good approximation to calculate the junction electric field and potential. The netcharge density in the depletion regions is then due to the ionized donors and acceptors and is as shownbelow. The net charge on both sides of the junction has to be equal and opposite,qN d x n qN a x p (x) qNd -xp- xnx-qNa qN d x qN a 00 x xn xp x 0elsewhereKnowing the charge density one can calculate the electric field and the potential drops using Gauss’s law, qN d x n x 2 qN a x x pE x 1 0elsewhere 0 x xn xp x 0
Semiconductor Optoelectronics (Farhan Rana, Cornell University) qN x 2 qN x x x 2 2d n a p 0 x xn 2 2 1 2 qN a x x p xp x 0 x 2 1 2 qN a x p qN d x n2x xn 2 2 2 1 0x x p E(x)-xp xnx (x)Vbi-xpPotential drop on n-side is,N d x n22 2Potential drop on p-side is,qqN a x p22 1 xnx
Semiconductor Optoelectronics (Farhan Rana, Cornell University)This implies,N a x p2N d x n2Vbi q q2 22 1Using the above equation with qN d x n qN a x p gives the thicknesses of the depletion regions,1 2 2NVbix p 1 2 d N a 1N a 2 N d q1 2 2NVbix n 1 2 a N d 1N a 2 N d qTotal thickness of depletion region is,1 2 N a N d 2 V 2 1 2W xn x p bi q 1N a 2 N d N a N dCharge (per unit area) on one side of the junction, given by qN d x n qN a x p Q ,is,1 2 N NQ 2q 1 2 a d Vbi 1N a 2 N d 2.2.4 Quasi-Neutral Regions:The n and p regions outside the depletion region are called quasi-neutral regions because they alwaysremain, to a very good approximation, charge neutral even when the device is biased. This charge-neutralproperty is generally true for all good conductors. Significant charge densities cannot be present insidegood conductors because if a charge density were present then it would generate electric fields whichwould in turn generate drift currents that would neutralize the charge density. On length scales longerthan the screening length and on time scales longer than the dielectric relaxation time, good conductorsare charge neutral.2.2.5 A Reverse Biased pn Heterojunction:Now we attach metal (ohmic) contacts to the n and p sides, and apply a voltage V on the p contact w.r.t.the n contact, as shown below. We assume that, V 0 (reverse bias).1 (p-doped)-Wp - - - -xp V2 (n-doped)xn-Wnx
Semiconductor Optoelectronics (Farhan Rana, Cornell University)We will also assume that the applied potential falls completely across the depletion region (i.e. across thejunction) and not across the conductive n or p regions (quasi-neutral regions) or across the metal contacts.The effect of the applied voltage is taken into account by changing the electrostatic potential across thedepletion region from Vbi to Vbi V . Therefore, the depletion region width will change (and increasebecause V 0 ) to accommodate the added potential,1 2 Vbi V 2Nxn V 1 2 d Na 1Na 2Nd q1 2 Vbi V 2Nx p V 1 2 a Nd 1Na 2Nd qThe peak electric field in the junction will also increase and the resulting band diagram will look asshown in the Figure below.q 1Ec1VacuumlevelEg1 Ecq 2Ef1Ev1-qVEg2 EvEc2Ef2Ev2-xp xnxNote that now since an external voltage has been applied the device is no longer in equilibrium and theFermi levels on the n-side and the p-side are not the same. The splitting of the Fermi levels is exactlyequal to the applied voltage,qV E f 2 E f 1A current will also flow through the device but we will postpone the discussion of the current till wediscuss the forward biased case below.
Semiconductor Optoelectronics (Farhan Rana, Cornell University)2.2.6 A Forward Biased pn Heterojunction:Now we consider the case V 0 (forward bias). We will as before assume that the applied potential fallscompletely across the depletion region (i.e. across the junction) and not across the conductive n or pregions (quasi-neutral regions) or across the metal contacts. The effect of the applied voltage is taken intoaccount by changing the electrostatic potential across the depletion region from Vbi to Vbi V .Therefore, the depletion region width will change (and decrease because V 0 ) to accommodate theadded potential,1 2 Vbi V 2Nx n V 1 2 d Na 1Na 2Nd q1 2 Vbi V 2Nx p V 1 2 a Nd 1Na 2Nd qThe peak electric field in the junction will also decrease and the resulting band diagram will look asshown in the Figure below.Vacuumlevelq 1Ec1q 2 EcEg1Ec2Ef2qVEf1Ev1Eg2Ev2 Ev-xp xnxNote again that since an external voltage has been applied the device is no longer in equilibrium and theFermi levels on the n-side and the p-side are not the same. The splitting of the Fermi levels is exactlyequal to the applied voltage,qV E f 2 E f 12.2.7 Minority Carrier Injection and Current Flow:Calculating current flow in pn hetero junction diodes is complicated. The model presented here, called thedrift-diffusion model, is valid only if the band offsets Ec and Ev are small (compared to KT ). Theessential assumption in the drift-diffusion is that carrier drift and diffusion in the n-doped and p-dopedregions (not including the depletion regions) are the main bottleneck for electron transport and transport
Semiconductor Optoelectronics (Farhan Rana, Cornell University)through the depletion regions or at the heterointerface are not the main bottlenecks. These assumptions donot always hold. Nevertheless, drift-diffusion model provides some useful insights.The current flow in a forward biased pn device can be understood as follows. In equilibrium, the driftcomponents of both the electron and hole currents balanced the respective diffusive components. When aforward bias is applied, the electric field in the junction is reduced and therefore the drift components ofthe electron and hole currents also decrease. The diffusion components of the electron and hole currentsare then larger than the drift components and, therefore, a net current will flow through the device and thiscurrent will be diffusive in nature. Below we calculate this current.The assumption here is that the main bottleneck to electron and hole transport in the device comes fromthe quasi-neutral regions and electron and hole transport through the depletion region (whether due todrift or diffusion) is not the bottleneck. Consequently, one may assume that the electrons in the depletionregion are in equilibrium with the electrons in the n-doped side (and share the same Fermi level) andholes in the depletion region are in equilibrium with the holes on the p-doped side (and share the sameFermi level). This is the reason why the Fermi levels E f 1 and Ef 2 , as drawn in the band diagram underforward bias, are extended into the depletion regions. We can therefore write,n( x p ) N c1 e n i21Na N c1 e Ef 1( x p ) Ec ( x p ) KT e Ef 2 ( x p ) Ef 1( x p ) KTe qV KT n po e qV KTp( x p ) Nv 1 eAnd, Ef 2 ( x p ) Ec ( x p ) KT Ev ( x p ) Ef 1( x p ) KT Nan( x n ) N c 2 e Ef 2 ( xn ) Ec ( xn ) KT N dp( x n ) Nv 2 e Ev ( xn ) Ef 1( xn ) KT Nv 2 e Ev ( xn ) Ef 2 ( xn ) KT e Ef 2 ( xn ) Ef 1( xn ) KTn2 i 2 e qV KT pno e qV KTNdWhen a voltage is applied across the junction, the electric field in the depletion region is reduced, and thediffusion currents exceed the drift currents. Electrons diffuse from the n-side through the depletion regioninto the p-side and holes diffuse from the p-side through the depletion region into the n-side. Whathappens to the electrons once they make it to the p-side? They keep diffusing but they suddenly find agreat number of holes with which to recombine. The generation-recombination rate of these “injected”electrons (which are minority carriers) on the p-side is given by,n x n poRe x Ge x e1By assumption, there is no potential drop across the quasi-neutral p-doped region, therefore the electricfield in this region is (almost) zero and the electron current is entirely due to diffusion, n x .J e x q De1 xSince, n 1 J e x G e x R e x t q xAnd, n 0 (no time dependence in steady state) t
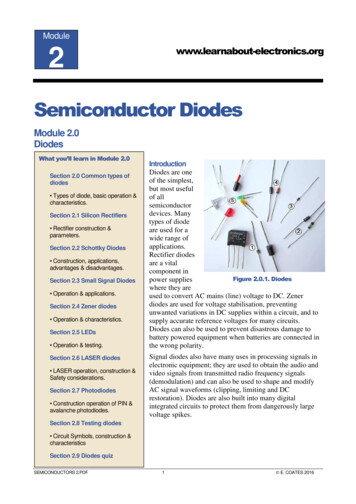
Semiconductor Optoelectronics (Farhan Rana, Cornell University)We get, De1 2 n x x 2 2 n x x 2 n x n po e1n x n poL2e1Le1 De1 e1 Minority carrier diffusion lenghtSimilarly, for the holes injected into the n-side the corresponding equation is, 2 p x x2 p x pnoL2h 2Lh 2 Dh 2 h 2To solve the above two equations we need appropriate boundary conditions. Consider first the electronson the p-side. One boundary condition is,n( x p ) n po e qV KTThe second boundary condition is usually obtained by assuming that at the left most metal contact therecombination time is extremely fast so that the electron density must equal the equilibrium density,n( W p ) n poThe solution for the electron density is then, Wp x sinh qV Le1 KTn x n po n poe 1 Wp xp sinh Le1 Similarly, for the holes on the n-side one obtains, W x sinh nqV Lh 2 KT p x p no pnoe 1 Wn x n sinh Lh 2 These solutions are sketched in the Figure below. W p x x px n x Wnp(x)n(x)-Wp-xp xnWnThe electron current density J e x (due to diffusion) can now be found on the p-side,x
Semiconductor Optoelectronics (Farhan Rana, Cornell University)J e x q De1 n x x Wp x cosh qvDe1 Le1 KT qe 1 W p x x p N a Le1 Wp x p sinh Le1 The hole current density on the n-side is, p x J h x q D nh x W x cosh nqv n i22 D h 2L n 2 KT exn x Wn q 1 N d Lh 2 Wn xn sinh Ln 2 The total current density is the sum of the electron and the hole density,J T J e x J h x The total current density must be independent of position in the steady state. We can find JT if we knowboth J e x and J h x at any one location. If one ignores recombination and generation processes insidethe depletion region then the electron and hole current density must be constant throughout the depletionregion,J e x p J e x n J e x { x p x x n }n i21 J h x p J h x n J h x { x p x x n }But, e KT 1 qv n2 D W x n KT eJ h x n q i 2 h 2 coth n 1 N d Lh 2L h2 n i21 De1 Wp xpJe x p qcoth N a Le1 Le1 qv qv n2 D W p x p n i22 Dh2 W n x n KT i 1 e1 e JT q coth coth Lh2 N a Le1 Le1 N d Lh2 The current in the external circuit is, qv KTI AJT I o e 1 where, n2 D W p x p n i22 Dh2 Wn x n cothI o qA i 1 e1 coth Lh 2 N a Le1 Le1 N d Lh2 1
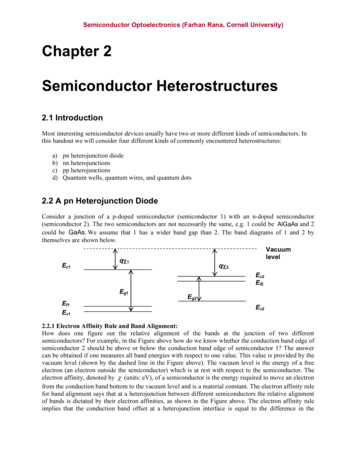
Semiconductor Optoelectronics (Farhan Rana, Cornell University)2.2.8 Majority Carrier Dynamics and Quasi-Neutrality:We know n x for W p x x p . Since n x in this range is greater than the equilibrium electrondensity n po the presence of these injected electrons can create charge imbalances, resulting in netnegative charge density on the p-side and cause large electric fields. But this never actually happensbecause the majority carriers (i.e. the holes) move to quickly screen these injected carriers and maintaincharge neutrality (“quasi neutrality” as it is called). Therefore, in steady state, p x p x N a n x n x n po W p x x pand similarly on the n-side, n x n x N d p x p x pno x n x W nThe excess majority carrier concentration therefore equals the excess minority carrier concentration tomaintain charge neutrality. On the p-side the hole currents is, p x J h x qp x μ h1E x q Dh1 x JT J e x We know J e x on the p-side and we know JT and therefore we can calculate J h x . On the n-side,the electron current is, n x J e x qn x e 2 E x q De 2 x JT J h x Again, we know J h x on the n-side and we can calculate J h x . All the current so obtained densitiesare plotted in the Figure below.JTJe(x)-WpJh(x)-xp xnWnxWe can now sketch the electron and hole Fermi levels through the entire device in forward bias. These areshown in the Figure below. As the injected minority carries reach equilibrate with the majority carriers,the minority carrier Fermi level approaches the majority carrier Fermi level.
Semiconductor Optoelectronics (Farhan Rana, Cornell University)Vacuumlevelq 1Ec1q 2 EcEg1Ec2Ef2qVEf1Eg2Ev1Ev2 Ev-xp xnx2.2.9 Cuurent Flow in Reverse Biased pn Heterojunction:We now go back to the case of the reverse biased pn heterojunction and study the current flow. Note thatall formulas derived for the forward bias case are also applicable to the reverse bias case. The banddiagram in reverse bias is then as shown below.The expression for the total current is therefore also valid for the reverse bias case, qv I I o e KT 1
Semiconductor Optoelectronics (Farhan Rana, Cornell University)When the reverse bias voltage is large the current approaches I o . Why is there a small negative current I o ? This is due to electron and hole generation in the n and p quasi-neutral regions. When V 0 inforward bias, the electron (hole) density on the p-side (n-side) increases above its equilibrium value as aresults of minority carrier injection via increased diffusion. When V 0 in reverse bias, the electron(hole) density on the p-side (n-side) is pulled below its equilibrium value. This happens because inreverse bias the electric field in the depletion region increases and the drift components of the electronand hole currents exceed the corresponding diffusion components. The large electric field in the depletionregion in reverse bias sucks the minority carriers and transfers them across the depletion region.Consequently, minority carrier generation rate exceeds the recombination rate in the quasi-neutralregions, and this generation of minority carriers on both sides of the depletion region and the subsequenttransfer of these generated carriers across the depletion region is responsible for the current in a reversebiased diode. An important rule of thumb to remember is that when the conduction electron Fermi level islarger than the valence electron Fermi level (or the hole Fermi level) then the recombination rate exceedsthe generation rate (as in a forward biased device) and when the conduction electron Fermi level issmaller than the valence electron Fermi level (or the hole Fermi level) then the generation rate exceedsthe recombination rate (as in a reverse biased device).2.2.10 Generation and Recombination in the Depletion Region:Generation and recombination in the depletion region also contributes to the total diode current in bothforward and reverse bias. Consider the electron current inside the depletion region. The continuityequation in steady state gives,1 J e x G e x R e x q xIntegrating over the depletion region gives, xnJ e x n J e x p q R e x Ge x dx xpSimilarly, we get for the hole current, xn J h x p J h x n q R h x Gh x dx xpIn the derivation for the total diode current, we added the electron and hole currents at one edge of thedepletion region. The same procedure now yields, qv n2 Dxn W p x p n i22 Dh2 W n x n KT i 1 e1 eJT q coth coth1q Re x Ge x dx Lh2 xp N a Le1 Le1 N d Lh2 The current in the external circuit is, qvxn KTI AJT I o e 1 qA R e x Ge x dx xp The second term on the right hand side also generally has an exponential dependence on the appliedvoltage. For example, in the case of trap-assisted recombination-generation (the dominant mechanism insilicon pn diodes),Ge x R e x np n i2 Inside the depletion region,np n i2 e Efc Efh KT
Semiconductor Optoelectronics (Farhan Rana, Cornell University)and therefore, qv Ge x R e x e KT 1 2.3 A nn Heterojunction2.3.1 A nn Heterjunction in Thermal Equilibrium:Consider the following nn heterojunction.q 1Ec2Ef2 EcEc1Ef1Eg1Ev1Vacuumlevelq 2Eg2 EvEv2 xnThe band diagram in equilibrium looks like as shown below. There is a small depletion region formed onthe right side of the junction and a small accumulation region formed on the left side of the junction.The built-in voltage of the junction is,qVbi E f 2 E f 1which can also be written as, NN qVbi E f 2 E f 1 E c KT ln d 2 c1 N d1 N c 2 One can go further and calculate the electric field and potential on both sides of the junction. Let thepotential drop in semiconductor 1 be 1 and let it be 2 in semiconductor 2. 1 2 VbiThe potential drop in the depletion region can be related to the thickness of the depletion region, 2 qN d 2 x n22 2
Semiconductor Optoelectronics (Farhan Rana, Cornell University)q 1q 2 EcEc1EfEc2Eg1Ev1VacuumlevelEg2 EvEv2 xnIn region x 0 , assume that the potential is zero at . Then we can write,n x N c 1Ef Ec1 x KTe N c1 en x N c 1Ef Ec1 q x KTEf Ec KTeq x e KTq x e KTn x N d 1Poisson equation gives, 1 1 2 x x 2 2 x x2 q Nd1 n x q x q N d1 1 eKT q x 2 N1 KT e 1 2q x x x 1 Integrate from to 0 using the boundary conditions, 0 0 1 to get, x 2 q 1 2N d 1 KT KT q 1 1e KT 1 x 0 q 1 KT q E x x 0 1 1 e 1 KT The electric fields on both sides of the junction are related by Gauss’s law,2N d 1 KT
Semiconductor Optoelectronics (Farhan Rana, Cornell University) 2 E x x 0 1 E x x 0 qN d 2 x n q 1 q KT 2 1N d 1KT e 1 1 qN d 2 x n KT (1)also,qN d1x n2 Vbi(2)2 1Equations (1) and (2) can be solved for x n , 1 and 2 2 2.3.2 Current Flow by Thermionic Emission and Quantum Mechanical Tunneling:Suppose now a voltage is applied from an external source such that the potential on the right sideis increased by V . The band diagram looks as shown in the Figure.q 1 on q 2Ec2Ef2Eg2 EvEv2 xnComputing current flow across the junction depends on prior knowledge or assumption of themain bottleneck to current flow in the device. The bottleneck can be either transport across theheterojunction interface via thermionic emission or quantum mechanical tunneling or thebottleneck can be the subsequent transport of the electrons via drift-diffusion. Current flowacross the heterojunction interface is by two mechanisms:i)Thermionic emission over the heterojunction barrierii)Quantum mechanical tunneling through the heterojunction barrierBoth these mechanisms are depicted in the band diagram above. Generally transport across theinterface rather than drift-diffusion in the quasi-neutral regions is the main bottleneck to currentflow. Suppose the electron energy band dispersion in both semiconductor 1 is,E k E c1 k x2 k y2 k z22m e1 The electron velocity in the x-direction is given by,v x k x 1 E k k x m e1 k xLet the quantum mechanical transmissionprobability of electrons for getting through the barrier (either through it or over it) be t k . Electron flux going from left to right is:
Semiconductor Optoelectronics (Farhan Rana, Cornell University) dk y dk z dk x v x k x t k f E k E f 1 1 f E k E f 2 2 2 0 2 Similarly, the flux from right to left is, dk y dk 0 dk zxFR L 2 v x k x t k f E k E f 2 1 f E k E f 1 2 2 2 The total electron flux is the difference between the right moving and left moving fluxes,F FL R FR L dk y dk dk zx 2 v x k x t k f E k E f 1 f E k E f 2 2 2 0 2 And the current is then, dk y dk dk zxI qAF 2qA v x k x t k f E k E f 1 f E k E f 2 2 2 0 2 The negative sign comes in because current is in direction opposite to the electron flux.FL R 2 2.4 Quantum Wells, Energy Subbands, and Reduced Density of Statesin Two DimensionsConsider a thin layer of a semiconductor with a smaller bandgap sandwiched between two wider bandgapsemiconductors, as shown below.Ec1Ec2Ev2QuantumWellLEv10zIf the length L of the smaller bandgap material is smaller than the electron decoherence length then theelectron energies in the smaller band gap material are quantized. The electrons in the smaller bandgapmaterial are confined in the potential well formed by the conduction band discontinuities but are free inthe plane of the quantum well (the x-y plane). Semiconductor 2 is called the quantum well andsemiconductor 1 is called the barrier. We will solve this problem using the effective mass theorem.2.4.1 Effective Mass Theorem:The effective mass theorem is very useful in the context of semiconductor heterostructures. Consider asemiconductor with conduction band energy dispersion given by, 2 Ec k Ec k K c . M e 1 . k K c2
Semiconductor Optoelectronics (Farhan Rana, Cornell University) According to the effective mass theorem the wavefunction r of an electron in the semiconductor in the vicinity of wavevector K c is most generally written (even in the presence of an added potential V r ) as a product of the Bloch function c,K r and a slowly varying envelope function r ,c r r c,K r c where r satisfies the effective mass Schrodinger equation, Ec i V r r E r The above equation can be used to find the energy of the electron.For the quantum well problem, we assume parabolic-isotropic conduction and valence bands for both thesemiconductors. Consider first the conduction band states. The conduction band energy dispersions are, 2E c1 k E c1 k x2 k y2 k z22m e1 2k x2 k y2 k z22m e 2In semiconductor 1, the barrier, the effective mass equation is, 2 2 E c1 ( r ) E ( r ) 2m e1 In semiconductor 2, the quantum well, we have, 2 2 E c 2 ( r ) E ( r ) 2m e 2 The solutions are of the form,E c 2 k E c 2 ik y e ik x x e y (r ) A sin (k z z )LxLy LLor z 22ik x x ik y y ee (r ) B cos (k z z ) LxLy L z LxLy 2 ik y Le ikx x e y (r ) D e z L 2 z 2LxLy The solution form corresponds to the electron confined in the potential well formed by the conductionband discontinuities but free in the plane of the quantum well (the x-y plane). We have also assumed thatthe area of the quantum well in the x-y plane is L x L y . The effective mass equation in the well gives, (r )
d) Quantum wells, quantum wires, and quantum dots 2.2 A pn Heterojunction Diode Consider a junction of a p-doped semiconductor (semiconductor 1) with an n-doped semiconductor (semiconductor 2). The two semiconductors are not necessarily the same, e.g. 1 could be AlGaAs and 2 could be GaAs.We assume that 1 has a wider band gap than 2.