Transcription
INDIANA’S EDUCATIONFUNDING, EXPLAINEDJust the Facts:How K-12 School Funding Works & Where Our Education Dollars GoWritten and Compiled by the House Republican Policy and Ways & Means Staff
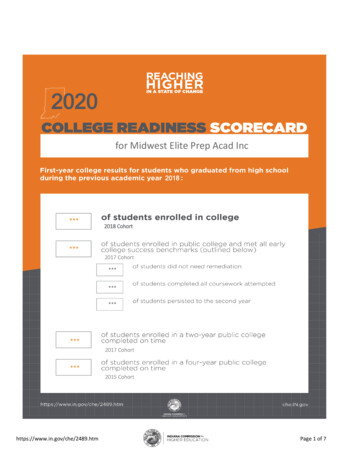
1Indiana’s Education Funding Explained - Highlights On average, a 20 student school corporation classroom receives 201,902 in combined state,local, and federal government financial support. Indiana traditional public school teachers were paid an average of 50,937 during the 20182019 school year, according to the National Education Association (NEA). Indiana public school teachers were paid an average of 56,175 when adjusted for costof-living differences, ranking in the top half of states nationally (22nd highest). Data from the U.S. Department of Education’s National Center for Education Statistics (NCES)shows that between the 2007-2008 and 2016-2017 school years, traditional public schoolenrollment decreased by 3% and the number of teachers decreased by 3.5%. However, the number of public school administrative staff increased by 31% over thesame time period. 12.43B was spent on K-12 education in Indiana during the 2017-2018 school year (total state,local, and federal government spending). This equates to an average of 10,095 in per student funding for traditional public schools. 7.3B was invested in K-12 state tuition support for the 2019-2020 school year (FY 2020) and 7.5B in state tuition support was appropriated for the 2020-2021 school year (FY 2021). This equates to an average of 6,795 in per student state funding for traditional publicschools (the average voucher award for the 2018-2019 school year was just 4,422). 73% (or 785M) of all new General Fund spending in the new state budget went to K-12education, when Department of Child Services (DCS) and Medicaid are excluded. K-12 spending accounted for more than half of the overall state budget. The state has increased annual K-12 tuition support by 1.2B between FY 2012 and FY 2021. This equates to an 18% increase in state funding over nine years. Student population will increase by only 4% over the same period. Indiana ranked 3rd in the nation, after Vermont and Kansas, for the highest percentage shareof its state budget dedicated to K-12 education (National Association of State Budget Officers). During the 2018-2019 school year, the vast majority of traditional public school teachers receiveda raise according to the Indiana Education Employment Relations Board (EERB). 82% of public school teachers received a base salary increase of 1,299 on average. According to the EERB report, traditional public school teachers were paid anaverage of 52,737, which is slightly higher than the number reported by the NEA. A 4.6% increase over EERB’s 2017-2018 average teacher salary data: 50,425. 62% of public school teachers received a one-time stipend of 897 on average. Only 58.1% of Indiana public school expenditures made it to the classroom during the 20162017 school year (FY 2017), according to the Office of Management & Budget’s latest figures. In 2016, Indiana had the 3rd lowest percentage in the nation (41.5%) of total public K-12staff serving as classroom teachers according to March 2019 NCES data.Prepared by the House Republican Fiscal Policy Department. For internal use only.
2Current State Biennial Budget (FY 2020 – FY 2021)The most recent state biennial budget (House Enrolled Act 1001 – 2019) heavily prioritized K-12education funding in terms of BOTH new and total spending. Total K-12 education investmentsaccounted for 17.4B (50.2%) of the state’s 34.6B general fund appropriations for FY 2020 – FY 2021.Total K-12 education funding received 42% of new spending over this biennium. As the following tableillustrates, if funding increases for the Department of Child Services and Medicaid are set aside, totalK-12 education accounted for 73% of all new spending:New Spending Analysis (HEA1001--2019)FY 2019 BaseTotal AppropriationsK-12 Tuition SupportTRF 96 (one-time)*Other K-12Total K-12Higher EducationStudent Financial AidDCSMedicaid AssistanceEverything Else 16,354 7,153 0 1,216 8,369 1,536 339 679 2,374 3,058FY 2020 17,100 7,331 150 1,250 8,731 1,536 374 910 2,485 3,065FY 2021 17,489 7,514 0 1,278 8,792 1,584 388 900 2,619 3,208New vs FY19% of New Base 1,881 539 150 96 785 49 84 452 356 157Total % K-12 excludingDCS and .2%14.0%8.9%73.1%*Total FY 2020 appropriations does not include the one-time transfer of 150M from reserves to the Post-1996 TRF.Under the current 34.6B state biennial budget (FY 2020 – FY 2021): The 785M in new total spending is the largest K-12 funding increase in state history. Total K-12 Education spending, including all programs and pensions, increased from 16.6B inthe prior budget to 17.4B (plus 150M TRF transfer) in the current budget, an 4.7% increase. Direct state support for K-12 education increased by 689M, or 9.6% versus the FY 2019 base.o Tuition support alone will increase 539M (2.5% in each of the next two years).o The Post-1996 Teacher Retirement Fund received a 150M one-time transfer, resultingin ongoing annual savings of roughly 70M for traditional public school corporations. Other new and existing statewide K-12 programs received an investment of 74M in new dollars.Prepared by the House Republican Fiscal Policy Department. For internal use only.
3The State Tuition Support Funding FormulaIndiana allocates the overwhelming majority of state K-12 education funding (86%) via the state tuitionsupport funding formula, or state tuition support. Prior to 2009, the tuition support formula was fundedthrough a combination of state and local tax dollars. Since 2009, the tuition support formula has beenfunded only with state tax dollars. The tuition support formula calculates state tuition support fortraditional public schools, public charter schools (including virtual charter schools), and ChoiceScholarships. Dollars received by schools from the tuition support formula are generally used to payfor operating expenses, such as salaries for teachers and staff, administrative costs, supplies, andutilities. For the upcoming 2019-2020 school year, the tuition support formula will distribute funding toeducate more than one million Hoosier students (est. 1,066,826) across 289 school corporations, 75charter schools, five virtual charters, and more than 37,000 Choice Scholarship recipients.Under House Republican leadership, the tuition support formula has held firm to three key principles:1. Money follows the child (i.e., the Foundation grant);2. Additional needs receive additional resources (i.e., Complexity and Special Ed Grants); and3. Schools should be rewarded for positive outcomes (i.e., Career & Technical Education Grantsand Honors Diploma Grants).The tuition support formula’s fundamental building block is student enrollment. The official enrollmentcount—often referred to as Average Daily Membership (or ADM count)—relies upon two count dates(fall and spring). The official ADM counts are used to determine how much basic tuition support funding(i.e., the Foundation Grant plus Complexity Grant) each school corporation will receive throughout theschool year, which aligns with the July-June state fiscal year. Public schools receive their first monthlytuition support distribution for a given school year in July. The July distribution is based on ADMestimates that schools provide to the Indiana Department of Education (DOE) by April 1 of the prioryear. Once the September ADM count is certified, DOE reconciles the tuition support distributions forthe first six months of the fiscal year (July through December) to match actual enrollment. Once thesecond count date is certified, DOE reconciles the tuition support distributions for the remaining sixmonths. There are several supplemental counts that are used to determine other “categorical” grants:Special Education, Honors Diploma, and Career & Technical Education (CTE). The Special EducationGrant count is December 1 of the preceding state fiscal year and reconciled before February 1 of thecurrent fiscal year.TheHonors Diploma Grants aredetermined by the number ofstudents who received a stateHonors Diploma in theprevious school year. CTEGrants are based CTEcourses enrollment at theSeptember ADM count.Indiana has increased tuitionsupport by 1.2B (18%)between FY 2012 and FY2021, but total statewide K-12enrollment has remainedrelatively flat, with just a 4%increase in total enrollmentover the same period (seetable to the right).Prepared by the House Republican Fiscal Policy Department. For internal use only.
4Every public school (both traditional and charter) receives the same base amount of per studentfunding, which is referred to as the Foundation grant. Schools receive additional funding depending ona variety of factors: the number of students that are in foster care or receive government assistance inthe form of TANF or SNAP (food stamps); the number of Honors Diplomas issued in the prior year; thenumber of special education students served; and enrollment in career and technical education (CTE)courses. The amount and criteria for these categorical grants is statutorily defined. The Foundation grant for the 2019-2020 school year is 5,548 per student.o The Foundation grant will increase to 5,703 (or 2.8%) for the 2020-2021 school year.The Complexity Index for a particular school is determined by the number of students enrolledat the school that receive SNAP, TANF, and/or foster care.o The Complexity grant for the 2019-2020 school year is 3,650 per student and willincrease to 3,675 per student for the 2020-2021 school year.o Four school corporations with very high English-Language Learner (ELL) populations areeligible for extra complexity funding, which equates to 128 per student.Special education funding varies by the severity of each eligible student’s special needs.o Per student grant awards range from 500 up to 9,156 for students with severedisabilities.o The current Pre-K Special Education Grant is 2,875 per student and will increase to 3,000 per student for the 2020-2021 school year.Schools receive 1,100 for each Honors Diploma awarded, or 1,500 if the student that earnedthe Honors Diploma was from a low-income family.Career & Technical Education funding varies by course classification as determined by theDepartment of Workforce Development and State Board of Education; this grant encouragesschool corporations to offer courses in high-wage, high-demand fields.o For example, introductory courses receive a 150 grant while apprenticeships and highwage, high–demand training is reimbursed at 500 to 1,020 per student, respectively.Virtual charter schools receive only 85% of the Foundation grant.Since only public school corporations receive property taxes, high-performing and new publiccharter schools receive a 750 per student grant outside of the tuition support formula.o The total cost of the grant program will be 22.5M each of the next two school years.The Foundation grant has increased 1,423 (33.2%) over the last five biennial state budgets:Prepared by the House Republican Fiscal Policy Department. For internal use only.
5The funding gap between the highest and lowest school corporation has fallen 41% since FY 2012.Prior to the first tuition support formula enacted by the House Republican majority in 2011, the tuitionsupport formula stressed funding buildings rather than individual students, resulting in great disparitiesin per student funding across similarly situated school corporations. The highest and lowest tuition support per student between school corporations for the 2018-19school year was 8,430 and 5,970, respectively – resulting in a 2,460 gap. However, that gap was 4,721 during the 2010-2011 school year, which was the last tuitionsupport formula year prior to the House Republican majority (see table below). The primary driver of the current gap is the Complexity Index, which varies among schoolcorporations depending on the income level of the school’s student population.The tuition support versus ADM breakdown by school type for the 2019-2020 school year (FY 2020) is: School corporations. 92.3% of the students and 93.4% of the funding. Public charter schools . 2.8% of the students and 3.1% of the funding. Virtual Public Charter Schools. 1.3% of the students and1.1% of the funding. Choice Scholarships (vouchers) . 3.6% of the students and 2.4% of the funding.School Funding Formula (State Tuition Support), FY2019-FY2021School CorporationsCharter SchoolsVirtual Charter SchoolsChoice ScholarshipsMitch DanielsTOTALFinal FY 2019 6,709,622,562 203,087,333 79,025,573 160,486,949 1,048,000 7,153,270,417%93.80%2.84%1.10%2.24%0.01%100%School CorporationsCharter SchoolsVirtual Charter SchoolsChoice ScholarshipsMitch DanielsTOTALFinal FY 60%1.23%3.41%0.02%100%Total Funding(Est.) FY 2020% 6,847,664,293 93.40% 224,014,368 3.06% 83,173,886 1.13% 175,367,520 2.39% 1,220,000 0.02% 7,331,440,067 100%ADM(Est.) FY 79%1.32%3.55%0.03%100%(Est.) FY 2021 6,989,689,553 247,473,690 90,772,675 185,180,225 1,220,000 7,514,336,143%93.02%3.29%1.21%2.46%0.02%100%(Est.) FY 02%1.41%3.65%0.03%100%Prepared by the House Republican Fiscal Policy Department. For internal use only.
6Total State K-12 Education FundingAlthough tuition support is by far the largest category of state K-12 funding, the state also investssignificant General Fund dollars in several other K-12-related programs, including the IndianaDepartment of Education, State Board of Education, and payments to teacher pension funds. For the2019-2020 school year (FY 2020), the state appropriated 1.25B for these other K-12 programs. Whenall of the various K-12 education related programs are included, total state K-12 education spendingwill amount to roughly 8.58B in FY 2020 (see table below).Total K-12 education state funding has increased by 1.5B over the last five biennial state budgets:The table below lists just a handful of the significant state investments and programs that willcomplement tuition support this current biennium (FY 2020 – FY 2021):A Sample of K-12-Related State ProgramsTeacher Pension Payments (Pre-1996 TRF)Distribution for Adult LearnersCurricular Material (Textbook) ReimbursementTeacher Appreciation GrantsNon-English Speaking ProgramCharter & Innovation School Grant ProgramSpecial EducationSecured School Safety ProgramSummer SchoolGifted and Talented Education ProgramAdvanced Placement ProgramNext Level Computer Science ProgramSTEM Program AlignmentState General Fund AppropriationFY 2020FY 2021 919,000,000 946,600,000 40,331,250 40,331,250 39,000,000 39,000,000 37,500,000 37,500,000 22,500,000 22,500,000 22,500,000 22,500,000 24,070,000 24,070,000 19,000,000 19,000,000 18,360,000 18,360,000 13,053,399 13,053,399 5,200,000 5,200,000 3,000,000 3,000,000 3,000,000 3,000,000Prepared by the House Republican Fiscal Policy Department. For internal use only.
7Local K-12 Education FundingLocal revenue accounts for roughly a quarter of all public spending on K-12 education. It is importantto note that only traditional public school corporations receive local tax revenue. On average,school corporations receive about 41% of all property taxes collected statewide. Property tax revenuesare used by schools to pay for the cost of transporting students to and from school (including thepurchase of school buses), capital expenditures (including facility upgrades, repairs, and technologyequipment), and various types of debt service (mortgages, bonds, leases, and certain pension debt). During the 2017-2018 school year (FY 2018), public schools collected 3.15B in local revenue.o Nearly 2.9B was from property taxes, 41% of total statewide collections ( 7.05B).o Roughly 271M was from other local sources, such as vehicle excise tax revenue.During the 2017-2018 school year (FY 2018), total local revenue per student averaged 3,185.Organized by fund, the three largest recipients of local tax dollars for K-12 education are 1.) DebtService (39%); 2.) Capital Projects (21%); and, 3.) Transportation (16%).Traditional public school corporations also have the ability to ask their taxpayers to pay more in propertytaxes to increase education funding through a capital project referendum, an operating levyreferendum, and, effective July 1, 2019, a school safety levy referendum. Successful referenda areexempt from the constitutional property tax caps; however, they do expire and must be reauthorized. In FY 2019, 283M (less than 10% of total local revenue) was from school corporation capitaland operating referenda adopted by local voters.Since November 2008, local schools have passed 124 referenda while 73 have failed:o Operating . 81 passed (68%) and 38 failed (32%);o Capital Project . 42 passed (55%) and 35 failed (45%); ando Other 1 passed and 0 failed.Prepared by the House Republican Fiscal Policy Department. For internal use only.
8Federal K-12 Education FundingIndiana received around 1.06B in federal K-12 education funding for the 2017-2018 school year (FY2018) with close to 438M dedicated to providing school lunches to low-income students. Nearly 236M of the federal funding came in the form of Title I grants. All traditional public schools, mostpublic charter schools, and most virtual charter schools received Title I dollars. The remaining federaldollars went to programs that support students with disabilities, migrant students, homelessnessassistance and career and technical education – along with administrative and audit expenses. Title I is the federal program that provides funding to local school districts to improve theacademic achievement of disadvantaged students.Title I funds are currently allocated through four statutory formulas that are based primarily oncensus poverty estimates and the cost of education in each state.Schools must focus Title I services on children who are failing, or most at risk of failing, to meetstate academic standards.o Schools with at least 40% at-risk enrollment may use the funds for school-wide programs.Total K-12 Education Spending (State, Local, & Federal)Indiana’s K-12 education system receives funding from three sources: state government, localgovernments, and the federal government. During the most recent school year 2017-2018 (FY 2018)with complete figures, total public spending on K-12 programs in Indiana was 12.43B. State fundingwas by far the largest source (66%), local revenues accounted for 25%, and federal funds provided theremaining 9%.Prepared by the House Republican Fiscal Policy Department. For internal use only.
9During the 2017-2018 school year (the most recent year for which we have complete data on all threeprimary revenue sources), total public support for the average traditional public school corporationstudent was 10,095. The (rounded) numbers below break down per student support by source.Statewide average K-12 state tuition support for only public school corporations (FY 2018): 6,694 / studentStatewide average local revenue for only public school corporations (FY 2018): 3,185 / studentStatewide federal Title I revenue for only public school corporations (FY 2018): 217 / studentTotal State Total Local Total Federal Title I Statewide Average: 10,095 / school corp. studentHypothetical Average Public School Corporation Classroom Funding (FY 2018): Classroom of 18 ADM: 181,712 Classroom of 20 ADM: 201,902 Classroom of 25 ADM: 252,378Dollars-to-the-ClassroomOnly 58.1% of public school expenditures made it to the classroom during the 2016-17 school year (FY2017) according to the latest ‘Dollars-to-the-Classroom Report’ released by the Indiana Office ofManagement and Budget. Out of 381 traditional and public charter schools, 233 (61%) increased theirpercentage of dollars to the classroom from the previous year. The primary driver of the increasebetween FY 2016 and FY 2017 was school personnel salaries: certified salary (teachers and principals)spending increased 117M and non-certified salaries 50M. As the table below illustrates, the dollarsto-the-classroom metric has declined since hitting a peak of 61.4% in FY 2007.Percentage of Total School Expenditures on Student Instruction (Dollars-to-the-Classroom)FY 2006 FY 2007 FY 2008 FY 2009 FY 2010 FY 2011 FY 2012 FY 2013 FY 2014 FY 2015 FY 2016 FY 7.0%57.3%58.1%Prepared by the House Republican Fiscal Policy Department. For internal use only.
10Teachers, Administrators, and Non-Teaching StaffThe more that a school corporation spends on overhead and administrative staff salaries, the lessavailable resources it can devote to direct classroom expenditures, especially teacher compensation.Indiana data from the U.S. Department of Education’s National Center for Education Statistics (NCES)shows that between the 2007-2008 and 2016-2017 school years, traditional public school enrollmentdecreased by 3% and the number of teachers decreased by 3.5%. However, the number of publicschool administrative staff increased by 31% over the same time period. A March 2019 NCES reportfound Indiana had the third lowest percentage in the nation (41.4%) of public K-12 staff serving asclassroom teachers. As the below graph indicates, during 2012 – 2014 Indiana’s precentage of K-12staff serving as classroom teachers was the lowest in the country. In 2016, Indiana’s public K-12 staffing was a national outlier in other areas:o In terms of total public K-12 staff serving in schools, Indiana was second lowest (63%).o In terms of non-school and non-district administrative staff, the share of Indiana’s ‘OtherSupport Services Staff’ was the second highest in the country (27%).Teacher SalariesSchool corporation resource allocations, such as staffing and teacher salaries, inevitably vary districtby-district given unique needs and local decision making. While teacher salaries are determined bylocal school boards, the state does contribute directly to teacher pay through Teacher AppreciationGrants (TAG). For the 2018-2019 school year, DOE recommended that schools provide ‘HighlyEffective’ and ‘Effective’ teachers 320 and 220, respectively, from the 30M provided by the state forthe TAG program. TAG grants provide extra income to teachers by supplementing the base salaryincreases and/or one-time stipends provided by local schools. The TAG program was increased to 37.5M per year in the current biennial budget.Prepared by the House Republican Fiscal Policy Department. For internal use only.
11According to the NEA, the average Indiana public school teacher salary was 50,614 (2017-2018).After adjusting for cost-of-living differences between states, the average Indiana public school teachersalary is effectively 56,175 and ranks 22nd nationally among states (see chart below):A second, Indiana-specific teacher compensation report is produced annually by the Indiana EducationEmployment Relations Board (EERB). EERB’s 2018-2019 school year report found nearly all publicschool teachers received a pay raise, a bonus, or both: Highlights from the latest EERB report:o The average Indiana public school teacher salary was 52,737, which is higher thanthe amount reported by the NEA; it is also than EERB’s 2017-2018 figure ( 50,425).o 82% of certified positions received a base salary increase—the average was 1,299.o 62% of certified positions received a one-time stipend—the average was 897.Prepared by the House Republican Fiscal Policy Department. For internal use only.
12Choice Scholarships (Vouchers)The appropriation for the tuition support formula includes funding for Choice Scholarships. ChoiceScholarships are need-based vouchers that empower eligible lower-income families to send theirchildren to participating ‘Choice Schools.’ Choice Scholarship awards are capped at a certainpercentage of the per student state tuition support that is paid to the family’s school corporation of legalsettlement.There are now three voucher cap amounts based on family income: @ 90% of the per ADM state tuition support amount of the recipient’s school corporation,excluding special education grants and career and technical education grants, for householdsthat are 100% or less of free or reduced lunch (FRL) eligibility ( 47,638 for a family of four); @ 70% for households that are 100% to 125% FRL ( 59,547 for a family of four); and @ 50% for households that are 125% to 150% FRL ( 71,456 for a family of four).o @ 50% cap up to 200% FRL if the family is under the Continuing Choice ScholarshipStudent Track or Special Education Track.For the 2018-2019 school year, the average Choice award was 4,422 per student, whereas theaverage per student tuition support for school corporations was 6,795. Furthermore, Choicescholarships (and Public Charter Schools) do not draw on any property taxes or local revenue sources.The average local revenue per student for school corporations was 3,185 during the 2017-2018 schoolyear (the latest year for complete figures).Because Choice Scholarship amounts are capped, the program results in a net savings to the entireschool funding formula. According to the Indiana Department of Education’s (DOE) latest ‘ChoiceScholarship Program Annual Report’ (2019): During the 2018-2019 school year, 36,290 students received Choice Scholarships at atotal cost of 160M, or 2% of the entire tuition support appropriation ( 7.15B) for FY 2019;o For greater context, the entirety of the Choice program’s funding is less than the statetuition support received by some school corporations with lower enrollment: Indianapolis Public Schools taught 30,707 students and received 238M in statetuition support; and Fort Wayne Community Schools taught 28,537 students and received 207M instate tuition support.The IDOE’s 2017-2018 Choice Scholarship report found:o “[I]f the same 36,290 Choice students were to attend his/her public schoolcorporation of legal settlement for the 2018-2019 school year, the amountthat would be paid in public tuition support would total 231,409,852.89.” Choice Scholarships result in an aggregate savings of 70M ( 161M vs. 231M).o This significant savings remains within the tuition support formula, stretching the tuitionsupport appropriation further to benefit all public schools through higher per studentfunding amounts.As a result of the award caps and aggregate discount, the current biennium’s tuition support formulafavors traditional school corporations over Choice Scholarships (see table on page 5): In the 2019-2020 school year (FY 2020), Choice Scholarships will:o Receive an est. 2.4% of tuition support dollars but will account for 3.6% of enrollment.In the 2019-2020 school year (FY 2020), traditional public school corporations will:o Receive an est. 93.4% of tuition support but will account for only 92.3% of enrollment.Prepared by the House Republican Fiscal Policy Department. For internal use only.
The State Tuition Support Funding Formula Indiana allocates the overwhelming majority of state K-12 education funding (86%) via the state tuition support funding formula, or state tuition support. Prior to 2009, the tuition support formula was funded through a combination of state and local tax dollars.