Transcription
TECHNICAL SUPPORT DOCUMENT: INDICATORBACTERIA TOTAL MAXIMUM DAILY LOADS FOR THEGREENS BAYOU WATERSHED, HOUSTON, TEXAS(1016 01, 1016 02, 1016 03, 1016A 02, 1016A 03,1016B 01, 1016C 01, 1016D 01)Prepared for:TEXAS COMMISSION ON ENVIRONMENTAL QUALITYPrepared by:University of HoustonandPARSONSSeptember 2009
TECHNICAL SUPPORT DOCUMENT: INDICATORBACTERIA TOTAL MAXIMUM DAILY LOADS FOR THEGREENS BAYOU WATERSHED, HOUSTON, TEXAS(1016 01, 1016 02, 1016 03, 1016A 02, 1016A 03,1016B 01, 1016C 01, 1016D 01)Contract No. 582-6-70860Work Order No. 582-6-70860-23Prepared for:TEXAS COMMISSION ON ENVIRONMENTAL QUALITYTCEQ Contact:Ron Stein, TMDL TeamP.O. Box 13087, MC-203Austin, Texas 78711-3087RStein@tceq.state.tx.usPrepared by:University of HoustonandPARSONSSEPTEMBER 2009
Technical Support Document forGreens Bayou Bacteria TMDLsTable of ContentsTABLE OF CONTENTSSECTION 1 INTRODUCTION .1-11.1 Watershed Description .1-11.2Summary of Existing Data .1-41.31.2.1 Soil and Topography .1-41.2.2 Land Use.1-61.2.3 Precipitation.1-81.2.4 Ambient Water Quality .1-101.2.5 Stream Flow Data .1-13Greens Bayou Seasonality.1-13SECTION 2 PROBLEM IDENTIFICATION AND WATER QUALITY TARGET .2-12.1 Pollutant of Concern: Characteristics of Bacterial Indicators .2-12.2TCEQ Water Quality Standards for Contact Recreation.2-12.3Problem Identification .2-52.4Water Quality Targets for Contact Recreation.2-8SECTION 3 POLLUTANT SOURCE ASSESSMENT .3-13.1 Point Sources: NPDES/TPDES-Permitted Sources .3-13.1.13.1.2Permitted Sources: Continuous Point Source Discharges .3-2Permitted Sources: NPDES No-Discharge Facilities and Sanitary SewerOverflows .3-83.1.3 Permitted Sources: TPDES Regulated Storm Water.3-103.1.4 Dry Weather Discharges/Illicit Discharges .3-113.1.5 Concentrated Animal Feeding Operations .3-123.2 Non-permitted Sources: Storm Water, On-site Sewage Facilities, and DirectDeposition.3-123.2.1 Wildlife and Unmanaged Animal Contributions.3-123.2.2 Non-Permitted Agricultural Activities and Domesticated Animals .3-133.2.3 Failing On-site Sewage Facilities.3-133.2.4 Domestic Pets .3-173.2.5 Bacteria Re-growth and Die-off .3-17SECTION 4 TECHNICAL APPROACH AND METHODS .4-14.1 Using Load Duration Curves to Develop TMDLs .4-14.2Development of Flow Duration Curves .4-24.3Estimating Current Point and Nonpoint Loading and Identifying Critical Conditionsfrom Load Duration Curves.4-8J:\646636 U of H\Metro-FY 2010\Greens Bayou Draft TMDL\Greens Bayou Technical support document rev4(working).dociSeptember 2009
Technical Support Document forGreens Bayou Bacteria TMDLsTable of Contents4.4Development of Bacteria TMDLs for Freshwater Streams Using Load DurationCurves.4-94.5Estimated Loading and Critical Conditions .4-19SECTION 5 TMDL CALCULATIONS.5-15.1 Wasteload Allocation .5-15.2Load Allocation .5-65.3Allocations for Future Growth .5-65.4Margin of Safety.5-75.5Seasonal Variability.5-75.6TMDL Calculations.5-7SECTION 6 PUBLIC PARTICIPATION.6-1SECTION 7 REFERENCES .7-1APPENDICESAppendix A Ambient Water Quality Bacteria Data – 1992 to 2008Appendix B-1 Flow DataAppendix B-2 Intensive Survey DataAppendix CDischarge Monitoring Reports for Flow – 1997 to 2007Appendix D Discharge Monitoring Reports for Fecal Coliform – 1998 to 2007Appendix ESanitary Sewer Overflows Data Summary – 2001 to 2003Appendix FGeneral Methods for Estimating Flow at WQM StationsAppendix G Flow Exceedance Percentiles for TMDL WQM StationsJ:\646636 U of H\Metro-FY 2010\Greens Bayou Draft TMDL\Greens Bayou Technical support document rev4(working).dociiSeptember 2009
Technical Support Document forGreens Bayou Bacteria TMDLsTable of ContentsLIST OF FIGURESFigure 1-1Location Map for Greens Bayou Watershed .1-3Figure 1-2Greens Bayou Watershed Soil Types .1-5Figure 1-3Land Use Map .1-7Figure 1-4Precipitation Map .1-9Figure 1-5WQM and USGS Station Locations.1-12Figure 2-1TMDL Station Locations.2-10Figure 3-1TPDES-Permitted Facilities in the Greens Bayou Watershed .3-6Figure 3-2Sanitary Sewer Overflow Locations.3-9Figure 3-3Unsewered Areas and Subdivisions with OSSF.3-16Figure 4-1Flow Duration Curve for Greens Bayou above Tidal (1016 01, 1016 02).4-4Figure 4-2Flow Duration Curve for Greens Bayou above Tidal (1016 03).4-5Figure 4-3Flow Duration Curve for Garners Bayou (1016A 02, 1016A 03).4-6Figure 4-4Flow Duration Curve for Unnamed Tributary of Greens Bayou (1016B 01) .4-7Figure 4-5Flow Duration Curve for Unnamed Tributary of Greens Bayou (1016C 01) .4-7Figure 4-6Flow Duration Curve for Unnamed Tributary of Greens Bayou (1016D 01).4-8Figure 4-7LDC Schematic Diagram – Interpreting Sources and Loads .4-10Figure 4-8Load Duration Curve for Greens Bayou above Tidal (1016 01, 1016 02).4-13Figure 4-9Load Duration Curve for Greens Bayou above Tidal (1016 03).4-14Figure 4-10 Load Duration Curve for Garners Bayou (1016A 02, 1016A 03).4-15Figure 4-11 Load Duration Curve for Unnamed Tributary of Greens Bayou (1016B 01) .4-16Figure 4-12 Load Duration Curve for Unnamed Tributary of Greens Bayou (1016C 01) .4-17Figure 4-13 Load Duration Curve for Unnamed Tributary of Greens Bayou (1016D 01).4-18Figure 5-1Allocation Loads for AU 1016 01 as a Function of WQ Criteria .5-14Figure 5-2Allocation Loads for AU 1016 02 as a Function of WQ Criteria .5-15Figure 5-3Allocation Loads for AU 1016 03 as a Function of WQ Criteria .5-16Figure 5-4Allocation Loads for AU 1016A 02 as a Function of WQ Criteria.5-17Figure 5-5Allocation Loads for AU 1016A 03 as a Function of WQ Criteria.5-18Figure 5-6Allocation Loads for AU 1016B 01 as a Function of WQ Criteria.5-19Figure 5-7Allocation Loads for AU 1016C 01 as a Function of WQ Criteria.5-20Figure 5-8Allocation Loads for AU 1016D 01 as a Function of WQ Criteria.5-21J:\646636 U of H\Metro-FY 2010\Greens Bayou Draft TMDL\Greens Bayou Technical support document rev4(working).dociiiSeptember 2009
Technical Support Document forGreens Bayou Bacteria TMDLsTable of ContentsLIST OF TABLESTable 1-1City Population and Density.1-2Table 1-2Characteristics of Soil Types within Greens Bayou Watershed.1-4Table 1-3Aggregated Land Use Summaries by Segment .1-6Table 1-4Annual Totals at Rainfall Gauges in Greens Bayou Watershed (in inches).1-8Table 1-5Annual Average Precipitation in Greens Bayou Subwatersheds, 1988-2007(in inches) .1-10Table 1-6Historical Water Quality Data for TCEQ Stations from February 1992 to March2008 .1-11Table 1-7USGS Gages in the Greens Bayou Watershed .1-13Table 1-8Average Monthly Temperatures for Houston Hobby AP, TX (1971-2000) .1-14Table 1-9Seasonal Differences for Fecal Coliform Concentrations .1-14Table 1-10 Seasonal Differences for E. coli Concentrations .1-15Table 2-1Synopsis of Texas Integrated Report for Waterbodies in the Greens BayouWatershed.2-2Table 2-2Water Quality Monitoring Stations Used for 303(d) Listing Decision .2-6Table 2-3Water Quality Data for TCEQ WQM Stations from 1999 to 2006.2-7Table 3-1TPDES-Permitted Facilities in the Study Area .3-3Table 3-2DMR Data for Permitted Wastewater Discharges (December 1998-September2007).3-7Table 3-3Sanitary Sewer Overflow Summary.3-8Table 3-4Percentage of Permitted Storm Water in Each Watershed.3-11Table 3-5Numbers of OSSF Permits Issued by Authorized County or City Agent .3-14Table 3-6Estimated Number of OSSFs per Watershed and Fecal Coliform Load .3-15Table 3-7Estimated Numbers of Pets .3-17Table 3-8Estimated Fecal Coliform Daily Production by Pets (x 109).3-17Table 4-1Hydrologic Classification Scheme .4-3Table 4-2TMDL Percent Reductions Required to Meet Contact Recreation Standards in theGreens Bayou Watershed .4-20Table 5-1Wasteload Allocations for TPDES-Permitted Facilities .5-2Table 5-2Population Projection per Subwatershed.5-7Table 5-3E. coli TMDL Calculations for Greens Bayou above Tidal (1016 01 and1016 02).5-8Table 5-4E. coli TMDL Calculations for Greens Bayou above Tidal (1016 03) .5-8Table 5-5E. coli TMDL Calculations for Garners Bayou (1016A 02 and 1016A 03) .5-9J:\646636 U of H\Metro-FY 2010\Greens Bayou Draft TMDL\Greens Bayou Technical support document rev4(working).docivSeptember 2009
Technical Support Document forGreens Bayou Bacteria TMDLsTable of ContentsTable 5-6E. coli TMDL Calculations for Unnamed Tributary of Greens Bayou(1016B 01).5-9Table 5-7E. coli TMDL Calculations for Unnamed Tributary of Greens Bayou(1016C 01).5-10Table 5-8E. coli TMDL Calculations for Unnamed Tributary of Greens Bayou(1016D 01) .5-10Table 5-9Ratios for Proportioning of Greens Bayou at 11371 and Garners Bayou at 11125by Assessment Unit .5-11Table 5-10 E. coli TMDL Summary Calculations for Greens Bayou Segments.5-12Table 5-11 Final TMDL Allocations .5-13J:\646636 U of H\Metro-FY 2010\Greens Bayou Draft TMDL\Greens Bayou Technical support document rev4(working).docvSeptember 2009
Technical Support Document forGreens Bayou Bacteria TMDLsAcronyms and AbbreviationsACRONYMS AND ABBREVIATIONS FASAEC-CAPCAFOCFRcfsdegrees FahrenheitAmerican Society of Agricultural EngineersCoastal Change Analysis Programconcentrated animal feeding operationCode of Federal RegulationsCubic feet per secondcfucolony-forming unitCNcurve numberdLDMRE. coliFDCGISdeciliterdischarge monitoring reportEscherichia coliflow duration curvegeographic information systemHCFCDHarris County Flood Control DistrictHCOEMHarris County Office of Homeland Security and Emergency ManagementH-GACLALDCmLHouston-Galveston Area Councilload allocationsload duration curvemilliliterMOSmargin of safetyMPNmost probable numberMS4NOAANPDESmunicipal separate storm sewer dischargeNational Oceanic and Atmospheric AdministrationNational Pollution Discharge Elimination SystemNRCSNational Resources Conservation ServiceOSSFonsite sewage facilitySSOSTATSGOSWQSTACsanitary sewer overflowState Soil Geographic Databasesurface water quality standardsTexas Administrative CodeTCEQTexas Commission on Environmental QualityTMDLTotal Maximum Daily LoadsTPDESTexas Pollution Discharge Elimination SystemTSARPTropical Storm Allison Recovery ProjectUSACEU.S. Army Corps of EngineersUSDAUSEPAUSGSWLAU.S. Department of AgricultureU.S. Environmental Protection AgencyU.S. Geological Surveywasteload allocationWQMwater quality monitoringWWFwet weather facilityWWTFwastewater treatment facilityJ:\646636 U of H\Metro-FY 2010\Greens Bayou Draft TMDL\Greens Bayou Technical support document rev4(working).docviSeptember 2009
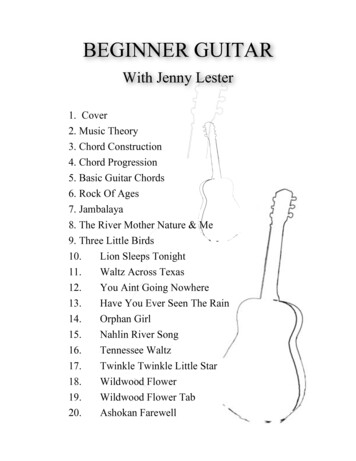
Technical Support Document forGreens Bayou Bacteria TMDLsIntroductionSECTION 1INTRODUCTIONTwenty-seven segments in the general Houston Metropolitan Area are considered impairedwater bodies for contact recreation because they do not meet indicator bacteria (Escherichiacoli [E. coli]) water quality standards. These segments are in a number of watersheds in theSan Jacinto River basin, including Greens Bayou Watershed, Halls Bayou Watershed, HuntingBayou Watershed, Brays Bayou Watershed, Sims Bayou Watershed, and the general HoustonShip Channel Watershed.For the purpose of total maximum daily load (TMDL) development, the project has beensubdivided into five subprojects: Greens Bayou Watershed, Halls Bayou Watershed, BraysBayou Watershed, Sims Bayou Watershed, and Eastern Houston Watersheds. The EasternHouston Watersheds project includes all the bacteria-impaired segments in the Houston ShipChannel and Houston Ship Channel/Buffalo Bayou watersheds. All these segments arefreshwater streams with contact recreation use that drain into the tidally influenced HoustonShip Channel and Houston Ship Channel/Buffalo Bayou segments with non-contact recreationuse. This TMDL report will address the Greens Bayou Watershed.1.1 Watershed DescriptionGreens Bayou is located in north central Harris County, about 10 miles north of the centralbusiness district of the City of Houston. The Greens Bayou non-tidal watershed drains an areaof about 140 square miles and encompasses the cities of Houston and Humble. The non-tidalportion of the bayou flows across northern Harris County generally eastward from itsheadwaters near Farm-to-Market 1960 for about 23 miles, and then turns at its confluence withGarners Bayou and flows southward for about 7 miles to the confluence with Halls Bayou. TheHarris County Flood Control District (HCFCD) has made channel improvements upstream ofU.S. Highway 90 (U.S. Army Corps of Engineers [USACE], 2005).Most of the watershed is highly developed, but some large areas between U.S. Highway 59and I-10 remain undeveloped (HCFCD, 2008). There are about 200 miles of open streamswithin the watershed.Subwatershed ListThis report focuses on the following waterbodies that TCEQ placed in Category 5 [303(d)list] of the 2008 Integrated Report for nonsupport of contact recreation use: Greens Bayou above Tidal, Segment 1016 (Assessment Units 1016 01, 1016 02,and 1016 03)Garners Bayou, Segment 1016A (Assessment Units 1016A 02 and 1016A 03)Unnamed Tributary of Greens Bayou, Segment 1016B (Assessment Unit 1016B 01)Unnamed Tributary of Greens Bayou, Segment 1016C (Assessment Unit 1016C 01)Unnamed Tributary of Greens Bayou, Segment 1016D (Assessment Unit 1016D 01)Figure 1-1 is a location map showing these Texas waterbodies and their contributingwatersheds. The delineation of each subwatershed is derived from 2005 geographicJ:\646636 U of H\Metro-FY 2010\Greens Bayou Draft TMDL\Greens Bayou Technical support document rev4(working).doc1-1September 2009
Technical Support Document forGreens Bayou Bacteria TMDLsIntroductioninformation system (GIS) data files created for the Tropical Storm Allison Recovery Project(TSARP) provided by Harris County Flood Control District (HCFCD). Using the TSARP GISfile results in watershed delineations that are slightly different than the historic delineationsbased on Texas Commission on Environmental Quality (TCEQ) GIS files associated withclassified segments (Segment 1016. These waterbodies and their surrounding watersheds arehereinafter referred to as the Study Area.The climate of the region is subtropical humid, with very hot and humid summers and mildwinters (USACE 1985). The average daytime temperature in the summer is 34 degrees Celsius(93 degrees Fahrenheit), while the temperature averages between 4 and 16 degrees Celsius (39to 61 degrees Fahrenheit) during the winter. Summer rainfall is dominated by subtropicalconvection, winter rainfall by frontal storms, and fall and spring months by combinations ofthese two (Burian and Shepherd 2005). The 100-year floodplain encompasses about 22 percentof the drainage area of the watershed, approximately 31 square miles (HCFCD, 2008).Table 1-1, derived from the 2000 U.S. census, summarizes the population for the cities onwhich the watershed lies (U.S. Census Bureau 2000). For comparison purposes, the 2010estimated population from the Texas Water Development Board was included to show thepopulation growth per city.Table 1-1City Population and DensityCity Name2000 U.S.Census2000 PopulationDensity (persquare mile)Texas nDensity (persquare 791,47716,8621,708aTexas Water Development Board, 2005J:\646636 U of H\Metro-FY 2010\Greens Bayou Draft TMDL\Greens Bayou Technical support document rev4(working).doc1-2September 2009
Technical Support Document forGreens Bayou Bacteria TMDLsIntroductionFigure 1-1J:\646636 U of H\Metro-FY 2010\Greens Bayou Draft TMDL\Greens Bayou Technical support document rev4(working).docLocation Map for Greens Bayou Watershed1-3September 2009
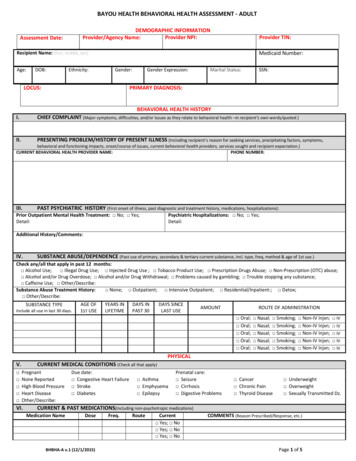
Technical Support Document forGreens Bayou Bacteria TMDLsIntroduction1.2 Summary of Existing DataThe following subsections summarize existing data relevant to soil, land use, andprecipitation throughout the watershed as well as the available ambient water quality andstream flow data for the Study Area.1.2.1Soil and TopographyThe State Soil Geographic Database (STATSGO) (National Resources ConservationService [NRCS] 1994) information was used to characterize soil in the Greens BayouWatershed. As can be observed in Figure 1-2, the soil types that dominate the watershed areprimarily from the Clodine, Aldine, and Wockley soil series. Table 1-2 lists the distributionand attributes of the three soil series found in the Study Area.Table 1-2Characteristics of Soil Types within Greens Bayou WatershedNRCSSoilTypeSoilSeriesNamePercent lodine64.3%LoamDTX007Aldine16.8%Fine SandyLoamDTX618Wockley13.3%Fine SandyLoamCTX248Katy2.6%Fine SandyLoamDTX068Boy1.2%LoamyFine SandBTX048Bernard0.9%Clay .090.121.50.140.191.330.120.171.33Source: All data obtained/calculated from STATSGO databaseThe topography of the area is characteristic of the Texas Gulf Coastal Plains – flat andgrassy. The streambed has an average slope of about 0.07 percent (3.7 feet per mile).Elevations in the watershed vary from about 123 feet near the headwaters to about 8 feet at themouth of Greens Bayou (USACE 2005).J:\646636 U of H\Metro-FY 2010\Greens Bayou Draft TMDL\Greens Bayou Technical support document rev4(working).doc1-4September 2009
Technical Support Document forGreens Bayou Bacteria TMDLsIntroductionFigure 1-2J:\646636 U of H\Metro-FY 2010\Greens Bayou Draft TMDL\Greens Bayou Technical support document rev4(working).docGreens Bayou Watershed Soil Types1-5September 2009
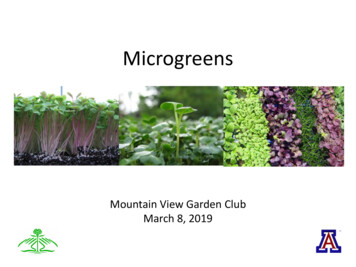
Technical Support Document forGreens Bayou Bacteria TMDLs1.2.2IntroductionLand UseMost of the Greens Bayou Watershed is highly developed, but some large areas betweenU.S. Highway 59 and I-10 remain undeveloped. Table 1-3 summarizes the acreages and thecorresponding percentages of the land use categories for the contributing watershed associatedwith each respective segment in the Study Area. The land use/land cover data were derivedfrom the National Oceanic and Atmospheric Administration’s (NOAA) Coastal ServicesCenter. The specific land use/land cover data files were derived from the Coastal ChangeAnalysis Program (C-CAP), Texas 2005 Land Cover Data (NOAA 2007). The land usecategories are displayed in Figure 1-3. The total acreage of each segment in Table 1-3corresponds to the watershed delineation in Figure 1-3. As mentioned before, the predominantland use category in this watershed is developed land (between 44% and 76%) followed bywoody land (between 16% and 31%). Open water and bare/transitional land account for lessthan 2 percent of the subwatersheds.Table 1-3Aggregated Land Use Summaries by SegmentAggregated LanduseCategoryPercent DevelopedPercent CultivatedLandPercent Pasture/HayPercentGrassland/HerbaceousPercent Woody LandPercent Open WaterPercent WetlandPercentBare/TransitionalAcres of DevelopedAcres Cultivated LandAcres Pasture/HayAcresGrassland/HerbaceousAcres of Woody LandAcres of Open WaterAcres of WetlandAcres ofBare/TransitionalWatershed Area(acres)abSegment/Assessment Unit ID1016a1016Ab1016B 011016C 011016D 4,0433,556Assessment Units 1016 01, 1016 02 and 1016 03Assessment 1016A 02 and 1016A 03J:\646636 U of H\Metro-FY 2010\Greens Bayou Draft TMDL\Greens Bayou Technical support document rev4(working).doc1-6September 2009
Technical Support Document forGreens Bayou Bacteria TMDLsIntroductionFigure 1-3J:\646636 U of H\Metro-FY 2010\Greens Bayou Draft TMDL\Greens Bayou Technical support document rev4(working).docLand Use Map1-7September 2009
Technical Support Document forGreens Bayou Bacteria TMDLs1.2.3IntroductionPrecipitationThere are 10 rain gauges located within the watershed (Figure 1-4). The gauges aremaintained by the Harris County Office of Homeland Security and Emergency Management(HCOEM). Table 1-4 summarizes total annual rainfall for the 10 gauges for a 20-year period.The Study Area has high levels of humidity and receives annual precipitation ranging between21 and 79 inches per year (Table 1-4). Based on data for the period 1988 to 2007, thewatershed average is around 48.8 inches per year. Figure 1-4 shows average annual rainfallacross the Study Area. This grid was obtained by kriging data from 148 HCOEM rain gaugeslocated across Harris, Fort Bend, and Galveston Counties. Average values by subwatershed aresummarized in Table 1-5. These average values were used to support the development of flowduration curves (Section 4).Table 0Annual Totals at Rainfall Gauges in Greens Bayou Watershed(in 863.670.859.570.351.070.852.359.760.158.3Average annual rainfall over period of 1988 to 2007 is 48.8 inches.J:\646636 U of H\Metro-FY 2010\Greens Bayou Draft TMDL\Greens Bayou Technical support document rev4(working).doc1-8September 2009
Technical Support Document forGreens Bayou Bacteria TMDLsIntroductionFigure 1-4J:\646636 U of H\Metro-FY 2010\Greens Bayou Draft TMDL\Greens Bayou Technical support document rev4(working).docPrecipitation Map1-9September 2009
Technical Support Document forGreens Bayou Bacteria TMDLsTable 1-5IntroductionAnnual Average Precipitation in Greens Bayou Subwatersheds, 1988-2007(in inches)Segment/ Assessment Unit1016 01, 1016 02, 1016 031016A 02, 1016A 31016B 011016C 011016D bient Water QualityConsiderable amounts of ambient water quality data are available to support water qualityassessment and development of TMDLs for segments in the Greens Bayou Watershed.Historical indicator bacteria data for the period 1992 to 2008 were obtained from the TCEQSWQMIS database, which includes results from the sampling events conducted under thisproject in 2006.Fifty-six percent of the data correspond to E. coli concentrations(821 samples), while the remaining 44 percent correspond to fecal coliform concentrations(637 samples).Table 1-6 summarizes the historical ambient water quality data for indicator bacteria(1992-2008) for select TCEQ Water Quality Monitoring (WQM) stations in the Greens BayouWatershed. Data in Table 1-6 collected prior to 2001 correspond to fecal coliformconcentrations, while data for 2001-2008 are primarily E. coli concentrations. Figure 1-5shows the locations of the WQM locations with indicator bacteria data. The complete ambientwater quality dataset for bacteria used to prepare Table 1-6 is provided in Appendix A.Table 1-6 presents the number of indicator bacteria samples, as well as the geometric mean ofthe concentrations for each indicator, and the number and percentage of single sampleexceedances of the Texas SWQS. A more in-depth discussion of the analysis of this dataset isprovided in Subsections 2.3 and 2.4.J:\646636 U of H\Metro-FY 2010\Greens Bayou Draft TMDL\Greens Bayou Technical support document rev4(working).doc1-10September 2009
Technical Support Document forGreens Bayou Bacteria TMDLsTable 1-6AssessmentUnitWQMStationID113691016
Technical Support Document for Greens Bayou Bacteria TMDLs Table of Contents J:\646636 U of H\Metro-FY 2010\Greens_Bayou_Draft_TMDL\Greens Bayou Technical support document rev4(working).doc ii September 2009 4.4 Development of Bacteria TMDLs for Freshwater Streams Using Load Duration