Transcription
The Journal of Molecular Diagnostics, Vol. 19, No. 1, January 2017jmd.amjpathol.orgClinical Validation of a Next-GenerationSequencing Genomic Oncology Panel viaCross-Platform Benchmarking against EstablishedAmplicon Sequencing AssaysSabah Kadri,* Bradley C. Long,* Ibro Mujacic,* Chao J. Zhen,* Michelle N. Wurst,* Shruti Sharma,* Nadia McDonald,*Nifang Niu,* Sonia Benhamed,* Jigyasa H. Tuteja,y Tanguy Y. Seiwert,z Kevin P. White,y Megan E. McNerney,*Carrie Fitzpatrick,* Y. Lynn Wang,* Larissa V. Furtado,* and Jeremy P. Segal*From the Division of Genomic and Molecular Pathology,* Department of Pathology, the Institute for Genomics and Systems Biology,y and the Department ofMedicine,z The University of Chicago, Chicago, IllinoisAccepted for publicationJuly 19, 2016.Address correspondence toJeremy P. Segal, M.D., Ph.D.,Division of Genomic and Molecular Pathology, Departmentof Pathology, University ofChicago, 5841 S MarylandAve, MC 1089, Room N-339,Chicago, IL 60637. E-mail:jsegal5@bsd.uchicago.edu.Next-generation sequencing (NGS) genomic oncology profiling assays have emerged as key drivers ofpersonalized cancer care and translational research. However, validation of these assays to meet strictclinical standards has been historically problematic because of both significant assay complexity and ascarcity of optimal validation samples. Herein, we present the clinical validation of 76 genes from anovel 1212-gene large-scale hybrid capture cancer sequencing assay (University of Chicago MedicineOncoPlus) using full-data comparisons against multiple clinical NGS amplicon-based assays to yielddramatic increases in per-sample data comparison efficiency compared with previously published validations. Using a sample set of 104 normal, solid tumor, and hematopoietic malignancy specimens,head-to-head NGS data analyses allowed for 6.8 million individual clinical base call comparisons,including 2729 previously confirmed variants, with 100% sensitivity and specificity. University ofChicago Medicine OncoPlus showed excellent performance for detection of single-nucleotide variants,insertions/deletions up to 52 bp, and FLT3 internal tandem duplications of up to 102 bp or larger.Highly concordant copy number variant and ALK/RET/ROS1 gene fusion detection were also observed. Inaddition to underlining the efficiency of NGS validation via full-data benchmarking against existingclinical NGS assays, this study also highlights the degree of performance similarity between hybridcapture and amplicon assays that is attainable with the application of strict quality control parametersand optimized computational analytics. (J Mol Diagn 2017, 19: 43e56; t-generation sequencing (NGS) has allowed for a dramatic expansion of diagnostic laboratory capabilities forsurveillance of genomic alterations in cancer. Many clinicallaboratories are now using NGS platforms for personalizedoncology decision support or are in the process of developinglaboratory-developed protocols (LDPs) of various types andscales to meet patient and oncologist demand.1e7 However,the development of such assays represents a significantchallenge, and demonstrating a level of performance sufficient to satisfy Clinical Laboratory Improvement Amendment (CLIA) requirements pertaining to the establishment ofnoneFood and Drug Administrationecleared LDPs can be asubstantial hurdle.The technical barriers to development of clinicaloncology NGS assays are well documented, includingspecimen-related challenges (eg, small specimens, sampleSupported by the Department of Pathology at the University of Chicago.S.K. and B.C.L. contributed equally to this work.Disclosures: None declared.Portions of this work were presented at the Association for MolecularPathology Annual Meeting, November 5 to 7, 2015, Austin, TX.Copyright ª 2017 American Society for Investigative Pathology and the Association for Molecular Pathology. Published by Elsevier Inc. All rights 7.012
Kadri et aldegradation, formalin fixation, and variable tumor cellpurity) and factors related to the complexity of cancergenetics (eg, complex mutation types, rearrangements,copy number alterations, and subclonality).5,8,9 Morepractical challenges related to the nature of desired validation strategies are less addressed. Ideally, LDP assayvalidations use samples previously analyzed in a CLIAlaboratory via a validated assay targeting the same set ofgenomic features as the prospective assay. This provideshigh-confidence results using matched clinical specimens.However, this has not been a feasible option for most earlyadopter NGS laboratories conducting NGS LDP validations because of a shortage of available comparator laboratories able to share large numbers of NGS-tested samplesalong with complete lists of variant (and nonvariant) callsand mutant allele frequencies.These shortcomings have led laboratories to pursue NGSoncology assay validations using alternative, less optimalsample sets. Common approaches include the use ofoncology patient samples previously tested in CLIA laboratories via smaller, highly targeted assays (eg, Sangersequencing and SNaPshot)2e7 or the use of wellcharacterized cell lines previously sequenced at one ormany research institutions.1,2 The first option controls forsample type and allows for true clinical comparisons, butsuffers from a lack of breadth, impeding comprehensivesensitivity and specificity analyses. The use of cell lines, onthe other hand, allows for intercomparisons across broadgenomic territory, but often lacks a true clinical laboratorygold standard, with data sets occasionally contaminated bysample-specific pseudogene signals and sequencing artifacts.Cell lines are also different sample types from those used inclinical service, and require alternative specimen handlingprotocols. Beyond the potential for discrepant priorsequencing results, cell lines may show genetic drift overserial passages,10,11 leading to additional complications,including alterations of mutational burden and mutant allelicfrequency (MAF). Thus, unlike a specific DNA sample testedin two laboratories, validation based on sequencing of publicly available cell lines involves additional caveats with thepotential to inflate the observed false-positive and falsenegative rates of the prospective LDP. Although somecombination of the above methods may be used, given thetroublesome and highly variable nature of clinical cancersamples [particularly formalin fixed, paraffin embedded(FFPE)], broad genomic assay intercomparisons of individual patient tumor samples would still be the most desirableapproach from the standpoint of both cost and confidence.One of the founding goals of our laboratory was togenerate a large-scale genomic oncology panel suitable tohelp meet both the clinical and translational research needsof our institution. To accomplish this, we first validatedseparate smaller amplicon-based NGS panels for solidtumors and heme malignancies, accumulating a collectionof patient samples tested via these assays during 1 to 2years of clinical service. Subsequently, we have used aselect group of these patient samples to validate a 76-geneclinical assay, University of Chicago Medicine (UCM)OncoPlus (UCM-OncoPlus), which represents a preliminaryand expandable reportable subset of a larger comprehensivehybrid capture sequencing panel targeting 1212 cancerassociated genes.In contrast to other published large-scale NGS validations,1,2,5 the basis of this study is intensive comparisonagainst multiple validated clinical NGS oncology assaysusing a variety of patient samples. UCM-OncoPlus wascompared against a total of four NGS oncology platformsusing three separate methods. Three comparator assays wereinternally validated in our laboratory (Materials andMethods), whereas the fourth assay is from an outsidereference laboratory (Foundation One, Foundation Medicine).1 Unlike samples tested via targeted assays or referencelaboratory NGS assays (where only limited data points arereturned), cross-validation of patient samples against full datasets from existing clinical NGS assays provides orders ofmagnitude more information per sample, allowing interrogation of the new assay across many thousands of base positions per sample. This enables extensive specificity andsensitivity analysis across large genomic regions, and also anintercomparison of detected MAFs for all variants. Othercomparison strategies are much more limited. For example,comparison of an NGS LDP against a fragment length assay(eg, for EGFR exon 19) may yield only one comparable datapoint for each sample. Likewise, although commercial laboratory NGS assays may examine large areas of genomicterritory, their results are always stripped of benign findings,including common inherited single-nucleotide and insertion/deletion polymorphisms and inherited copy number alterations. Variants of uncertain significance may be reported;however, the calling criteria for these anomalies are laboratory dependent, and thus the results are not helpful forspecificity analysis. As a result, similar to targeted traditionalPCR assays, these cross-comparisons may provide no morethan a few comparable data points per sample for comparison, which is suboptimal for ascertainment of extensivesensitivity and specificity.To our knowledge, this is the first reported oncologypanel validation incorporating this efficient and advantageous strategy. Although other groups have raised questionsabout the potential level of concordance between variantcalls from orthogonal amplicon and capture-basedsequencing assay types,12 our results highlight the performance similarity that is attainable between these methodswith the application of optimized quality control parametersand informatics systems.44jmd.amjpathol.orgMaterials and MethodsSample DNA PreparationDNA was prepared from FFPE tissue slides or from blood/bone marrow (Supplemental Table S1) using the QIAamp-The Journal of Molecular Diagnostics
UCM-OncoPlus Clinical ValidationDNA FFPE Tissue Kit or the QIAamp DNA Blood Mini Kit(Qiagen, Valencia, CA), respectively, per the manufacturer’s instructions. After isolation, DNA was quantitatedusing a Qubit fluorometer and quantitation reagents (LifeTechnologies, Carlsbad, CA). DNA from FFPE specimenswas also assessed for fragment size and amplifiable concentration using the KAPA hgDNA Quantification and QCKit (Kapa Biosystems, Wilmington, MA).CLIA-Validated Panels Used for Comparison AnalysisThree separate amplicon-based NGS oncology LDPs validated for patient care at the UCM Clinical GenomicsLaboratory were used as comparators for the UCMOncoPlus assay.The first, OncoScreen ST1.0, is a 45-gene hot-spot NGStest for somatic mutations in solid tumors using the TruseqAmplicon Cancer Panel13,14 kit (Illumina, San Diego, CA);per the manufacturer’s instructions and clinically, it is runwith two replicate library preparations with 250 ng FFPEDNA input per replicate (as assessed by Qubit), using themanufacturer’s laboratory protocol. It contains ampliconsfor hot-spot locations of the following genes: ABL1, AKT1,ALK, APC, ATM, BRAF, CDH1, CSF1R, CTNNB1, EGFR,ERBB2, ERBB4, FBXW7, FGFR1, FGFR2, FGFR3, FLT3,GNA11, GNAQ, GNAS, HNF1A, HRAS, IDH1, JAK2,JAK3, KDR, KIT, KRAS, MET, MLH1, MPL, NOTCH1,NPM1, NRAS, PDGFRA, PIK3CA, PTEN, PTPN11, RB1,RET, SMAD4, SMARCB1, STK11, TP53, and VHL.OncoScreen ST2.0 is also a 50-gene hot-spot solid tumorpanel, which uses the Ion Ampliseq Cancer Hotspot PanelV2 primer set4 (Thermo Fisher Scientific, Waltham, MA)for amplification of 207 hot-spot targeted amplicons across50 genes, including all genes in the ST1.0 assay plus fiveadditional genes. The clinical assay can be run in singlet orreplicate mode, with an assay input of only 5 ng FFPE DNAper genomic DNA real-time quantitative PCR assessment(Kapa Biosystems). In addition to the genes of OncoScreenST2.0, it includes the following genes: ABL1, AKT1, ALK,APC, ATM, BRAF, CDH1, CDKN2A, CSF1R, CTNNB1,EGFR, ERBB2, ERBB4, EZH2, FBXW7, FGFR1, FGFR2,FGFR3, FLT3, GNA11, GNAQ, GNAS, HNF1A, HRAS,IDH1, IDH2, JAK2, JAK3, KDR, KIT, KRAS, MET, MLH1,MPL, NOTCH1, NPM1, NRAS, PDGFRA, PIK3CA, PTEN,PTPN11, RB1, RET, SMAD4, SMARCB1, SMO, SRC,STK11, TP53, and VHL.OncoHeme is a 53-gene hematological malignancy panel,with custom-designed primers for amplification of 1346amplicons from blood/bone marrow DNA in three poolstargeting full or near-full coding territory. The genes in thepanel are as follows: ABL1, ASXL1, ATRX, BCOR,BCORL1, BRAF, CALR, CBL, CBLB, CBLC, CDKN2A,CSF3R, CUX1, DNMT3A, ETV6, EZH2, FBXW7, FLT3,GATA1, GATA2, GNAS, HRAS, IDH1, IDH2, IKZF1, JAK2,JAK3, KDM6A, KIT, KRAS, MLL, MPL, MYD88, NOTCH1,NPM1, NRAS, PDGFRA, PHF6, PTEN, PTPN11, RAD21,The Journal of Molecular Diagnostics-jmd.amjpathol.orgRUNX1, SETBP1, SF3B1, SMC1A, SMC3, SRSF2, STAG2,TET2, TP53, U2AF1, WT1, and ZRSR2.For the ST2.0 and OncoHeme assays, multiplex PCR wasperformed using the Ion Ampliseq Library Kit 2.0 (ThermoFisher Scientific). PCR products were analyzed for amplicon size using a TapeStation system (Agilent Technologies,Santa Clara, CA) and for yield using a Qubit fluorometerand quantitation reagents (Life Technologies). The amplicon products for these assays were subjected to librarypreparation with patient-indexed adapters using the KAPAHTP Library Preparation Kit (Kapa Biosystems). Finallibraries were quantitated using the KAPA Library Quantification Kit (Kapa Biosystems). Sequencing was performedon MiSeq instruments with version 2 reagents (Illumina),using 2 152 bp sequencing (OncoScreen ST1.0 andST2.0) or 2 255 bp sequencing (OncoHeme) with a single8-bp index read.Hybrid CaptureeBased UCM-OncoPlus AssayAfter quantitation, 100 ng Qubit-quantified DNA (blood orbone marrow) or Qubit/real-time quantitative PCRequantified DNA (FFPE) was sheared using the Covaris S2(Covaris, Woburn, MA) and subjected to library preparationand amplification using the KAPA HTP Library PreparationKit (Kapa Biosystems), using adapters with patient-specificindexes (Roche, Indianapolis, IN). Libraries were quantifiedusing Qubit reagents and the KAPA Library QuantificationKit (Kapa Biosystems). Pooled libraries were captured usinga custom-designed SeqCap EZ capture panel targeting 1212genes (Roche), supplemented with select xGen LockdownProbes (IDT, Coralville, IA). After subsequent PCRamplification and real-time quantitative PCR library quantification (Kapa Biosystems), pooled captured libraries weresequenced on Illumina HiSeq instruments with rapid runversion 2 reagents, using 2 101 bp sequencing with asingle 7-bp index read (Illumina). Of the 81 genes coveredby the UCM amplicon assays listed above, 76 were selected.These genes are as follows: ABL1, AKT1, ALK, APC,ASXL1, ATM, ATRX, BCOR, BCORL1, BRAF, CALR, CBL,CBLB, CDH1, CDKN2A, CSF1R, CSF3R, CTNNB1, CUX1,DNMT3A, EGFR, ERBB2, ERBB4, ETV6, EZH2, FBXW7,FGFR1, FGFR2, FGFR3, FLT3, GATA1, GATA2, GNA11,GNAQ, GNAS, HRAS, IDH1, IDH2, IKZF1, JAK2, KDM6A,KDR, KIT, KMT2A, KRAS, MET, MPL, MYD88, NOTCH1,NPM1, NRAS, PDGFRA, PHF6, PIK3CA, PTEN, PTPN11,RAD21, RB1, RET, RUNX1, SETBP1, SF3B1, SMAD4,SMARCB1, SMC1A, SMC3, SMO, SRSF2, STAG2, STK11,TET2, TP53, U2AF1, VHL, WT1, and ZRSR2.Bioinformatics Pipelines for Data AnalysisAfter sequencing, data output directories were transferred toa Health Insurance Portability and Accountability Acteprotected high-performance computing system within theUniversity of Chicago Center for Research Informatics for45
Kadri et alfurther processing. We developed custom pipelines toanalyze sequence data from all four UCM panels, using acombination of publicly available software and internallydeveloped tools. Schematics of the bioinformatics pipelinesfor the amplicon and hybrid capture assays are shown inSupplemental Figure S1.Briefly, amplicon assay data were processed using customquality filter and primer-matching scripts, after which thepipeline was split into two branches: alignment based andreference independent. In the first branch, the data werealigned to the hg19 reference human genome usingNovoalign 3.02.07 (NovoCraft, Selangor, Malaysia) usingautomatic adapter and primer trimming options. Variantcalling was then performed using a combination of Samtools 0.1.1915 mpileup and Variant Inspector version 1.0, aUCM-developed variant calling software. Variants arefiltered for quality [Phred quality score 30 ( Q30)] anddepth ( 50 for Oncoscreen and 100 for OncoHeme)with variant signal 5% retained for analysis. In the secondbranch, the filtered fastq files were analyzed for the presenceof insertion and deletion mutations 5 bp using thereference-independent Amplicon Indel Hunter.16 Variantcalls were combined and annotated to Human GenomeVariation Society nomenclature using Alamut Batch softwareversion 1.3.0 (Interactive Biosoftware, Rouen, France). Theflowchart is shown in Supplemental Figure S1A.For UCM-OncoPlus analysis, fastq files were subjected toIllumina adapter sequence trimming using Trimmomatic0.30,17 followed by alignment to the hg19 human referencegenome using BWA-MEM version 0.7.12.18 After application of a custom mapping quality filter to remove ambiguously mapped reads, assembly-based insertion and deletion(indel) realignment was performed using Abra.19 After PCRduplicates were removed using Picard tools 1.92, a combination of Samtools 0.1.19 mpileup and Variant Inspectorversion 1.0 were used to identify variants within the clinicalterritory. Variants were filtered based on depth ( 100 ),quality ( Q30), MAF ( 5%), and location in clinical exonicterritory for review. Variant calls were annotated and converted to Human Genome Variation Society nomenclatureusing Alamut Batch version 1.3.0 software. A separatemodule was designed to retain high sensitivity for FLT3 internal tandem duplication (ITD) mutations to include separate analysis of the FLT3 exon 13 to 15 region using Pindelversion 0.2.4t20 and a custom UCM algorithm (ITD Hunter).The flowchart is shown in Supplemental Figure S1B.Both assay pipelines have quality control modules tocalculate quality control statistics on raw fastq data, on-targetamplification, alignments, and depth statistics. Pipelines inour laboratory are all subjected to preliminary testing withnontumor specimens to determine sites of background signaland potential pseudogene-affected regions. These problematic regions are either excluded or, if possible, addressed via avariety of pipeline filters and custom solutions intended toprevent false-positive variant calls. This process is conductedbefore subsequent validation testing.Fusion detection was performed using UCM internallydeveloped software (UCM Fusion Detector version 1.0) thatoperates by using a combination of read pairs either alignedvia BWA MEM coordinately or trimmed to 40 bp andaligned separately to detect read pairs that map on eitherside of a fusion junction within ALK, RET, and ROS1. Thesoftware considers gene direction compatibility and summarizes results across gene combinations that are uniqueand focused within narrow windows (500 bp) within prospective distal gene partners. Signal for each potentialfusion is calculated as the maximum number of unique readswithin any window in the distal partner gene divided by thetotal number of ALK, RET, and ROS1 mapped reads.Copy number analysis involved evaluation of average exoninterval depths recorded via the Genome Analysis Tool KitDepthofCoverage module.21 A historical normalized baselinefor each interval in the panel was generated using the 24nonmalignant clinical samples. Test sample data were subjected to a normalization algorithm to control for individualgene profile run-specific variability. To detect the potentialcopy number regions, fold change and Z-scores were calculated for each interval, and thresholds were set at 200%(gain) or 66% (loss) with Z-score 3 or 2, respectively.Genes with more than half the intervals showing copy numberchanges in the same direction were then identified.46jmd.amjpathol.orgFLT3 ITD Mutation DetectionThe UCM-OncoPlus data analysis pipeline has a separatemodule for FLT3 ITD detection. All insertions from thealignment-based branch of the pipeline, which involvesBWA-MEM, Abra, Samtools, and Variant Inspector, arefirst extracted for the FLT3 region chromosome13:28607774:28608774. Second, Pindel20 is run for the sameregion on the Abra indel-realigned file, and any indels at 3% MAF are identified. Last, we use ITD Hunter, a UCMdeveloped tool (S. Kadri, J.P. Segal, unpublished data),which scans the region for reads with valid inserts (containedwithin the reads) or misaligned reads with trailing insertions.This is intended to boost sensitivity for large ITDs, especiallywhen the aligner and indel-realigner fail to accurately alignthe ITD located at the end of the reads, leading to manyalignments with trailing insertions of various sizes(Supplemental Figure S2).ResultsUCM-OncoPlus Tiered Assay DesignThe foundation of the UCM-OncoPlus assay is RocheNimblegen SeqCap EZ custom capture design targeting6,064,966 bp of genomic sequence covering 1212 humangenes relevant to cancer in both the somatic and inheritedcontexts. To facilitate testing of the more clinically relevantgenes, the UCM-OncoPlus capture panel was designed intwo tiers, a first tier with 316 genes deemed to be of higher-The Journal of Molecular Diagnostics
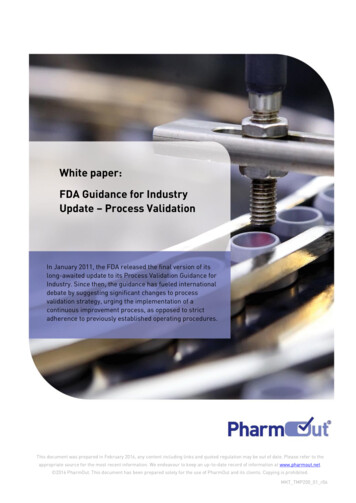
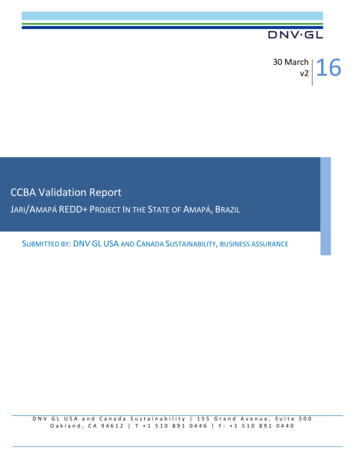
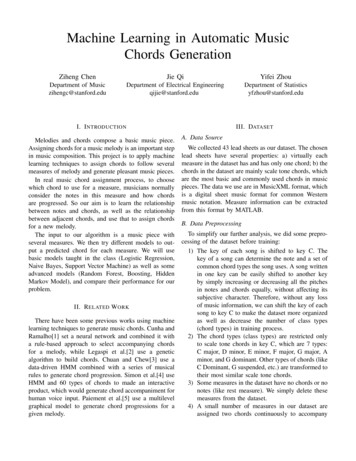
UCM-OncoPlus Clinical Validationclinical relevance and a second tier with 896 genesconsidered more relevant for translational cancer research(Supplemental Table S2). The tiers cover 1.6 and 2.8million coding bp, respectively, as well as padding bases toensure depth across exons. However, the SeqCap EZ synthesis design for this panel includes tier 1 probes at a 3 concentration relative to tier 2 probes to produce higherdepth for clinically important regions and allow increasedmultiplexing of samples for clinical analysis (Figure 1A).The panel includes full exon coverage for all genes, withcoverage of 50 and 30 untranslated regions for the tier 1 geneset. The panel also includes intronic and/or upstreamcoverage for 18 genes for detection of select gene fusions(eg, ALK, RET, and ROS1), intragenic rearrangements (eg,AGene distributionTier 1(316 genes)Coding bases1.6 million bpRelative coverage3 probe53% ofcoding readsMET, EGFR), and promoter mutations (eg, TERT ), as wellas probes to target select cancer-associated viruses. Certainclinically relevant regions that initially showed poor performance because of inefficient capture were supplementedby the addition of biotinylated xGen Lockdown probes(Integrated DNA Technologies, Coralville, IA) to boostcapture efficiency.Multiplexing at a level of nine samples per HiSeq 2500rapid run flow cell yields an average of 25 to 35 million readpairs per sample. Approximately 99% of all reads map successfully to the genome, and an average of 80% are deemedon-target via mapping to within 200 bp of a probe target. Aswith all capture panels, a distribution of depth is noted.However, the tiered design proves to deliver a substantialboost to depth in the tier 1 target region, with approximately53% of all coding bases belonging to tier 1 (Figure 1A), andwith median depths of 785 and 360 in tier 1 and tier 2coding regions, respectively, using nontumor (diploid control) FFPE specimens (Figure 1B). Overall, 99% of targetcoding bases in tier 1 genes were covered by 100 uniquereads, compared with 94% of tier 2 coding bases.Specimens for Clinical ValidationTier 2(896 genes)2.8 million bp1 probeB47% ofcoding readsTier 1 coding bases30002000Median Tier 1 785 99% bases 100 1000Average depth at coding positionsTier 2 coding bases0Median Tier 2 360 94% bases 100 0 Mb0.5 Mb1 Mb1.5 Mb2 Mb2.5 MbFigure 1University of Chicago Medicine OncoPlus tiered design: A: Thecapture panel genes are split in two tiers: tier 1 has 316 genes of highclinical significance, 3 more probe than tier 2 (896 genes), andapproximately 53% of the coding reads. B: The sorted average depth perposition is shown for each tier.The Journal of Molecular Diagnostics-jmd.amjpathol.orgWe assessed the performance of the assay using a total setof 114 validation samples, including 24 nonmalignant (8blood/bone marrow and 16 FFPE spleen) and 80 malignantblood, bone marrow, and FFPE validation samples previously tested on multiple CLIA platforms (including 64tested via NGS assays), and an additional 10 nonmalignant(7 blood and 3 FFPE) samples not previously run on anycomparative assay (Supplemental Table S1). All malignantspecimens were selected because of the presence ofdesired somatic mutations (Supplemental Table S3). Thecomparator assays included the UCM Clinical GenomicsLaboratory OncoHeme and OncoScreen ST1.0 and ST2.0assays, as well as Foundation One from FoundationMedicine (FM). The UCM assays are all amplicon-basedNGS profiling panels, using either Illumina CustomAmplicon technology (OncoScreen ST1.0) or a customized Ion Torrent multiplex PCR preparation (OncoScreenST2.0 and OncoHeme), with sequencing on the IlluminaMiSeq system, whereas the FM assay is a capture-basedassay more similar to UCM-OncoPlus. Of these 80 malignant samples, 64 (54 tested using UCM assays and 10 atFM) were used for testing variant concordance, and 13were a separate set of lung cancer samples from an outsidereference laboratory positive for a variety of ALK/RET/ROS1 fusions. The total set of malignant samples alsoincluded three HER2-amplified samples tested via fluorescence in situ hybridization for copy number analysis.The 24 nonmalignant samples (16 FFPE spleen and 8blood/marrow) were all CLIA-tested via one of the UCMamplicon assays. Sample details, including diagnoses andprior analysis summaries, are shown in SupplementalTable S1.47
Kadri et alPanel Overlaps for Validation AssessmentOf the 81 genes collectively analyzed via our solid tumorand heme malignancy amplicon panels, we selected 76 forclinical validation as part of the UCM-OncoPlus panel(Materials and Methods). Five genes were excluded becauseof inadequate capture efficiency and/or low clinical relevance. The overlap between the panels (genes, intervals,exon, and bp territory) is shown in Supplemental Table S4.Unlike the results for samples sent to FM, we retain all basecall information for each sample analyzed with UCMamplicon NGS panels. Thus, each sample assayed by UCMOncoPlus and OncoScreen ST1.0 or ST2.0 or OncoHemeallowed for the intercomparison of variant calling metrics at16,452, 17,592, or 147,855 unique genomic positions,respectively. In combination, the total overlap region of thepanels allowed comparison of assay performance across atotal of 163,740 unique bases of genomic territory in 874exons of the 76 genes.Sensitivity AnalysisA total of 88 validation samples (78 samples CLIA-tested atUCM and 10 tumor samples sent to FM) CLIA-tested viaclinical NGS were used to test the variant-calling sensitivityof the UCM-OncoPlus assay. Of the 78 samples, 54 weremalignant, whereas the remaining were nonmalignantsamples (Supplemental Table S1).The 10 samples compared against FM included a total of17 reported pathogenic findings within the OncoPlus validation target region (in 9 of the 10 samples, the tenth sampleharboring only an ALK fusion). All 17 were detected byUCM-OncoPlus at a range of MAFs from 5.4% to 95.3%(Table 1), although MAF data from FM were unavailableTable 1for comparison. Exact genomic mutation coordinates werenot available to evaluate concordance (reports containedprotein nomenclature only), but we were able to assesssuccess via comparisons with the Human Genome VariationSociety protein effect nomenclature output.In contrast to the low number of variants available fromthe reference laboratory NGS comparisons, the 78 validation samples tested via UCM amplicon provided a set of2713 expected variants for sensitivity studies, including all136 pathogenic variant calls arising at a variety of MAFs.All other positions were documented to be negative forvariation; thus, all other data points were usable for specificity analysis (below). The 2713 variants originallyobserved at MAF 10% via amplicon assays (the analyticalsensitivity of the UCM-OncoPlus assay) across paneloverlap territory included 2622 single-nucleotide variantsand 91 indel mutations. Observed deletions ranged from 1 to52 bp [the largest in exon 9 of calreticulin (CALR)], whereasinsertions ranged from 1 to 102 bp, including 11 ITD typemutations of the FLT3 gene of sizes 27 to 102 bp. FLT3 ITDdetection by NGS is regarded as challenging,22 and for thisreason the informatics pipeline included special modulesdesign to detect them (Large Indel Detection). Of the 2713expected genomic mutations, all except two were readilydetected.We investigated these two discordant mutation callsfurther. Both missed calls were within the location chromosome X:39,932,800 to 39,932,810 in one heme malignancyspecimen (UC14). Interestingly, UCM-OncoPlus identifiedthree different and unexpected mutations within the samesmall region. On further examination, this represented acomplex BCOR mutation aligned in two different but equallycorrect ways by Novoalign (OncoHeme) versus BWA MEM(UCM-OncoPlus). Thus, the individual component variantVariant Concordance between 17 Pathogenic Findings across 9 of 10 Samples Sent to FMSampleFM geneFM HGVSOncoPlus geneOncoPlus HGVSOncoPlus MAF, YesYesYesYesYesYesYesYesYesYesYesYesYesThree mutations in NFE2L2 and BRCA2 are not included
Three separate amplicon-based NGS oncology LDPs vali-dated for patient care at the UCM Clinical Genomics Laboratory were used as comparators for the UCM-OncoPlus assay. The first, OncoScreen ST1.0, is a 45-gene hot-spot NGS test for somatic mutations in solid tumors using the Truseq Amplicon Cancer Panel13,14 kit (Illumina, San Diego, CA);