Transcription
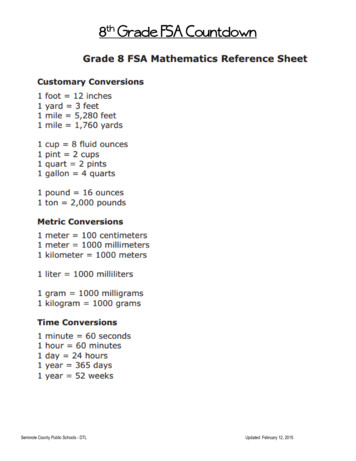
8th Grade FSA CountdownSeminole County Public Schools - DTLUpdated: February 12, 2015
Seminole County Public Schools - DTLUpdated: February 12, 2015
Seminole County Public Schools - DTLUpdated: February 12, 2015
Florida Standards Assessments Test Item DescriptionsThe Florida Standards Assessments (FSA) are composed of test items that include traditional multiplechoice items, items that require students to type or write a response, and technology-enhanced items(TEI). Technology-enhanced items are computer-delivered items that require students to interact withtest content to select, construct, and/or support their answers. Currently, there are nine types of TEIsthat may appear on computer-based assessments for FSAMathematics.Technology-Enhanced Item Types – Mathematics1. Editing Task Choice – The student clicks a highlighted word or phrase, which reveals a drop-down menucontaining options for correcting an error as well as the highlighted word or phrase as it is shown in thesentence to indicate that no correction is needed. The student then selects the correct word or phrase fromthe drop-down menu. For paper-based assessments, the item is modified so that it can be scanned andscored electronically. The student fills in a circle to indicate the correct word or phrase.2. Editing Task – The student clicks on a highlighted word or phrase that may be incorrect, which reveals a textbox. The directions in the text box direct the student to replace the highlighted word or phrase with thecorrect word or phrase. For paper-based assessments, this item type may be replaced with another item typethat assesses the same standard and can be scanned and scored electronically.3. Hot Text –a. Selectable Hot Text–Excerpted sentences from the text are presented in this item type. When the studenthovers over certain words, phrases, or sentences, the options highlight. This indicates that the text isselectable (“hot”). The student can then click on an option to select it. For paper-based assessments, a“selectable” hot text item is modified so that it can be scanned and scored electronically. In this version,the student fills in a circle to indicate a selection.b. Drag-and-Drop Hot Text–Certain numbers, words, phrases, or sentences may be designated “draggable”in this item type. When the student hovers over these areas, the text highlights. The student can thenclick on the option, hold down the mouse button, and drag it to a graphic or other format. For paperbased assessments, drag-and-drop hot text items will be replaced with another item type that assesses thesame standard and can be scanned and scored electronically.4. Open Response–The student uses the keyboard to enter a response into a text field. These items can usuallybe answered in a sentence or two. For paper-based assessments, this item type may be replaced withanother item type that assesses the same standard and can be scanned and scored electronically.5. Multiselect – The student is directed to select all of the correct answers from among a number of options.These items are different from multiple-choice items, which allow the student to select only one correctanswer. These items appear in the online and paper-based assessments.6. Graphic Response Item Display (GRID)- The student selects numbers, words, phrases, or images and uses thedrag-and-drop feature to place them into a graphic. This item type may also require the student to use thepoint, line, or arrow tools to create a response on a graph. For paper-based assessments, this item type maybe replaced with another item type that assesses the same standard and can be scanned and scoredelectronically.7. Equation Editor – The student is presented with a toolbar that includes a variety of mathematical symbolsthat can be used to create a response. Responses may be in the form of a number, variable, expression, orequation, as appropriate to the test item. For paper-based assessments, this item type may be replaced witha modified version of the item that can be scanned and scored electronically or replaced with another itemtype that assesses the same standard and can be scanned or scored electronically.8. Matching Item – The student checks a box to indicate if information from a column header matchesinformation from a row. For paper-based assessments, this item type may be replaced with another itemtype that assesses the same standard and can be scanned and scored electronically.9. Table Item – The student types numeric values into a given table. The student may complete the entire tableor portions of the table depending on what is being asked. For paper-based assessment, this item type maySeminole County Public Schools - DTLUpdated: February 12, 2015
be replaced with another item type that assesses the same standard and can be scanned and scoredelectronically.Seminole County Public Schools - DTLUpdated: February 12, 2015
Geometry(27%)Equations & Expressions(30%)8th Grade rIP# 5X8.G.3.9Stats, Probability &Number System(18%Review 158.SP.1.4X158.NS.1.1X258.NS.1.2X25Seminole County Public Schools - DTLUpdated: February 12, 2015
Name:8th Grade Math: Week 1 FSA CountdownDate:Period:Day 11. 8.EE.1.3A lab has two bacteria cultures. Culture Acontains 8 104 bacteria, and Culture Bcontains 4 106 bacteria. How do the twocultures compare in size?A. Culture A contains twice as manybacteria as Culture B.1B. Culture A contains 2 as many bacteria asCulture B.1C. Culture A contains 25 as many bacteria asCulture B.1D. Culture A contains as many bacteria as50Culture B.2. 8.EE.1.4The average distance between planet Neptuneand the Sun is about 4 109 kilometers. Whatis 4 109 written in standard notation?A. 0.0000000004B. 0.000000004C. 400,000,000D. 4,000,000,0003. 8.EE.2.5Amanda graphed line m and line n on acoordinate plane, as shown below. Which ofthe following statements is true?A. The slope of line m is greater than theslope of line n.B. The slope of line n is greater than theslope of line m.C. The x-intercept of line m is greater thanthe x-intercept of line n.D. The x-intercept of line n is greater thanthe x-intercept of line m.Seminole County Public Schools - DTL4. 8.EE.2.6David wants to purchase some pens. The penshe likes cost 2 each, not including tax. This isrepresented by the graph in the coordinateplane below.Write an equation for the graph of the line.5. 8.G.1.5Triangle PQR, triangle RST, and two anglemeasures are shown below.Line segment QT intersects line segment PS at apoint R.What is the value of x?Updated: February 12, 2015
Name:8th Grade Math: Week 1 FSA CountdownDate:Period:Day 21. 8.EE.1.3How much larger is 6 x 10⁵ compared to2 x 103? Explain how you know.4. 8.EE.2.6David wants to purchase some pens. Thepens he likes cost 2 each, not including tax.This is represented by the graph in thecoordinate plane below.2. 8.EE.1.4In 2005, the US Mint in Denver produced4.04 108 Oregon State quarters. The USMint in Philadelphia produced 7.12 107Oregon State quarters. Considering theother two US Mint locations did notproduce any quarters, how many OregonState Quarters were minted in 2005?Express your answer in scientific notation.3. 8.EE.2.5The graph below represents y, the cost indollars of x pounds of salad at a salad bar.What is the unit rate for the cost of a saladat the salad bar?Explain how similar triangles ABC and DBE formed by the graph, dashed lines,and x-axis are similar in relation to thenumber of pens purchased and the cost.5. 8.G.1.5Right triangle ABC and right triangle ACDoverlap as shown below. Angle DACmeasures 20 and angle BCA measures 30 .A.B.C.D. 0.50 per pound 1.00 per pound 2.00 per pound 4.00 per pound.Seminole County Public Schools - DTLWhat are the values of x and y?Updated: February 12, 2015
Name:8th Grade Math: Week 1 FSA CountdownDate:Period:Day 31. 8.EE.1.3The area of the surface of the AtlanticOcean is approximately 31,830,000 squaremiles. How is this area written in scientificnotation?A. 3.183 x 10⁴B. 3.183 x 10⁵C. 3.183 x 10⁶D. 3.183 x 1072. 8.EE.1.4Evaluate (2.4 104 )(4.5 103 )A. 1.08 107B. 1.08 108C. 1.08 1012D. 1.08 1013Which equation represents the line shownon the coordinate grid below?2A. 𝑦 5 𝑥 22B. 𝑦 5 𝑥 523. 8.EE.2.5Rain is flowing into two containers atdifferent rates. The figure below shows thevolume of water in each container atdifferent times.C. 𝑦 5 𝑥 22D. 𝑦 5 𝑥 55. 8.G.1.5In the diagram, Jefferson Highway is parallelto Independence Boulevard. The CountyCourt House is located at the intersection ofMain Street and Center Avenue.What is the difference in the rate of changebetween the two containers?1A. 5 gallon per minuteB.3C.5D.15gallon per minute522gallon per minutegallon per minuteIf m 1 157 , what is m 3?A. 1800B. 1570C. 460D. 2304. 8.EE.2.6Seminole County Public Schools - DTLUpdated: February 12, 2015
Name:8th Grade Math: Week 1 FSA CountdownDate:Period:Day 41. 8.EE.1.3Which is the larger value: 2 x 10⁶ or 9 x 10⁵?Explain how you know.Which student saved the greatest amount ofmoney each week?Which student saved the least amount ofmoney each week?2. 8.EE.1.4Determine the product of 800.5 (2 106 )A. 1.7 107B. 1.601 107C. 1.7 109D. 1.601 1094. 8.EE.2.6If a line contains the points in the tablebelow, which is the equation of the line?3. 8.EE.2.5Three students saved money for four weeks. Antwan saved thesame amount eachweek for 4 weeks.He made this graphto show how muchmoney he saved.Carla saved thesame amount ofmoney each weekfor 4 weeks. Shemade this table toshow how muchmoney she saved.Omar saved the same amount ofmoney each week for 4 weeks. Hewrote the equation below to showhow much he saved. In the equation,S is the total amount of moneysaved, in dollars, and w is thenumber of weeks.S 2.5wSeminole County Public Schools - DTLA.B.C.D.y -2x 5y 2x – 5y 5x – 2y -5x – 25. 8.G.1.5The measures of the angles of a triangle are50 , 35 , and 95 . What is the measure ofthe largest exterior angle of the triangle?A. 85 B. 130 C. 145 D. 150 Updated: February 12, 2015
Name:8th Grade Math: Week 1 FSA CountdownDate:Period:Day 51. 8.EE.1.3The average distance from Jupiter to the Sunis about 4 x 10⁸ miles. The average distancefrom Venus to the Sun is about 8 x 10⁷miles.The average distance from Jupiter to the Sunis about how many times as great as theaverage distance from Venus to the Sun?In the coordinate plan below, ABC issimilar to AEF.What is the value of x?times2. 8.EE.1.4At a given time, Saturn was 9.1 108 milesfrom the Sun and Earth was 9.3 107 milesfrom the Sun. By what distance is oneplanet closer to the Sun than the otherplanet?A. 2 101B. 2 105C. 8.17 107D. 8.17 1083. 8.EE.2.5Bamboo is one of the fastest-growing plants.A typical growth rate for bamboo intemperate climates is 3-10 centimeters perday during the growth season.Which of the following equations, where trepresents time in days, and L representslength in centimeters, could be descriptionsof the growth of a bamboo plant? Select allthat apply. A. L 1.1t B. L 2.5t C. L 3.6t D. L 7.1t E. L 9.3t F. L 10.4t5. 8.G.1.5Lines l and m are parallel to one anotherand cut by transversals s and t.What is the value of x?A. 40 B. 80 C. 120 D. 140 4. 8.EE.2.6Seminole County Public Schools - DTLUpdated: February 12, 2015
Name:8th Grade Math: Week 2 FSA CountdownDate:Period:Day 11. 8.F.1.1Which of the following tables does notrepresent a function?A.C.B.D.2. 8.F.1.2The total cost in dollars, y, of a membershipat each of four health clubs is representedbelow in terms of x, the number of monthsof the membership.Health Club A: 𝑦 12𝑥 60Which representation has the greatestrate of change?A. Health Club AB. Health Club BC. Health Club CD. Health Club D3. 8.F.1.3Which of the following equations representsa linear function?A. 𝑦 3𝑥 26B. 𝑦 2 𝑥C. 𝑦 𝑥 61D. 𝑦 2 𝑥 34. 8.F.2.4The company charges 45 a day for the caras well as charging a one-time 25 fee forthe car’s navigation system (GPS). Write anequation for the cost in dollars, C, as afunction of the number of days, d, the carwas rented.Health Club B:5. 8.F.2.5Kiki is taking a bicycle ride. During the ride,Kiki is always traveling away from thestarting point. Which of the followinggraphs of distance and time could modelKiki’s ride?Health Club C:Health Club D:A customer pays a one-time fee of 20plus 20 each month for x months.Seminole County Public Schools - DTLA.C.B.D.Updated: February 12, 2015
Name:8th Grade Math: Week 2 FSA Countdown1. 8.F.1.1Which graph below does not represent afunction of x?A.C.B.D.Date:Period:Day 24. 8.F.2.4The graph shows the temperature, in degreesFahrenheit, of a liquid for the first ten minutesof a heating experiment.2. 8.F.1.2A farmer has two water tanks that drain at arate of 2.5 gallons per minute. He is consideringreplacing the existing tanks with new ones,either Model S or Model T. Information aboutthe new tanks is shown below. Each tank holds100 gallons of water and drains at a constantrate. How do the drainage rates of Model Sand Model T compare with the existing tanks?Based on the graph, which expression could beused to calculate the temperature of the liquidafter m minutes?A. 5𝑚 40B. 5𝑚 40C. 10𝑚 40D. 10𝑚 405. 8.F.2.5A bicycle club went on a six-hour ride. Thegraph below shows the relationship between thenumber of hours spent on the trails and thenumber of miles traveled. Which statement bestinterprets information provided by the graph?3. 8.F.1.3Which of the following graphs shows a linearfunction?A.C.B.D.A. The club members rode at a constantspeed for the entire ride.B. The club members stopped for a restduring their ride.C. The number of miles traveled increasedcontinuously throughout the ride.D. The number of miles traveled increasedsome of the time and decreased some ofthe time.Day 3Seminole County Public Schools - DTLUpdated: February 12, 2015
Name:8th Grade Math: Week 2 FSA CountdownDate:Period:1. 8.F.1.1The four tables below show relationships in which xvalues represent inputs and the y-values represent thecorresponding outputs. Which table represents arelationship that is not a function?4. 8.F.2.4The graph below shows the relationshipbetween the distances a delivery truck is drivenand the amount of gas the truck uses. Based onthe graph, what is the average distance, in miles,the truck can be driven using 1 gallon of gas?2. 8.F.1.2Madison created two functions. Forfunction A, the value of y is two lessthan four times the value of x. Thetable to the right represents FunctionB. In comparing the rates of change,which statement about Function A andFunction B is true?A. 10B. 12A. Function A and Function B have the samerate of change.B. Function A has a greater rate of change thanFunction B has.C. Function A and Function B both havenegative rates of change.D. Function A has a negative rate of change andFunction B has a positive rate of change.5. 8.F.2.5The school is 100 meters from Jason’s house.The following describes his most recent trip:C.B.D. 3. 8.F.1.3Which graph represents the equation𝑦 2𝑥 1?A.C. 14D. 16He walked 50 meters toward school in 2minutes. He realized that he left a book at home.He turned around and walked home at the samespeed.He spent 1 minute looking for his book.He walked to school at twice his original speed. Finish a graph that accurately represents Jason’strip.Day 4Seminole County Public Schools - DTLUpdated: February 12, 2015
Name:8th Grade Math: Week 2 FSA CountdownDate:Period:1. 8.F.1.1The table below shows a relationshipbetween x and y that is not a function.Write one ordered pair that can be removedfrom the table to make the relationshipbetween x and y a function.Carmella graphed line p on the coordinategrid shown. Which of the following linesappears to have the same slope as line p?2. 8.F.1.2The table below represents a linear function.Which function has a greater slope and agreater y-intercept than the linear functionrepresented in the table?A.C.B.D.A.B.C.D.𝑦 2𝑥 8.5𝑦 3𝑥 7.5𝑦 5𝑥 6.5𝑦 10𝑥 5.55. 8.F.2.5The table shows the relationship betweenthe average number of hours students studyfor a mathematics test and their averagegrade.3. 8.F.1.3Which equation does not represent a linearfunction of x?3A. 𝑦 4 𝑥Which type of function is most likely tomodel these data?A. linear function with a positive slopeB. linear function with a negative slopeC. non-linear function that decreasesthen increasesD. non-linear function that increasesthen decreases𝑥B. 𝑦 2C. 𝑦 3 2𝑥D. 𝑦 3𝑥 2 24. 8.F.2.4Day 5Seminole County Public Schools - DTLUpdated: February 12, 2015
Name:8th Grade Math: Week 2 FSA Countdown1. 8.F.1.1Which graph represents a function?A.C.B.D.2. 8.F.1.2Consider thegraph of a line.Which equationhas a rate ofchange greaterthan the rate ofchange for theline shown?A. 𝑦 3𝑥 1𝑥B. 𝑦 2 44. 8.F.2.4Date:Period:The table below shows thecost of different numbers ofgoldfish at a pet store. Thecost is a linear function ofthe number of goldfish.Which statement describesthe rate of change of thisfunction?A. The cost increases 0.30 each time 1goldfish is added.B. The cost increases 1.50 each time 1goldfish is added.C. The cost increases 3.00 each time 5goldfish are added.D. The cost increases 6.00 each time 5goldfish are added.5. 8.F.2.5Samantha takes her sister Bethany to theplayground. While they are there, they do thefollowing activities: Bethany rides on the seesaw. Samantha pushes Bethany on the swing. Bethany climbs up the ladder and slidesdown the slide.The graphs of Bethany’s activities are shown.C. 𝑦 2𝑥 2𝑥D. 𝑦 3 33. 8.F.1.3Which phrase describes a nonlinearfunction?A. the area of a circle as a function ofthe radiusB. the perimeter of a square as afunction of the side lengthC. the cost of gasoline as a function ofthe number of gallons purchasedD. the distance traveled by a car movingat constant speed as a function oftimeSeminole County Public Schools - DTLWhich graph represents Bethany’s ride on theseesaw?Updated: February 12, 2015
Name:8th Grade Math: Week 3 FSA CountdownDate:Period:Day 11. 8.SP.1.1Tony collected data on years of employment and theannual salaries of the salespeople at Company Z. Hemade a scatterplot and drew a trend line thatapproximated the line of best fit for the data, asshown to theright. Based onthe trend linedrawn for thedata, what isthe salary asalesperson with3 years ofemployment atCompany Z canexpect to earn?A. A 65-year old person’sexact vision scoreB. A 65-year old person’spredicted vision scoreC. A 65-year old person’sminimum possible scoreD. A 65-year old person’smaximum possible score4. 8.SP.1.4A principal surveyed 75 seventh-grade and eighthgrade students. She asked them if they prefer toobtain the news from the Internet or to obtain thenews from television. She created a table to displaythe data, as shown below.2. 8.SP.1.2An airportterminal runsshuttle buses todifferent parts ofthe airport. Thescatter plot showsthe times for eachpart of the airportand a number ofround trips.Which equation isclosest to the lineof best fit for thisdata?3A. 𝑦 5 𝑥 1How many seventh-grade students responded to thesurvey? Show or explain how you got your answer.5. 8.SP.1.1Mateo is an editor for a publishing company thatprints short stories and academic articles. Last month,Mateo kept track of the number of pages that werein each article or short story he edited and thenumber of typos he found in each. Below is a scatterplot showing the relationship between the number ofpages and the number of typos.3B. 𝑦 2 𝑥 13C. 𝑦 4 𝑥 25D. 𝑦 4 𝑥 23. 8.SP.1.3A researcher studied the eyesight of people atdifferent ages. She calculated a vision score foreach person in the study and plotted the dataon the following graph. The researcher used theline 𝑦 0.1𝑥 110 to model the data. Whenshe substituted the value 𝑥 65 into thisequation, what did the result tell her?Seminole County Public Schools - DTLDo Mateo’s data show a positive association or anegative association? Explain how you know.Updated: February 12, 2015
Name:8th Grade Math: Week 3 FSA Countdown1. 8.SP.1.1Tony collected data on the years ofemployment and the annual salaries of thesalespeople at Company Z. He made ascatterplot and drew a trend line thatapproximated the line of best fit for the data, asshown below. What is the slope of the trendline that Tony drew? Show or explain how yougot your answer.Date:Period:Day 2What could the number 12 represent inAnnette’s equation?A. the number of ridesB. the cost of admissionC. the cost of each ticketD. the number of tickets4. 8.SP.1.4A principal surveyed 75 seventh-grade and eighthgrade students. She asked them if they prefer toobtain the news from the Internet or to obtain thenews from television. She created a table to displaythe data, as shown below.What is the relative frequency of seventh-gradestudents who prefer to obtain the news from theInternet to all the seventh-grade studentssurveyed?2. 8.SP.1.2Which line represents the best fit for the scatterplot data?A.C.B.D.3. 8.SP.1.3Annette plans to visit an amusement park whereshe must pay for admission and purchase ticketsto go on the rides. Annette wants to find thetotal cost for a day at the amusement park. Shewrote the equation 𝑐 1.50𝑥 12 to predict c,the total cost for a day at the amusement park.Seminole County Public Schools - DTL5. 8.SP.1.2The scatter plot shows the sizes and annual rentsof some office spaces in the downtown area of acity. What would the line of best fit revealabout these data?A. There is a strong negative relationship betweenthe cost of rent and the size of the office space.B. There is a strong positive relationship betweenthe cost of rent and the size of the office space.C. There is a weak positive relationship between thecost of rent and the size of the office space.D. There is a weak negative relationship betweenthe cost of rent and the size of the office space.Updated: February 12, 2015
Name:8th Grade Math: Week 3 FSA CountdownDate:Period:Day 31. 8.SP.1.1Tony collected data on the years ofemployment and the annual salaries of thesalespeople at Company Z. He made ascatterplot and drew a trend line thatapproximated the line of best fit for the data, asshown below. What does the slope mean in thissituation?3. 8.SP.1.3The scatter plot to theright shows the fat andcalorie content of severalsnack foods.The function𝑦 10𝑥 190 representsthe relationship ofthe given data. What doesthe 10 in the function represent in therelationship between grams of fat and calories in thesnack food studied?4. 8.SP.1.4A principal surveyed 75 seventh-grade and eighthgrade students. She asked them if they prefer toobtain the news from the Internet or to obtain thenews from television. She created a table to displaythe data, as shown below.2. 8.SP.1.2The scatter plot below shows the outsidetemperature and the sales at an ice cream shopeach day for a period of twelve days.What is the relative frequency of eighth-gradestudents who prefer to obtain the news from theInternet to all the eighth-grade students surveyed?5. 8.SP.1.3The cost to hire aplumber for x hoursis shown on thegraph.Draw the line of best fit for the data on thegraph above.Seminole County Public Schools - DTLFor this graph, whatdoes the yintercept of the lineof best fit mean interms of thecontext?Updated: February 12, 2015
Name:8th Grade Math: Week 3 FSA CountdownDate:Period:Day 41. 8.SP.1.1Tony collected data on the years ofemployment and the annual salaries of thesalespeople at Company Z. He made ascatterplot and drew a trend line thatapproximated the line of best fit for the data, asshown below. Tony expects his salary to beabout 70,000 after he has been employed as asales person at Company Z for 15 years. Use thetrend line and slope to explain whether Tony’ssalary expectation is reasonable.About how many hours willit take for Robin to travel320 miles?4. 8.SP.1.4All 8th grade students at a school answered Yesor No to the two survey questions shown. Do you have a cell phone?Yes NoDo you have an MP3 player?Yes NoThe same students responded to both questions.Complete the two-way frequency table to showthe correct totals for the given data.2. 8.SP.1.2What can you conclude from the scatterplotshown below?5. 8.SP.1.4Twenty-five students were surveyed and asked ifthey received an allowance and if they didchores. The table below summarizes theirresponses.3. 8.SP.1.3The scatter plot below represents the distanceRobin has traveled in the first 6 hours of a trip.The linear equation representing the line is𝑦 30𝑥 20.Seminole County Public Schools - DTLOf the students who do chores, what percent donot receive an allowance?Updated: February 12, 2015
Name:8th Grade Math: Week 3 FSA Countdown1.Date:Period:Day 58.SP.1.1As an editor for a publishing company, Mateo kepttrack of the number of pages that were in each articleor short story he edited and the number of typos hefound in each. Below is a scatter plot showing therelationship between the number of pages and thenumber of typos.Where are the twomost obviousoutliers in Mateo’sdata set located?Explain what eachcoordinaterepresents in thecontext of thissituation.2. 8.SP.1.2A class collected data comparing the number of frogsand the pH level of the water. They were trying todetermine the relationship between these by drawinglines of best fit on the sets of data.Which set of data shows a line that most clearlyrepresents this relationship?A.C.B.D.3. 8.SP.1.3The scatter plot below representsthe distance Robin has traveled inthe first 6 hours of a trip. Thelinear equation representing theline is 𝑦 30𝑥 20.Write a sentence explaining whatthe slope of the equation means inrelation to the context of thisproblem.4. 8.SP.1.4Seminole County Public Schools - DTLMr. Wallace surveyed 75 students at Poole MiddleSchool to find out the students’ favorite place to eatlunch. The results are shown below. Which tableshows the approximate relative frequencies of Mr.Wallace’s data?A.C.B.D.5. 8.SP.1.1The plot shown below describes the relationshipbetween the average income in a city and theaverage rent for a 1-bedroom apartment in that city.What is the best description of this relationship?A. No associationB. Positive linear associationC. Negative linear associationD. Nonlinear associationUpdated: February 12, 2015
Name:8th Grade Math: Week 4 FSA CountdownDate:Period:Day 11. 8.EE.3.7Which statement is true about the equationbelow?3(2 𝑘) 3𝑘 2A.B.C.D.The equation has no solution.The equation has one solution.The equation has two solutions.The equation has infinitely manysolutions.2. 8.EE.3.8Which ordered pair is the solution of thesystem of equations below?{A.B.C.D.3. 8.G.3.9A candy is in the shape of a sphere. Thecandy has a radius of 1.5 centimeters. Whichof the following is closest to the volume ofthe candy? (Use 3.14 for )A. 113 cm3B. 19 cm3C. 14 cm3D. 2 cm34. 8.NS.1.1Which of the following numbers is not arational number?A. -3B. 2.7C. 4D. 5𝑥 2𝑦 63𝑥 8𝑦 4(2, 2)(4, 10)(10, 2)(20, 7)5. 8.NS.1.2List the following expressions in order fromleast to greatest value. 5, 𝜋, 3Seminole County Public Schools - DTLUpdated: February 12, 2015
Name:8th Grade Math: Week 4 FSA CountdownDate:Period:Day 21. 8.EE.3.7What is the solution of the equation3𝑥 7 1?4. 8.NS.1.1For each number, indicate whether it isrational or irrational by placing a checkmark in the correct column.2. 8.EE.3.8Ted has some red blocks and some greenblocks. Each red block weighs the same numberof ouncesEach green block weighs the samenumber of ouncesThe total weight of 2 red blocks and 6green blocks is 23 ouncesThe total weight of 3 red blocks and 4green blocks is 22 ouncesWhat is the total weight of 1 red block and 1green block?A.B.C.D.3 ounces6 ounces6.5 ounces13.5 ounces5. 8.NS.1.2Plot each number on the number linebelow.3. 8.G.3.9A mailing tube in the shape of a cylinder hasa height of 24 inches and a radius of 3inches. What is the volume, in cubic inches,of the mailing tube? (Use 3.14 for )Seminole County Public Schools - DTLUpdated: February 12, 2015
Name:8th Grade Math: Week 4 FSA CountdownDate:Period:Day 31. 8.EE.3.7Which of the following equations hasinfinitely many solutions?A. 2𝑥 3 5 2𝑥B. 2𝑥 3 5 3𝑥C. 3𝑥 5 5 2𝑥D. 3𝑥 5 5 3𝑥2. 8.EE.3.8The system of equations represented by linesp and q is shown on the graph below.Based on the graph, what is the solution ofthe system of equations?3. 8.G.3.9A water tank is in the shape of a rightcircular cylinder with a height of 20 feet anda volume of 320𝜋 cubic feet. What is thediameter, in feet, of the water tank?A. 16B. 10C. 8D. 44. 8.NS.1.1What is the sum of all the integers between 19 and 77?5. 8.NS.1.2Without using your calculator, labelapproximate locations for each of thefollowing:A.B.C.D.(0, 0)(0, 3)(2, 1)(4, 2)Seminole County Public Schools - DTLπ1 (2 𝜋)2 2Updated: February 12, 2015 17
Name:8th Grade Math: Week 4 FSA CountdownDate:Period:Day 41. 8.EE.3.7Barb purchased a loaf of bread for 2 and ppounds of sliced ham at 5 per pound for atotal of 13.25. The relationship betweenwhat she purchased and her total purchaseprice is represented by the equation5𝑝 2 13.25. What was the total numberof pounds of ham that Barb purchased?A.B.C.D.3. 8.G.3.9A box contains 9 identical glass spheres thatare used to make snow globes. The spheresare tightly packed, as shown below. Whatis the total volume, in cubic inches, of all 9spheres? Round your answer to the nearesttenth of a cubic inch.2.25 pounds2.65 pounds3.05 pounds4.65 poun
Feb 12, 2015 · 8th Grade Math: Week 1 FSA Countdown Period: _ Seminole County Public Schools - DTL Updated: February 12, 2015 Day 1 1. 8.EE.1.3 A lab has two bacteria cultures. Culture A contains 8 104 bacteria, and Culture B contains 4 106 bacteria. How do the two cultures compare in size? A