Transcription
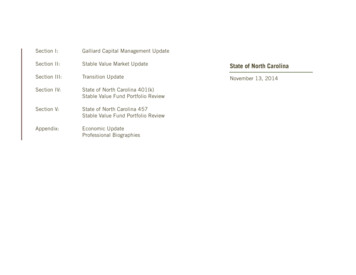
Section I:Galliard Capital Management UpdateSection II:Stable Value Market UpdateState of North CarolinaSection III:Transition UpdateNovember 13, 2014Section IV:State of North Carolina 401(k)Stable Value Fund Portfolio ReviewSection V:State of North Carolina 457Stable Value Fund Portfolio ReviewAppendix:Economic UpdateProfessional Biographies
Galliard Capital ManagementAt a GlanceClient Aligned Investment Solutions Customized investment mandatesfor institutions The cornerstone of our business A consultative approach to produceinnovative investment solutions Total return/traditional marketdriven benchmarks for short,intermediate and long durationstrategies Specialized fixed income strategies Stable value Liability driven investing (LDI) Operating funds management Custom blended benchmarks Insurance reservesDisciplined Lender’s Approach toInvestingValue investors seeking a realizableyield advantage Sustainable Performance In our 20th year of successfullyachieving risk-controlled alphageneration for our clientsExceptional Stability No changes in ownership,management or investmentphilosophy since the firm’sinception 86.2Billion in AUM 77.5Billion in StableValue assets20Years in businessEst. 1995244Institutional InvestorsNationwide108Employees16CFA Charterholders36InvestmentProfessionalsas of 9/30/14State of North Carolina1
Galliard Capital ManagementComposition of Business*Galliard Firm AssetsUnder Management 86.2BillionAssets Under Management(By Strategy): Short Duration: 37.9 Billion Intermediate Duration: 15.6 Billion Broad Market Core & Core Plus: 2.5 Billion Custom: 30.1 BillionAssets Under Management(By Plan Type): Corporate Retirement/Benefit Plans: 66.8 Billion Public Entities: 14.2 Billion Operating Funds: 2.6 Billion Partnerships: 1.3 Billion Foundation/Endowments: 501.4 Million Taft Hartley: 909.8 MillionStable ValueAssets 77.5Billion2014 New Business Summary: 4.6 Billion new assets 15 new clientsRepresentative Stable Value Clients:** Archer Daniels Midland AkzoNobel Inc. National Oilwell Varco Halliburton*As of 9/30/14**Excludes those requesting confidentiality. Inclusion is not performance based nor does it represent any endorsementof Galliard's services by the client.We havesuccessfullymanagedportfolios for abroad array ofapplicationsand clientsState of North Carolina2
Galliard Capital ManagementOrganization ChartExecutive Management TeamCarrie CallahanJohn Caswell, CFAManaging PartnerClient Portfolio Management & ServiceMike NormanPartnerLinh BuoenAssociate DirectorLeela ScattumPartnerRobert Crandall, CFAAssociate DirectorErol Sonderegger, CFAPrincipalTaylor BensonSenior DirectorDoug Rangel, CFAAssociate DirectorMichelle BossSenior AssociateNick Gage, CFASenior DirectorJennifer Hopper, CFASenior AssociateAndrea Johnson, CFADirectorKaleigh CauseyAssociateMatt KlineDirectorEvan HewittAssociateCreditStructured ProductRichard Merriam, CFAFounding ManagingPartnerSector HeadAjay Mirza, CFAManaging PartnerSector HeadRene Hoogmoed, CFAPrincipalBrandon Kanz, CFASenior DirectorRobert Barrett, CFAAssociate DirectorWill Moeller, CFASenior AssociateWilliam WeberDirectorMarketing & Client SupportJane Marie PettyPrincipalSeth MorkSenior AssociateJennifer MillerAssociate DirectorAlison JohnsonAssociateJennifer WedanAssociate DirectorMark PerzichilliAssociateScott BaberSenior AssociateWells Fargo ResourcesKhonsavanhPhonesavanhAssociateErick TralleAssociateJenny WagnerAssociateMatt Robertson, CFASenior DirectorKarl TourvilleFounding Managing PartnerOperations & TechnologyRasaan EllisonAssociate DirectorJeff HayAssociateMark OttoAssociate DirectorMatt HeutinckAssociateChad FooteChief OperatingOfficerSenior PrincipalAdam MaatzAssociatePeter AndersonDirectorAndrew McKessockAssociateGeorge JonesDirectorCarmen Rangel, CPAAssociate DirectorBrian BrooksSenior AssociateMike MeerovichDirectorJohn Kenley, CFADirectorLaura Sell, CFADirectorPortfolio Analysis & SupportFixed Income Sector TeamsChad CallahanPrincipalDavid FerrySenior DirectorManaging PartnerFounding Managing PartnerMatt BentleyPrincipalJordan BewleySenior AssociateAjay Mirza, CFARichard Merriam, CFAFounding Managing PartnerMarco PerzichilliDirectorPhil KosSenior AssociateBen ModicaAssociateMarylynn ShapiroDirectorGauri JadhavAssociate DirectorSuthisa KrupinskiSenior AssociateTim NoelAssociateSue StachelDirectorJohn HammarSenior AssociateJason SkullSenior AssociateLily SihavongAssociateLisa AndersonAssociate DirectorElizabeth SmithleySenior AssociateJesse AhlbrechtAssociateBrent ThorntonAssociateJoe AtkinsonAssociate DirectorTyler WadsworthSenior AssociateHeather GoserudAssociateWilliam IngleAssociate DirectorElena KetterAssociate DirectorJimmie WuAssociateContract Management & AdministrationComplianceDavid LuiPrincipalChristina MosherSenior AssociateJennifer LammersChief Compliance OfficerKristin Daniels, CPASenior DirectorNicole BergerAssociateBrian ReneltSenior AssociateTami Pearse-ByczekSenior DirectorLisa BernardAssociateLaurie KernAssociatePaula NovickDirectorErica BloudekAssociateMadonna MochinskiAssociateEric VercauterenAssociate DirectorChristopher HoffmanAssociateGary PoonAssociate DirectorChristopher SmithAssociate DirectorTroy VisnovecAssociate DirectorMike BouskaSenior AssociateJennifer deFiebreSenior AssociateFiona DonahoeSenior AssociateBrian HeruthSenior AssociateDeanna MoriartySenior AssociateStephanie RipleySenior AssociateCorey WeberSenior AssociateMichael AmundsenAssociatePreston GhizoniAssociateGeneva HanvikAssociateCharles HeadAssociateLee JacobsenAssociateTiffany PetersonAssociateStacie SandagerAssociateAhmed TaherAssociateAngela WaltonAssociateNew in 2014Human Resources, Legal Department, Trust Operations, Investment Mgmt Technology, Compliance/Risk Mgmt, Economic Research, Credit Research, FinanceState of North Carolina3
Stable Value Market UpdateStable Value Market ViewMarket ViewRegulatory/DCMarketEnvironmentGalliard Positioning Dodd Frank stable value study yet to be completed SEC approved changes to money market mutual fundregulationsExisting contracts exempt; no detrimental impactexpected Monitoring impact on liquidity vehicles used DC plan design evolving to improve participant outcomes Leading industry efforts to ensure stable value meets plansponsor needs Capacity continues to improve; current supply isgreater than the demand Have negotiated ample capacity for existing and newclients 17 providers in the market currently issuing capacity(4 banks & 13 insurance companies) Galliard has strong relationships with all major marketparticipants Issuers continue to be selective about the managersand portfolio strategies they are willing to wrap Galliard continues to be a preferred managerWrap providers beginning to be more flexible withrespect to the investment guidelines Working with providers to increase investment latitude More favorable/balanced approach to contractprovisionsNegotiating to standardize more advantageous contractprovisions Evidence of participant reallocation to riskier assets Economic data suggests increased likelihood of risingratesLiquidity buffers well positioned to accommodateparticipant redemptions Maintaining portfolio durations between 2.5 to 3 years tobe more responsive to rising rates Opportunistically seeking yield in high quality spreadassetsContract IssuersPortfolio Reinvestment rates remain historically lowState of North Carolina4
Stable Value Market UpdateGalliard Wrap Issuer SummaryAs of September 2014:AcceptingDeposits fromNew Clients*AcceptingDeposits fromExistingClients*Contract Type**Asset Management***S&PCredit RatingMoody'sCredit RatingAmerican General LifeYesYesSBICGalliard, Payden & RygelA A2MassMutual Life Ins. Co.YesYesSAGICGalliard, BabsonAA Aa2Metropolitan Life Ins. Co.YesYesSAGICGalliard, PIMCO, Dodge & CoxAA-Aa3Nationwide Life Ins. Co.YesYesSBICGalliardA A1New York Life Ins. Co.**YesYesSBIC & SAGICNew York LifeAA AaaPacific Life Ins. Co.YesYesSBICGalliard, PIMCO, Pacific Asset Mgmt.A A1Prudential Life Ins. CoYesYesSBICGalliard, Prudential, JennisonAA-A1RGA Reinsurance Co.YesYesSBICGalliardAA-A1Royal Bank of CanadaYesYesSBICGalliardAA-Aa3State Street Bank and Trust Co.YesYesSBICGalliardAA-Aa3TIAA-CREF LifeYesYesSAGICTIAA-CREFAA AaaTransamerica Premier Life Ins. Co.****YesYesSBICGalliard, PIMCO, Dodge & CoxAA-A1Voya Life Ins. and Annuity Co.****YesYesSBICGalliard, Voya, PIMCO, Dodge & Cox, IR&MA-A3Bank of Tokyo-Mitsubishi UFJPendingPendingSBICPendingA Aa3JP Morgan Chase Bank, N.A.PendingPendingSBICPendingA Aa3Name*Providers accepting deposits on a case by case basis** Security Backed Investment Contract (SBIC) or Separate Account GIC (SAGIC)***Managers typically utilized within Galliard Stable Value solutions****Previously known as ING Life and Monumental Life, respectivelyState of North Carolina5
State of North Carolina Stable Value FundsTransition UpdateDecember 2010- Galliard assumes oversight, daily valuations, and administration of stable value funds- Transitioned custody of the 457 Plan Payden & Rygel portfolio to Wells FargoJanuary 2011- Changed 401(k) Plan’s Prudential benchmark from Broad Market to Intermediate Aggregate- Transitioned PIMCO to intermediate duration strategy wrapped by MetLife and increaseallocation to 15% of assets- Funded Galliard short duration strategy with United of Omaha WrapFebruary 2011- Began termination of State Street securities lending program in the 401(k) Plan- Transitioned 457 Plan’s Prudential intermediate duration strategy to Galliard collective trust- Liquidation of GWL trading account and funding of the Wells Fargo STIF and Wells Fargo SRF liquidity buffer- Transitioned custody of the 401(k) Payden & Rygel portfolio to Wells Fargo- New guidelines established for Payden short duration strategyMarch 2011- Transition 401(k) Plan’s Prudential investment to intermediate duration collective trustJuly 2011- Moved from declared rate to actual portfolio returns2012- Changed STIF to Wells Fargo Government Money Market- Finalize portfolio strategy recommendations2013- Secured wrap coverage for Payden & Rygel with American General Life- Reduced exposure to PIMCO/Met Life to 13% target- Allocated 15% to Jennison under Prudential wrap2014- Finalized Nationwide wrap contract to replace United of Omaha- Reducing Great West Life to 20% targetState of North Carolina6
State of North Carolina 401(k) PlanTransition UpdatePortfolio Allocation 401(k) 9/30/14Initial Portfolio AllocationPIMCO Int.Duration12.8%GWL TradingAccount6%GWL Int.Duration31%WF Gov't MoneyWF StableMarketReturn Fund3.8%6.5%Payden Short20%Galliard Short11.8%GWL Int.Duration23.0%Prudential Int.Duration13.9%PIMCO BroadMarket9%PrudentialBroad Market34%Jennison Int.Duration13.7%Payden Short14.5% Prudential Wrap Liquidity Buffer GWL Great West Life Wrap Prudential Wrap MetLife AGL NationwideDuration3.1 yearsDuration3.03 yearsAvg. QualityAAAvg. Quality# of Managers4# of Managers6# of Providers2# of Providers5AA State of North Carolina7
State of North CarolinaExpense DisclosureTotal Annual Fund Operating ExpensesTotal Annual Operating Expenses are deducted directly from the Fund’s net asset value and reduce theinvestment option’s rate of return.401(k) PlanExpense Ratio(as of 9/30/14)401(k) PlanEst. AnnualRevenue457 PlanExpense Ratio(as of 9/30/14)457 PlanEst. AnnualRevenueInvestment Management Fees paid to Galliard0.073% 1,386,1930.073% 287,517Investment Management Fees paid to Non-AffiliatedInvestment Advisors0.057% 1,077,3370.059% 231,61410.170% 3,232,1050.173% 681,8100.047% 886,4220.044% 171,098ExpenseInvestment Contract FeesAcquired Fund Fees2-Investment Contract Fees0.012%0.012%0.034%0.031%-Other Acquired Fund Fees and Non-AffiliatedInvestment Management Fees paid to NonAffiliated Investment Advisors312b-1 Distribution FeeNoneNoneOther Expenses0.104% 1,972,1480.104% 409,053Total Annual Fund Operating Expense 40.451% 8,554,2050.453% 1,781,0921Theseare fees paid to create and maintain the investments used by a stable value fundare fees borne indirectly by the Fund when it acquires an interest in another fund which pays its ownseparate fees3Includes audit fees for the cost of producing a report by a qualified auditor4Total Annual Fund Operating Expenses are reflected daily in the Fund’s net asset value (NAV)2TheseState of North Carolina8
Stable Value Portfolio Review - North Carolina 401(k) Stable Value FundThird Quarter 2014Annualized Investment Performance*Periods Ending September 30, 2014Book Value Performance1 Mo3 MosYTD1 Yr3 Yr5 Yr10 YrSinceInception**Portfolio (net of all fees)Merrill Lynch 3 Month T-Bill 100 bpsMerrill Lynch 3 Month T-Bill 150 bps3 Year Constant Maturity Treasury 3.591.93Book Value Performance20132012201120102009Portfolio (net of all fees)Merrill Lynch 3 Month T-Bill 100 bpsMerrill Lynch 3 Month T-Bill 150 bps3 Year Constant Maturity Treasury 071.620.112.260.102.960.131.500.212.72Market Value BenchmarkBlended Benchmark***Calendar Year PerformanceMarket Value BenchmarkBlended Benchmark***Market IndicesMerrill Lynch 3 Month T-BillConsumer Price Index*Returns for periods of less than one year are not annualized.**Galliard’s management of this portfolio began December 1, 2010. Periods that exceed Galliard’s tenure with the portfolio include Galliard performance linked with historical portfolio returns.***10% BofAML 3 Month U.S. T-Bills, 30% Barclays Capital 1-3 Yr U.S. Govt/Credit, 60% Barclays Capital Intermediate U.S. Aggregate. This blended market value benchmark approximates theasset allocation target for the State of North Carolina Stable Value Fund. It is important to note that fundamental differences arise when comparing book value performance to a market index,especially when comparing performance for periods shorter than 10 years. Market value indices immediately reflect the gains/(loses) resulting from changing market interest rates while book valueperformance amortizes these gains/(losses).State of North Carolina9
Stable Value Portfolio Review - North Carolina 401(k) Stable Value FundThird Quarter 2014Portfolio CharacteristicsTotal AssetsAverage Holdings Quality**Number of Contract Issuers 1,896,296,392AA 5Blended Yield (After fees)*Effective DurationMarket/Book Value Ratio1.81%3.03 years101.82%*Blended yield is after investment management fees, wrap fees and administration fees.**The Average Holdings Quality of the portfolio has NOT been assessed by a nationally recognized statistical rating organization. The Average Holdings Quality shown represents an averagequality of the underlying individual holdings' Composite Ratings, as rated by S&P, Moody's and Fitch.Sector DistributionPortfolio DistributionContract Value ( )% of Portfolio% of Portfolio09/30/201406/30/2014Cash & Equivalents*71,155,4543.84.1Stable Value 5.735.753.726.227.5 1,896,296,392100.0%**100.0%**Insurance Separate AccountsIntermediate PortfolioSecurity Backed ContractsShort PortfolioIntermediate PortfolioTotal*Includes Receivables and Payables**Total % of portfolio may not add to 100% due to roundingState of North Carolina10
Stable Value Portfolio Review - North Carolina 401(k) Stable Value FundThird Quarter 2014Historical Book Value Crediting Rate*Market Value to Book Value Ratio*643 2.652.712.522.242.0221.8311.761.791.81MV/BV Ratio (%)Blended Yield (%)50108107106 105.24104.56105103.97104102.34103101.82 101.85101.82101.70101.281021011009998*Blended yield is after investment management fees, wrap fees and administration fees.Underlying Duration Distribution**Contract Quality Distribution*603553.930403023.02010019.3% of Portfolio% of Portfolio5031.228.6252020.619.715103.850*Total % of portfolio may not add to 100% due to rounding. The quality distribution shown represents the distribution of the individual holdings’ Composite Ratings, as rated by S&P, Moody’s and Fitch.**Total % of portfolio may not add to 100% due to rounding. Duration distribution of the externally managed portfolios is provided by the external manager.State of North Carolina11
Stable Value Portfolio Review - North Carolina 401(k) Stable Value FundThird Quarter 2014Portfolio Distribution*Manager Distribution*3.8%6.5%Stable Value Funds26.3%63.4%Cash13.9% 3.8%Cash & Equivalents**Galliard18.3%12.8%Great WestJennison Assoc.Short Portfolio14.5%Payden & Rygel23.0%Intermediate PortfolioPIMCO13.7%Prudential*Book value**Includes Receivables and PayablesUnderlying Fixed Income Credit Quality*AAAAA76.13.6ABBBUnderlying Fixed Income Asset Allocation**13.37.0U.S. Treasury/AgencyOther U.S. GovernmentCorporatesTaxable MunicipalsAgency MBSNon-Agency MBSCMBSAsset BackedIntl 924.30.14.57.11.30.16.4*Market value. Total % of portfolio may not add to 100% due to rounding. The quality distribution shown represents the distribution of the individual holdings’ Composite Ratings, as rated by S&P, Moody’s and Fitch. Ratings shown as NR/NA are not rated or not available securityratings. The external managers provide portfolio holdings, and the securities are classified using Galliard's analytics and methodology**Market value. Total % of portfolio may not add to 100% due to rounding. The external managers provide portfolio holdings, and the securities are classified using Galliard's analytics and methodology.State of North Carolina12
Stable Value Portfolio Review - North Carolina 401(k) Stable Value FundThird Quarter 2014 40.0 30.0 20.0 10.0 0.0- 10.0- 20.0- 30.0- 40.0- 50.0- 14Jul'14Aug'14Sep'14Net Cash Flow (Millions )Historical CashflowsYTD201320122011Beginning Assets 1,870.9 1,829.1 1,702.4 1,594.4Net Cash Flow ( )* 0.5 2.4 79.1 61.7Net Cash Flow (%)0.03%0.13%4.65%3.87%Estimated Investment Earnings 24.9 39.4 47.6 46.3 1,896.3 1,870.9 1,829.1 1,702.4Ending Assets*** Contributions, Withdrawals and Investment Transfers**Cashflows may not net to final assets due to roundingState of North Carolina13
State of North Carolina Stable Value FundsMarket Value 401(k) Plan Performance SummaryShort DurationManager3 Months1 Year3 YearsPayden & Rygel0.08%1.26%Barclays Capital 1-3 Yr. Govt/Credit0.04%Since 3%Barclays Capital 1-3 Yr. Government *0.03%0.52%0.51%1.11%Barclays Capital 1-3 Yr. Gov't/Credit5 .12%3 Months1 Year3 YearsPrudential Investment Management0.03%2.85%Barclays Capital Intermediate Aggregate0.03%Intermediate DurationManagerSince rclays Capital Intermediate %Great West Life0.10%2.92%2.35%2.35%Barclays Capital Intermediate Aggregate (Ex 0.31%JennisonBarclays Capital Intermediate Govt/Credit5 Years2/1/201110/1/20118/1/2010*Index being shown for comparison purposes only, the fund is managed to a targeted duration. Returns shown are after investment management fees.**Reflects performance of Galliard Short Duration Fund B through 2/28/14 at which time Fund B was consolidated.State of North Carolina14
State of North Carolina Stable Value FundsImpact of Rising Market Rates – 401(k) PlanSegmentManagerShort DurationPayden & RygelGalliardIntermediate DurationPrudentialPIMCOGreat West LifeJennisonTotal FundPeriodBook ValueMarket ValueMV/BV ting Rate6/30/2014 274,620,410 277,842,918101.2%0.75%1.531.29%9/30/2014 275,671,228 278,067,321100.9%0.90%1.631.27% 1,050,818 224,403-0.3%0.15%0.10-0.02%6/30/2014 221,838,402 225,946,160101.9%1.08%1.991.71%9/30/2014 222,975,984 225,827,011101.3%1.26%2.031.82% 1,137,582 -0.6%0.18%0.040.11%6/30/2014 261,114,179 270,654,465103.7%1.72%3.942.30%9/30/2014 262,661,951 270,724,407103.1%2.07%4.032.33% 1,547,772 69,942-0.6%0.35%0.090.03%6/30/2014 241,866,483 248,399,521102.7%1.78%3.952.30%9/30/2014 243,064,727 247,500,575101.8%1.88%3.521.98% 1,198,244 -0.9%0.10%(0.43)-0.32%6/30/2014 433,856,074 445,302,829102.6%2.09%3.622.62%9/30/2014 436,714,987 445,480,149102.0%2.25%3.652.64% 2,858,913 177,320-0.6%0.16%0.030.02%6/30/2014 258,512,188 267,957,405103.7%1.41%3.982.30%9/30/2014 260,208,599 268,195,748103.1%1.56%3.982.33% 1,696,411 238,343-0.6%0.15%-0.03%6/30/2014 1,892,172,998 1,936,468,561102.3%1.47%3.042.01%9/30/2014 1,896,296,392 .00% 4,123,394 (119,149)(898,946)(5,674,435)State of North Carolina15
Stable Value Portfolio Review - North Carolina 401(k) Stable Value FundThird Quarter 2014Issuer Rating SummaryS & P RatingAmerican General Life Ins. Co.GreatWest Life Insurance Co.Metropolitan Life Ins. Co.Nationwide Life Ins. Co.Prudential Ins. Co. of AmericaMoody’s Rating9/30/20146/30/20149/30/20146/30/2014A AAAAA AA-A AAAAA AA-A2Aa3Aa3A1A1A2Aa3Aa3A1A1American General Life Ins. Co. Strong capital levels All life businesses except New York were consolidated into this subsidiary at year end 2012 Leading positions in a diverse set of productsGreatWest Life Insurance Co. Aggressive dividend taking by the parent, combined with General Account growth, results in low capital levels and ratios Strong positions in niche markets Reliant on support from parent company; the leading insurer in Canada which had solid 2013 resultsMetropolitan Life Ins. Co. Largest U.S. life insurer by invested assets Exited Fed oversight by shedding banking operations, though likely to be declared a non-bank SIFI Capital ratios have rebounded since year end but remain below 2011 and 2012 levelsNationwide Life Ins. Co. Part of a leading mutual group that includes a leading P&C company Strong history of earnings Significant variable annuity exposure has resulted in volatile earningsPrudential Ins. Co. of America A leading diversified U.S. life insurer Surplus continues to show solid growth Higher than industry average investment risk with exposure to commercial real estate, non-Agency CMOs, equities and high yield bondsThe information contained herein reflects the views of Galliard Capital Management, Inc. & sources believed to be reliable by Galliard as of the date of publication. The viewsexpressed here may change at any time subsequent to the date of publication. This publication is for informational purposes only.For institutional investors only.State of North Carolina16
North Carolina 401(k) Stable Value Fund Portfolio ReviewPortfolio HoldingsSeptember 30, 2014Asset IDSecurity DescriptionManagerContractValue ( )MarketValue ( )Market/Book% ofValue Ratio (%) Portfolio Yield (%)Maturity*EffectiveDuration (yrs)S&PRatingMoody's WrapRating Fee (bps)Cash & EquivalentsFUNDAVAILCash Receivable / aaVP45600 1WF Adv Government Money 43,461100.06.51.602.42AA-Aa3Total Cash & EquivalentsStable Value Funds949907109Wells Fargo Stable Return Fund GTotal Stable Value FundsInsurance Separate AccountsIntermediate Portfolio391997NH2GreatWest Life Insurance Co.Great AAa315.0590994VM8Metropolitan Life Ins. 3Total Intermediate PortfolioTotal Insurance Separate AccountsSecurity Backed ContractsShort Portfolio946996EE1American General Life Ins. Co.Payden & A A225.0896994GW4Nationwide Life Ins. M.2.03A A123.0498,647,212503,894,332101.126.31.521.81A A2Total Short PortfolioIntermediate Portfolio744999CV3Prudential Ins. Co. of AmericaJennison 8AA-A117.0744999CV3Prudential Ins. Co. of .62.334.01AA-A1Total Security Backed 93AA-A1Total -A1Total Intermediate Portfolio*N.S.M. No Stated MaturityState of North Carolina17
Fixed Income Portfolio Review - North Carolina 401k - Payden & RygelThird Quarter 2014####Annualized Investment Performance*Periods Ending September 30, 20143 MosYTD1 Yr3 YrSinceInception**5 .921.451.451.651.65*Returns for periods of less than one year are not annualized. Returns shown are before fees.**Performance Inception: July 01, 2009***Barclays U.S. 1-3 Year Government/Credit Bond IndexPortfolio d Average Quality**AA-AA Total Assets 278.1 millionWeighted Average Maturity2.16 years1.91 yearsNumber of Issues216Weighted Coupon1.30%Yield to Maturity0.90%0.73%Effective Duration1.63 years1.86 yearsPortfolio characteristics are calculated by Galliard based on external manager supplied holdings.*Barclays U.S. 1-3 Year Government/Credit Bond Index**The Weighted Average Quality of the portfolio has NOT been assessed by a nationally recognized statistical rating organization. The Weighted Average Quality shown represents an average quality of theindividual holdings’ Composite Ratings, as rated by S&P, Moody’s and Fitch.North Carolina 401k - Payden Rygel18
Fixed Income Portfolio Review - North Carolina 401k - Payden & RygelThird Quarter 2014Sector Distribution% of .9%0.2%% of .3%0.4%% of 7.6%0.0%100.0%**100.0%**100.0%**AAAAAABBB BBBNR/NA% of Portfolio06/30/201455.5%2.9%21.9%19.7%0.0%0.0%% of Portfolio09/30/201453.4%3.5%24.2%18.9%0.0%0.0%% of 100.0%**100.0%**100.0%**U.S. Government/Agency DebenturesOther U.S. GovernmentTaxable MunicipalCorporatesAsset Backed Securities (ABS)Commercial Mortgage Backed Securities (CMBS)Mortgage Backed Securities (MBS)Sovereign / SupranationalsCash / EquivalentsTotalQuality Distribution***Portfolio statistics are calculated by Galliard based on external manager supplied holdings.*Barclays U.S. 1-3 Year Government/Credit Bond Index**Column percentage may not add exactly due to rounding***The quality distribution shown represents the distribution of the individual holdings’ Composite Ratings, as rated by S&P, Moody’s and Fitch. Ratings shown as NR/NA are not rated or not available security ratings.North Carolina 401k - Payden Rygel19
Fixed Income Portfolio Review - North Carolina 401k - Payden & RygelThird Quarter 2014Duration Distribution0-1 yrs1-3 yrs3-5 yrs5-10 yrs10 yrsTotal% of Portfolio06/30/201428.7%67.9%3.4%0.0%0.0%% of Portfolio09/30/201427.9%70.0%2.2%0.0%0.0%% of 00.0%**100.0%**Less Than 1 yr27.91.170.01-3 yrs3-5 yrs5-10 yrs10 ty Distribution0-1 yrs1-3 yrs3-5 yrs5-10 yrs10 yrsTotal% of Portfolio06/30/201410.8%75.8%13.4%0.0%0.0%% of Portfolio09/30/201410.3%77.9%11.8%0.0%0.0%% of 100.0%**100.0%**Less Than 1 yr0.010.377.91-3 yrs3-5 yrs5-10 yrs10 folio statistics are calculated by Galliard based on external manager supplied holdings.*Barclays U.S. 1-3 Year Government/Credit Bond Index**Column percentage may not add exactly due to roundingDisclosure: Galliard Capital Management has exercised reasonable professional care in the preparation of this material. We cannot, however, guarantee the accuracy of all information contained herein.North Carolina 401k - Payden Rygel20
Fixed Income Portfolio Review – Galliard Short High Quality Core Fixed Income Fund - FThird Quarter 2014Annualized Investment Performance*Periods Ending September 30, 2014Book Value Performance1 Mo3 MosYTD1 Yr3 Yr5 Yr10 YrSinceInception**Portfolio (net of all fees)Merrill Lynch 3 Month T-Bill 100 bpsMerrill Lynch 3 Month T-Bill 150 bps3 Year Constant Maturity Treasury 3.591.93Market Value BenchmarkBlended Benchmark****Returns for periods of less than one year are not annualized.**Galliard Performance Inception: January 01, 2010Galliard Short High Quality Core Fixed Income Fund - F21
Fixed Income Portfolio Review - Galliard Short High Quality Core Fixed Income Fund - FThird Quarter 2014####Annualized Investment Performance*Periods Ending September 30, 20141 Mo3 MosYTD1 Yr3 YrSinceInception**5 YrPortfolio-0.18 -0.18-0.05 mark***-0.06 .03*Returns for periods of less than one year are not annualized. Returns shown are before fees.**Galliard Performance Inception: January 01, 2005***Barclays Capital 1-3 Yr Government. Benchmark information shown is used for comparative purposes only. The fund is managed to a targeted duration of 2.0 years.Po
Evan Hewitt Associate Jennifer Lammers Chief Compliance Officer Brian Renelt Senior Associate Laurie Kern Associate Madonna Mochinski Associate Rasaan Ellison . WF Gov't Money Market 3.8% WF Stable Return Fund 6.5% Galliard Short 11.8% Prudential Int. Duration 13.9% Jennison Int. Duration 13.7% Payden Short 14.5% GWL Int. Duration 23.0% PIMCO .